
Quick Summary
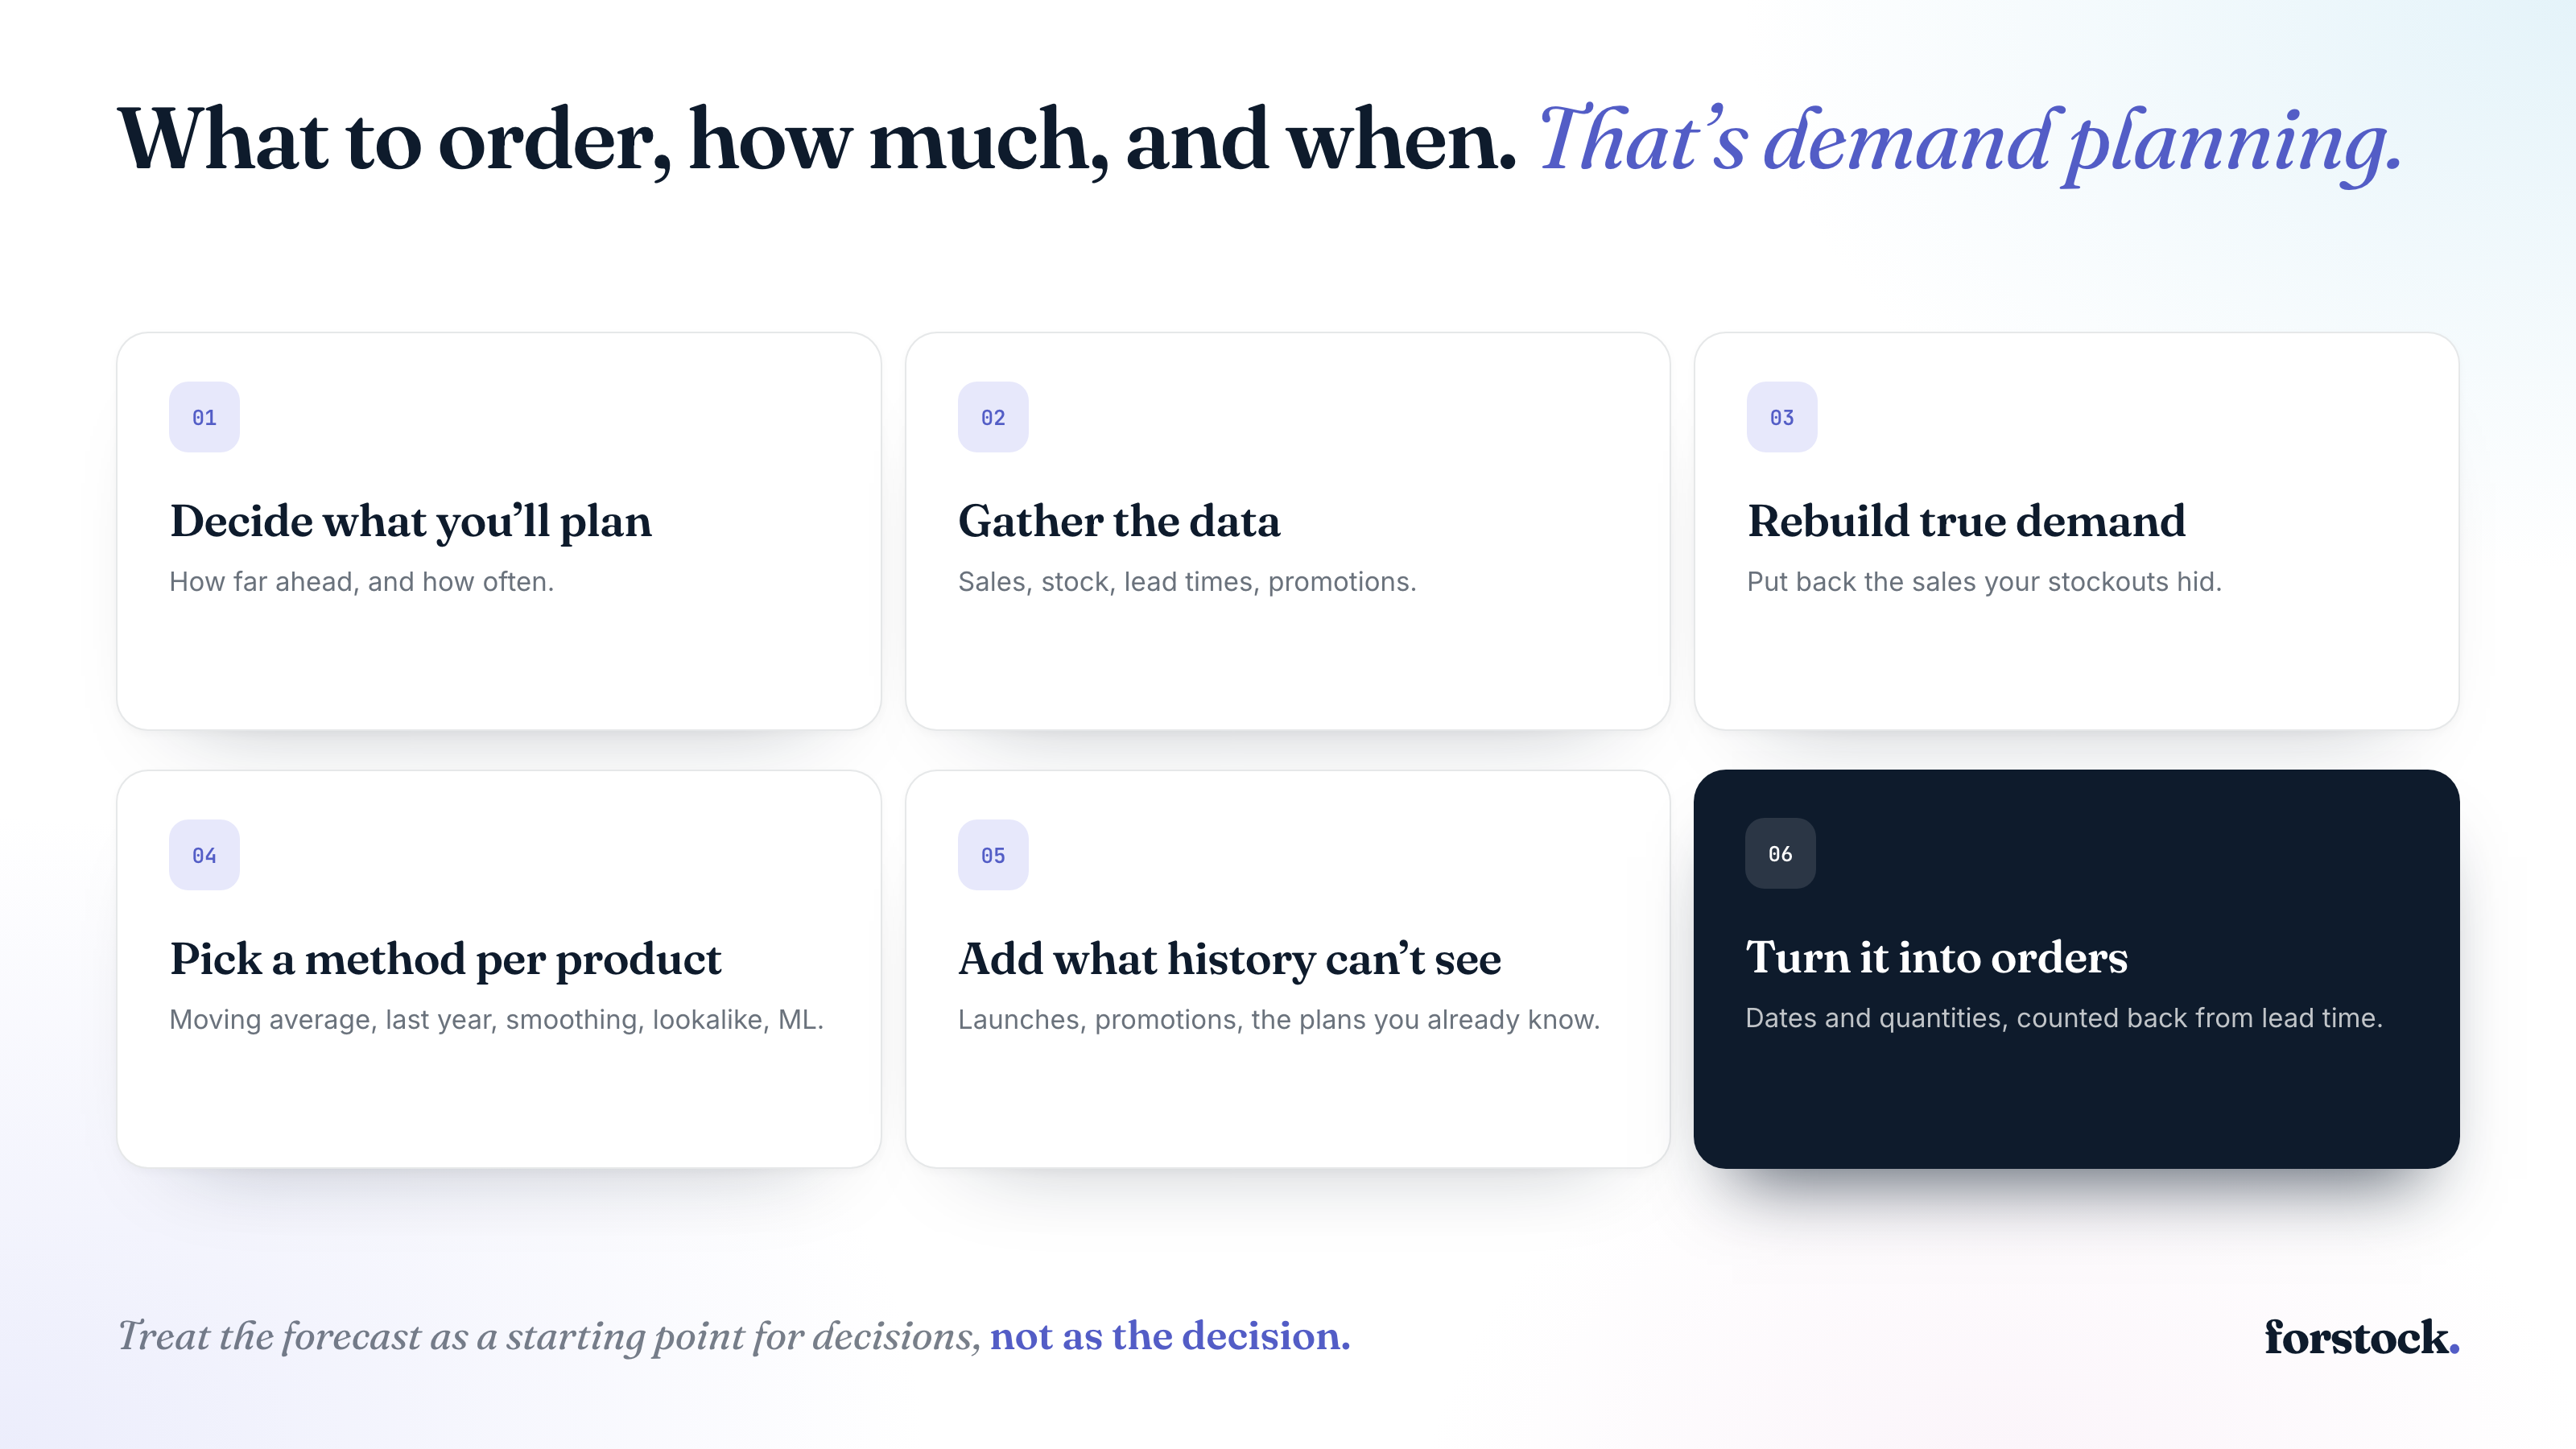
Inventory demand planning tells you what to order, how much, and when. Correct your sales history for stockouts and promotions, pick a forecast method for each product, then count back from lead time. Treat the forecast as a starting point for decisions, and check it against what you sold each week.
Stockouts Can Start Weeks Before the Shelf Goes Empty
A stockout often starts weeks before anyone notices, with an order placed too late or too small. In a worldwide study of 661 retail stores, nearly half of all out-of-stocks traced back to poor ordering and forecasting. Also, they're expensive. NielsenIQ found that out-of-stock items cost US retailers $82 billion in 2021, or 7.4% of their sales.
Although those figures come from grocery and packaged goods rather than ecommerce, the cause they point to is the same: ordering decisions made on weak forecasts. Fixing that starts with knowing what to order, how much, and when. The steps below show you how.
Why Listen to Us?
Authentic Stadium, a sneaker and streetwear store in Dakar, reports about 50% fewer stockouts on its key models since switching to Forstock. The team now gets weeks of warning before a stockout and saves about five hours a week on replenishment.
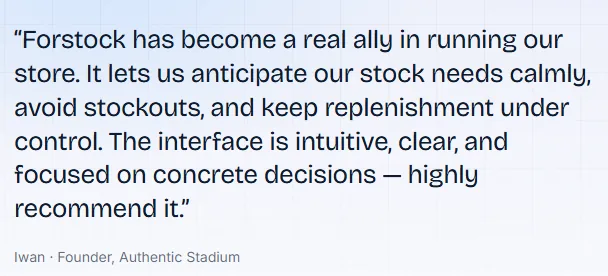
In Paris, the archive fashion brand, cesarARCHIVES, has about 40% fewer stockouts and no longer plans reorders in spreadsheets. Both brands sell fashion and footwear, where individual sizes and styles run out at different speeds. That's exactly the problem demand planning exists to solve.
What Is Inventory Demand Planning?
Inventory demand planning combines demand forecasting with inventory replenishment decisions. It predicts how much of each product a business is likely to sell, then uses that forecast to determine what to order, how much to order, and when to place the order. This brings two tasks that are often managed in separate spreadsheets into one connected process.
The result is usually an actionable inventory plan at the SKU (stock keeping unit) level. Each product variation, such as a particular size and color, counts as its own SKU. And for each SKU at each location, the plan estimates expected sales by week, an order-by date, and an order quantity.
The order-by date and quantity are what set demand planning apart from demand forecasting. A forecast is just your best estimate of what'll sell. Demand planning takes it all the way to the purchase order, with lead times and supplier minimums built in. It also adds safety stock which are the extra units you need to keep as a buffer.
How to Do Inventory Demand Planning
Work through these six steps the first time you build a plan. After that, steps three to six become a weekly routine. You'll only come back to the first two when you add a channel, warehouse, or supplier.
To keep the math concrete, we'll follow one product the whole way through: a black hoodie in size M.
1. Decide What You'll Plan, How Far Ahead, and How Often
Every order ships a specific size from a specific warehouse, and that's where stockouts happen. A hoodie forecast can be right overall while size M sells out in one warehouse and XL piles up in another.
So plan each variant at each location. If you sell on Shopify and Amazon, keep each channel's demand separate. Stock you send to Fulfillment by Amazon (FBA) is held in Amazon's fulfillment centers, so it needs its own plan. There's one more rule for bundles. A gift set with a candle and a diffuser uses one of each, so its sales count toward both components.
Next is to decide how far ahead to look. Your plan has to reach past your longest lead time. Then add the time until your next order. For seasonal lines, look 12 months ahead so you'll see the peak before you need to buy for it.
Last, set a schedule. Refresh the numbers every week, and recheck lead times and safety stock every quarter, since suppliers' timelines change.
2. Gather the Data Your Forecast Depends On
A forecast is only as good as the history behind it, so pull these together before you start:
- Daily orders for each variant and channel, including refunds and cancellations
- Stock levels by location over time, so you can see which days each variant was out of stock
- Promotion history, with the dates, discount, products, and channel for every sale you've run
- Supplier terms for each product, including lead time, minimum order quantity, and pack size
- Stock already on the way, meaning the open purchase orders and transfers, with their expected arrival dates
- Your catalog structure, including variants, bundle components, launch dates, and discontinued items
- Unit and landed costs (product cost plus freight and duty), so you can see how much cash each order ties up
Aim for at least 12 months of history, because that's one full seasonal cycle. Two years is even better, and NIST's statistics handbook advises two complete seasons when you're setting up a seasonal forecast.
Lead time needs extra care. Measure it from the day you send the purchase order to the day the stock's ready to sell in your warehouse. So, it includes freight, customs, and receiving, on top of production time. If your plan leaves those out, you'll order late every time.
3. Rebuild True Demand From Your Sales History
When a variant sells out, its recorded sales drop to zero, even if customers still want it. Forecast from those numbers and you’ll underestimate demand and reorder too little. So what can you do?
- Correct for Stockouts: If a size M hoodie sold 120 units in 20 days but is out of stock for the remaining 10 days of the month, its daily sales rate is 6 units. Estimated monthly demand is 180 units, meaning a forecast based on recorded sales alone leaves you 60 units short. For slow sellers, work out the rate over a longer window, so one busy day doesn't skew it.
- Adjust for Promotions: A 25%-off weekend might triple daily sales. Tag those days and leave them out of your baseline. You can keep the data to plan future promotions. Do the same with one-off spikes, like a wholesale order or the rush after an influencer post.
Manually checking daily stock and sales for every variant takes hours as your SKU count grows. Forstock automates this for Shopify brands.
Forstock’s AI forecast identifies stockout days, estimates lost sales, and analyzes discount history to separate promotional spikes from normal demand. It then forecasts demand, flags stock risks, recommends what and when to reorder. It also generates purchase orders across suppliers, stores, warehouses, and sales channels.
4. Choose a Forecasting Method for Each Type of Product
Every forecasting method looks at your cleaned-up history and carries the pattern forward week by week. The methods differ in how much history they need and which patterns they can pick up.
| Method | How It Works | Best For | Watch out For |
|---|---|---|---|
| Moving average | Averages daily sales over the last few weeks | Steady sellers without a strong season | Trails behind growth and misses seasonal peaks |
| Same period last year | Takes last year's sales for the same weeks and adjusts for growth | Seasonal lines with clean history | Repeats last year's stockouts and promos unless you clean them out |
| Exponential smoothing | Weights recent weeks more heavily, and the Holt-Winters version adds trend and seasonality | Established products with a year or more of history | Needs clean history, or it learns the wrong pattern |
| Lookalike forecasting | Borrows the sales curve of one or more similar products | New launches with no history | Only as good as the products you compare against |
| Machine learning | Learns from many inputs at once, like stockouts, promotions, and seasonality | Larger catalogs with mixed patterns | Needs plenty of history, and should show how it reached each number |
You'll probably need more than one of these for your catalog. A moving average works for steady basics, a seasonal method for swimwear or coats, and a lookalike forecast for anything new. For products that only sell a few units a month, a simple average over a longer window is enough.
Spend your review time where the revenue is. An ABC analysis ranks your products by revenue. Your A items (the small group that brings in the bulk of sales) deserve a close look every week.
When a single variant doesn't sell enough to show a pattern, forecast the whole product and split it by size. If size M has made up 30% of hoodie sales, it gets 30% of the hoodie forecast. This top-down approach works well in fashion, where sizes and colors split demand into small numbers.
5. Add the Demand Your History Can't See
Your sales history only shows what's already happened. Before finalizing your plan, account for upcoming events that could change demand.
- Planned Promotions: Use the sales lift recorded in step 3 to estimate demand. If last spring's 25%-off weekend tripled sales, use that as a starting point for this year's sale. For Black Friday and Cyber Monday, check that your order date leaves time for stock to arrive before the sale starts.
- New Product Launches: Borrow the first few months of sales from one or more comparable products, and adjust as your own sales come in.
You’ll also want to account for wholesale orders, influencer collaboration, price changes, or a product you're retiring. When you change a number by hand, write down why. In a study of more than 60,000 supply chain forecasts, large adjustments tended to improve accuracy. But small tweaks often made it worse. So, save overrides, like a confirmed retailer order, for new information and leave hunches alone.
6. Turn the Forecast into Order Dates and Quantities
A forecast becomes useful when it tells you when to reorder and how much. Your reorder point is the stock level that covers the demand during supplier lead time, plus safety stock for unexpected demand for delays.
Set safety stock on days of demand or use the textbook formula that accounts for demand variability and your target service level.
We’ll use our hoodie selling 6 units daily, with a 45-day lead time and 14 days of safety stock. The reorder point is 354 units: (6 × 45) + 84. With 450 units on hand, you have about 16 days before reaching it. To cover 60 days, order 360 units, rounded up to 400 if your supplier ships in packs of 50.
But, if the hoodie's forecast rises to 9 units daily, your reorder point jumps to 531 units. With 450 on hand, you should've ordered already. Repeat this for each SKU at each location. And count open purchase orders and transfers as stock on the day they're due to arrive.
Forstock’s smart reordering simulates inventory daily to calculate stockout dates and order-by dates. It accounts for incoming stock, supplier minimums, and pack sizes, then drafts purchase orders by supplier. Plans refresh weekly, and you can review the inputs behind each recommendation.
Finally, compare the actual sales with forecasts weekly and investigate persistent gaps (for example, longer lead times or unrecorded promotions).
Build Your First Plan Around Your A Items
Inventory demand planning pays off fastest on your A items, so start there. Rebuild their true demand, check their lead times, and work out the next order date for each one. Once that routine feels steady, bring in the rest of the catalog.
If you'd rather skip the spreadsheet stage, start a 14-day free trial of Forstock. You don't need a credit card, and your first plan's ready the same day. Prefer a walkthrough? Book a demo, and we'll connect your store on the call and go through your first plan together.
Frequently Asked Questions
1. How Do You Forecast Demand for a New Product With No Sales History?
Forecast a new product from several comparable products on the same channel and at a similar price. One lookalike alone can mislead you. Let's say a new colorway joins a hoodie line where the closest matches sold 400 units in their first eight weeks. Plan the launch near that pace and buy a cautious first batch. Then re-forecast once you've seen two or three weeks of sales.
2. What Is a Good Forecast Accuracy for an Ecommerce Brand?
A good forecast beats a simple benchmark and doesn't lean consistently high or low. That's harder than it sounds. In the M5 forecasting competition, fewer than half of 5,507 teams beat a naive forecast that just repeated the latest sales. So, compare your forecast against last year's sales for the same weeks, and track its error and bias every month.
3. How Do I Forecast Demand for Products That Sell Inconsistently?
Products with irregular sales are difficult to forecast because a few large orders or occasional sales can distort averages. Instead of applying the same forecasting method to every SKU, group products by sales patterns. Use historical trends for consistent sellers, comparable products for new launches, and longer observation periods for slow movers. Review forecasts against actual sales regularly and adjust your approach as demand patterns change.
4. Can You Do Inventory Demand Planning in Excel?
A spreadsheet works just fine while your catalog's small. Moving averages, reorder points, and order dates are all standard formulas. It gets harder once you've got hundreds of variants, several locations, and stockout days to correct. Then, every weekly refresh means new exports and manual checks. And if you relied on Shopify's Stocky app for forecasts and order suggestions, that option ended after August 31, 2026.