
The 80/20 Rule of Inventory
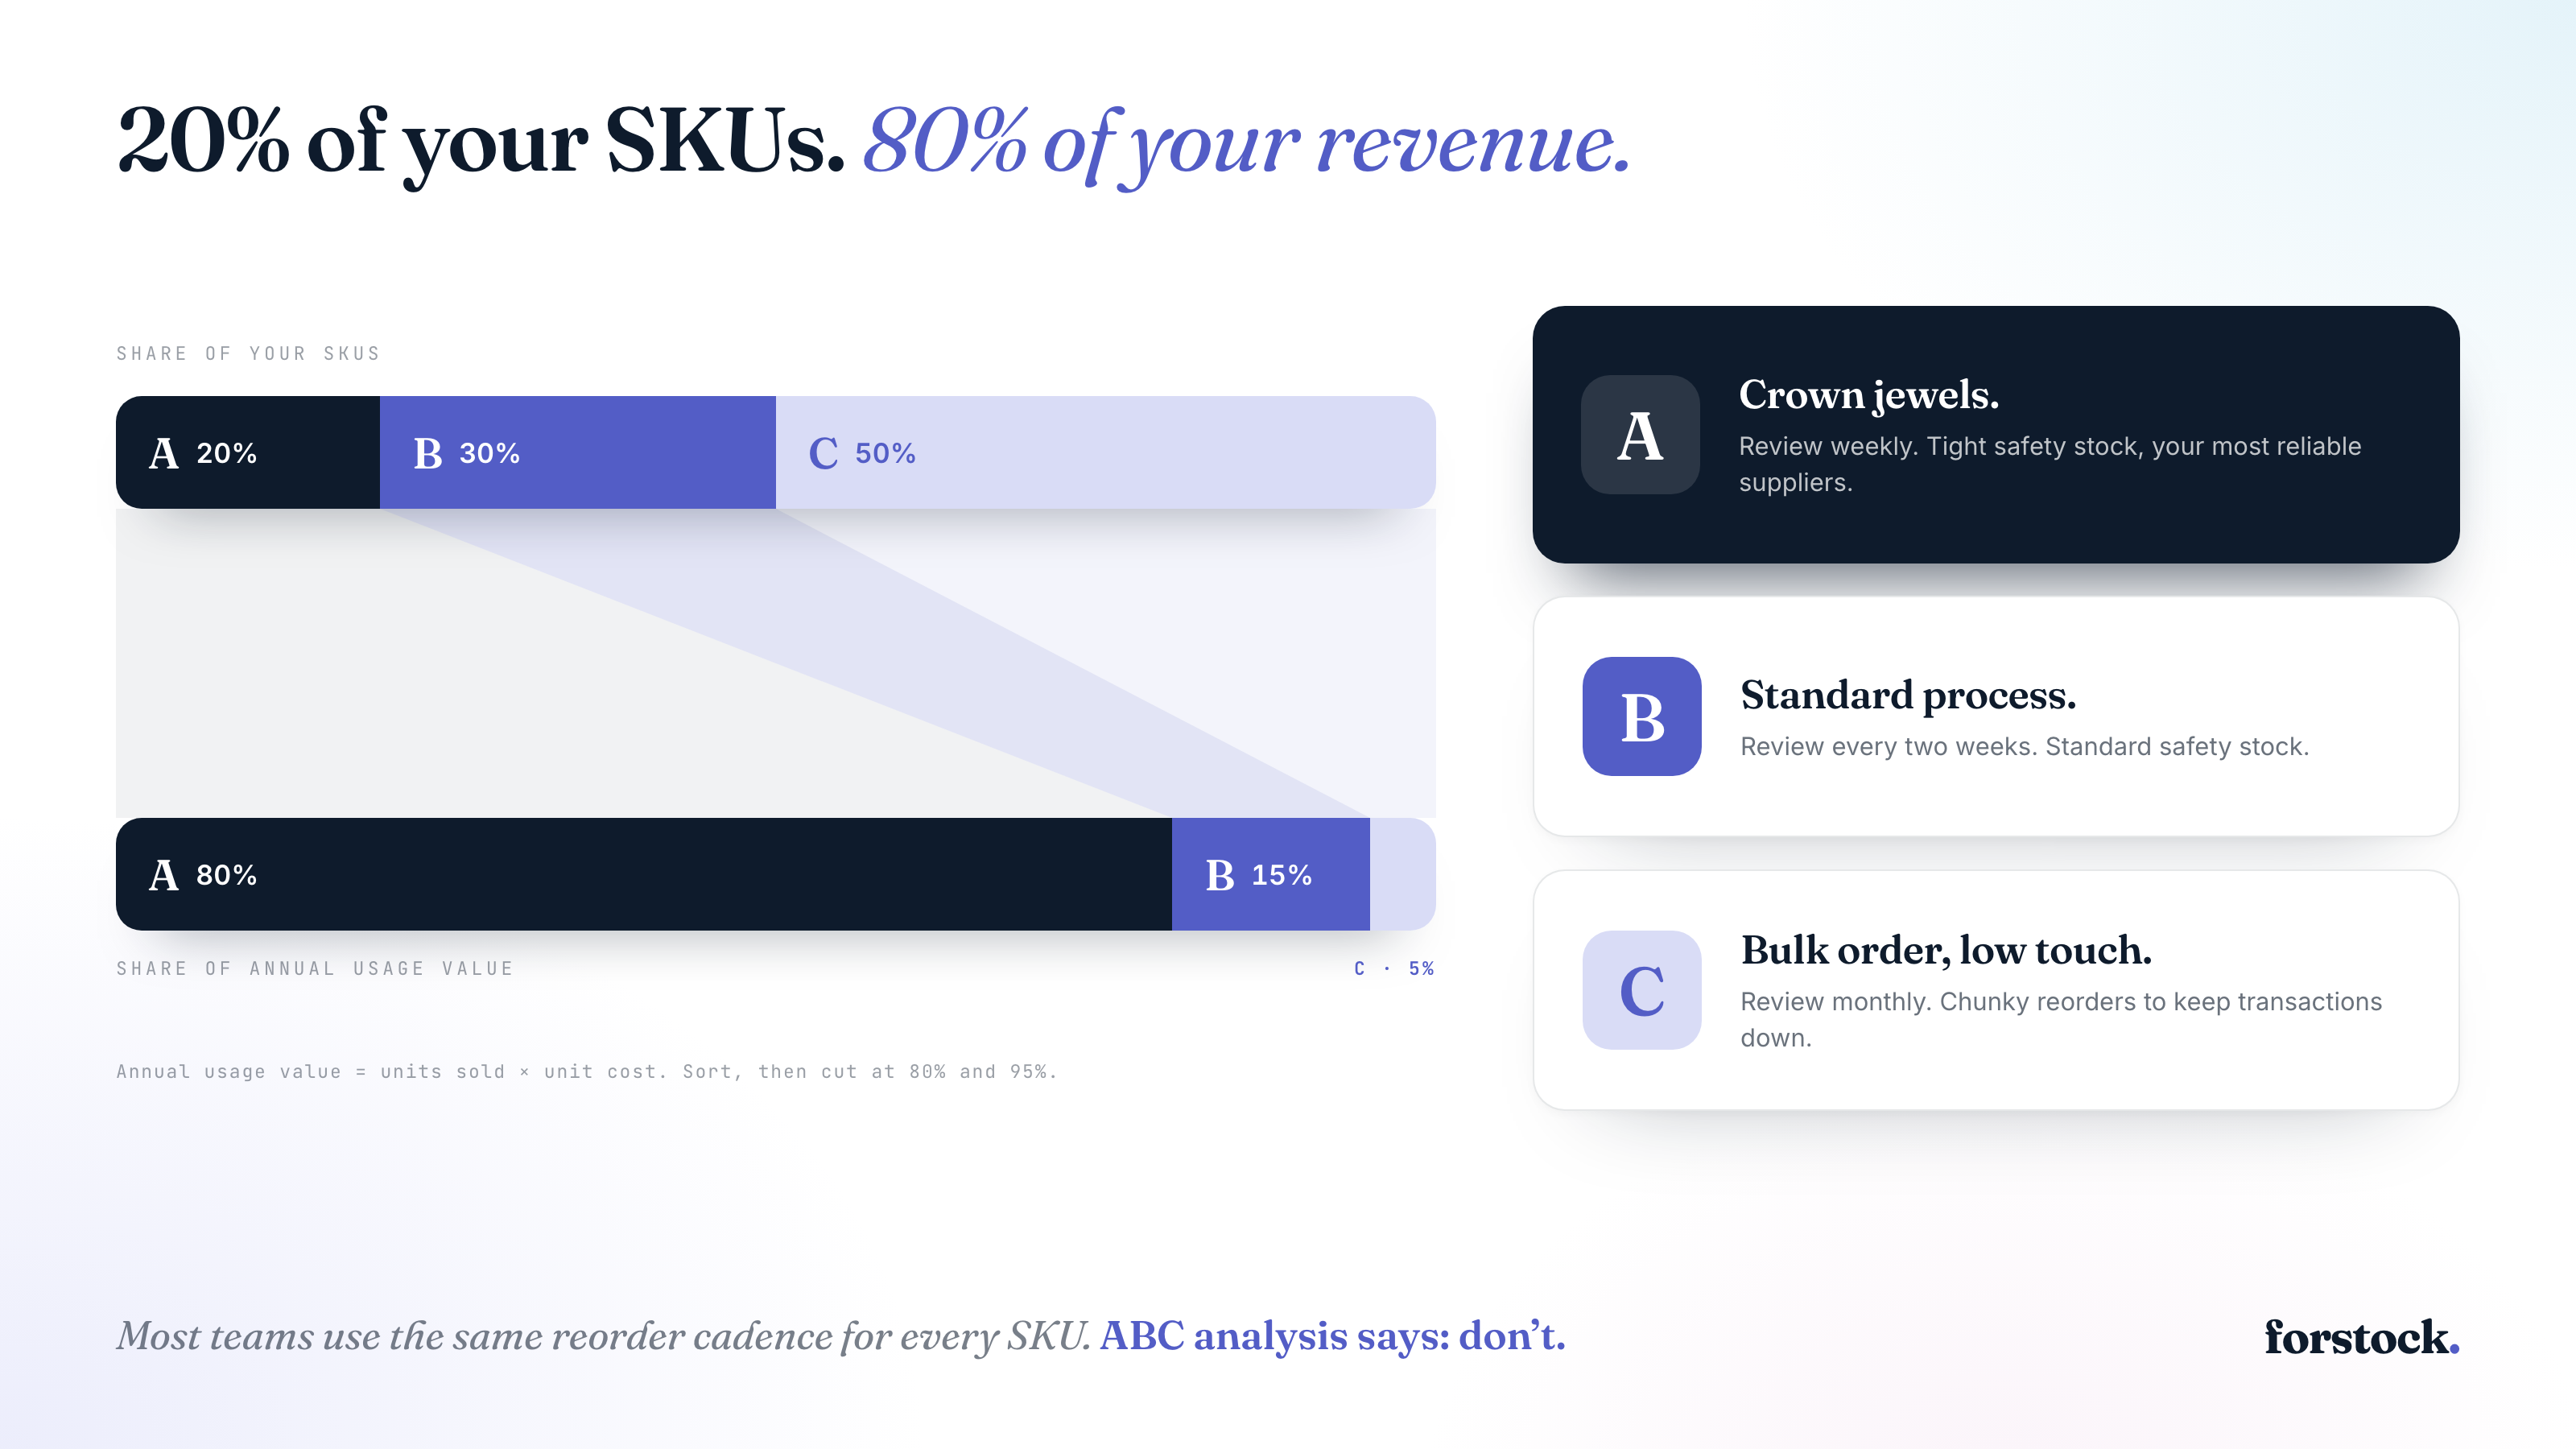
Roughly 80% of your revenue comes from 20% of your SKUs. That's Pareto's law, and it's the foundation of ABC analysis — the simplest, highest-leverage exercise in inventory management.
If you do nothing else this quarter, do this.
What ABC Analysis Is
You sort every SKU by annual usage value (units sold × unit cost) and split them into three classes:
- A items — top 20% of SKUs that drive ~80% of value. Treat them like crown jewels.
- B items — next 30% of SKUs that drive ~15% of value. Standard process.
- C items — bottom 50% of SKUs that drive ~5% of value. Bulk-order, low touch.
Why This Matters
Most teams use the same reorder cadence for every SKU. ABC analysis says: don't.
- A items need weekly review, tight safety stock, and the most reliable suppliers
- B items need bi-weekly review and standard safety stock
- C items need monthly review and chunky reorders to minimize transaction cost
This single change cuts purchasing time by half and keeps the items that matter most in stock.
How to Run It Yourself
- Export the last 12 months of unit sales per SKU from Shopify
- Multiply each SKU's units by its cost to get annual usage value
- Sort descending
- Calculate cumulative % of total value
- Cut at 80% and 95% — the breaks define your A/B/C
You can do this in a spreadsheet in 30 minutes, or in two clicks with Forstock.
What to Do After
Once you have your classes:
- Audit your A items — are any sitting under safety stock right now?
- Audit your C items — are any sitting on dead inventory that could be liquidated?
- Move every A item to a tighter reorder cadence
The first time most brands run ABC analysis, they're surprised which SKUs landed where. That alone is worth the exercise.