

Lead time variability can disrupt your inventory management if not properly accounted for. Here's why it matters and how to tackle it:
- Lead Time: The time from placing an order to having inventory ready for sale. Misjudging it can cause stockouts or overstocking.
- Variability: Lead times often fluctuate due to delays like shipping, customs, or seasonal demand.
- Reorder Point (ROP): Standard ROP formulas fail when lead times are inconsistent. Adjusting for variability is key to avoiding stockouts or tying up cash in excess inventory.
- Solution: Measure lead time variability, refine safety stock calculations, and use dynamic ROP formulas that adapt to changes in demand and supply.
For better results, automate calculations and track supplier performance regularly. Tools like Forstock integrate with platforms like Shopify to simplify this process. Don't rely on outdated methods - keep your inventory strategy aligned with current conditions.
Limitations of Basic Reorder Point Formulas
The Standard Reorder Point Formula
The reorder point (ROP) formula is:
ROP = (Average Daily Demand × Lead Time) + Safety Stock
This formula is most effective when demand is steady, suppliers are reliable, and seasonal changes are minimal. However, it assumes a fixed lead time, which doesn’t account for natural variations in delivery times.
Why Ignoring Lead Time Variability Creates Risk
One major issue with the standard formula is its reliance on a supplier's quoted lead time, assuming it remains consistent. In reality, lead times often fluctuate. For example, a supplier’s delivery window might extend from the expected 21 days to 29 days. When this happens during peak demand, the formula’s rigidity can leave you short on stock. This shortfall can trigger missed sales opportunities and force markdowns to clear excess inventory, cutting profit margins by as much as 25–40%.
"The reorder point was operationally invalid because it failed to buffer against documented lead time instability." - Closo
These challenges highlight the importance of factoring in lead time variability to avoid costly mistakes.
How Manual Workflows Make Reorder Calculations Worse
The limitations of the formula are compounded by manual vs. automated inventory tracking. Many merchants rely on spreadsheets to log supplier lead times and track order dates, especially when tools like Shopify aren’t used for this purpose. This manual approach quickly becomes outdated and often leads to inefficient blanket rules, such as adding two weeks of buffer stock across all products. While this might seem like a safe bet, it can result in overstocking items that sell slowly and understocking popular ones.
For stores with over 50 SKUs, manually maintaining reorder points can take up 10–15 hours each week. Even with this effort, manual forecasting typically achieves only about 70% accuracy, compared to the 85–92% accuracy possible with automated tools. This gap in precision directly impacts inventory management, leading to stockouts, overstock issues, and cash flow strain. It’s a clear case for adopting automated systems that account for variable lead times and improve efficiency.
PART 1 of 2: Calculating Lead Times that We Need for the Safety Stock / Reorder Point Template
Adjusting Reorder Point Calculations for Lead Time Variability
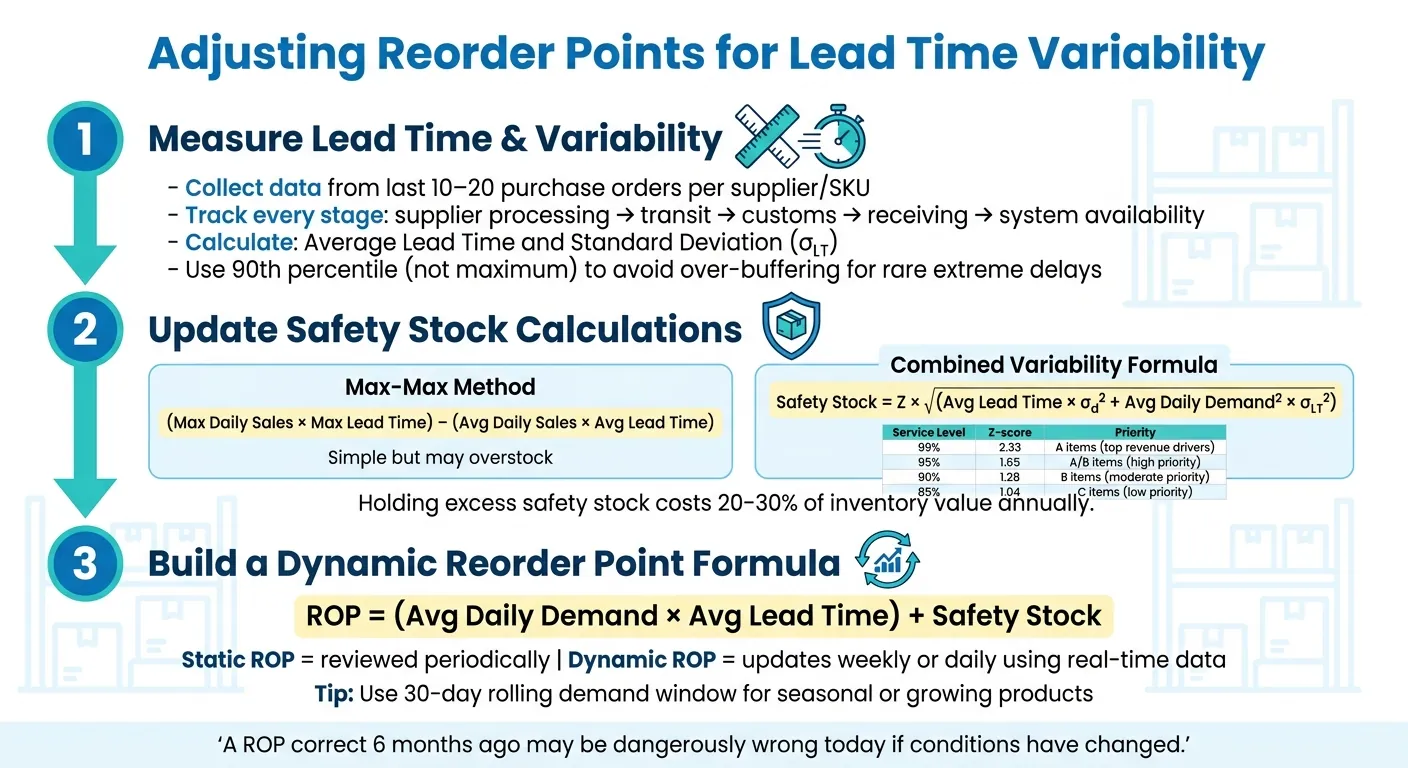
How to Adjust Reorder Points for Lead Time Variability
To tackle the challenges posed by fluctuating lead times, it's crucial to refine your reorder point (ROP) calculations. Here's how you can adjust for these real-world variables.
Step 1: Measure Lead Time and Its Variability
Start by gathering detailed lead time data that includes every step - supplier processing, transit, customs, receiving, and system availability. This gives you a full picture of how long it actually takes to replenish stock.
Analyze the last 10–20 purchase orders for each supplier or SKU, noting the number of days from when the order was placed to when stock became sellable. From this data, calculate both the average lead time and its standard deviation (σLT). The standard deviation reveals how much the lead times deviate from the average, a factor often ignored in basic ROP formulas.
Instead of relying on the maximum lead time, use the 90th percentile to avoid overcompensating for rare, extreme delays - like weather-related disruptions - that could unnecessarily inflate your buffer stock.
With these metrics in hand, you can adjust your safety stock to better handle lead time variability.
Step 2: Update Your Safety Stock Calculations
Now that you have lead time variability data, apply it to refine your safety stock calculations. You can choose between two approaches:
- Max-Max Method: This calculates safety stock as (Max Daily Sales × Max Lead Time) − (Avg Daily Sales × Avg Lead Time). While simple, it often results in excessive buffer stock, tying up capital unnecessarily.
-
Combined Variability Formula: This method accounts for fluctuations in both demand and lead time:
Safety Stock = Z × √(Avg Lead Time × σ_d² + Avg Daily Demand² × σ_LT²)
Here:
- σ_d = Standard deviation of daily demand
- σ_LT = Standard deviation of lead time
- Z = Service level factor, chosen based on your desired stockout avoidance rate (e.g., Z = 1.65 for 95% service level, Z = 2.33 for 99%).
Since holding excess safety stock can be expensive - costing 20–30% of the inventory's value annually - a tiered service level approach helps balance costs and priorities:
| Target Service Level | Z-Score | Recommended For |
|---|---|---|
| 99% | 2.33 | A items (top revenue drivers) |
| 95% | 1.65 | A/B items (high priority) |
| 90% | 1.28 | B items (moderate priority) |
| 85% | 1.04 | C items (low priority) |
This ensures that your most critical products are well-buffered, while lower-priority items don’t unnecessarily tie up resources.
Step 3: Build a Dynamic Reorder Point Formula
With updated safety stock, you can now create a dynamic ROP formula:
ROP = (Avg Daily Demand × Avg Lead Time) + Safety Stock
This formula adapts to changes in demand and lead time. As supplychainmath.com notes, "A ROP that was correct six months ago may be dangerously wrong today if conditions have changed".
Unlike static ROPs, which are reviewed periodically, dynamic ROPs update continuously - weekly or even daily - using real-time data. For products experiencing growth or seasonality, a 30-day rolling demand window offers a more accurate reflection of current trends than a 90-day average. This keeps your inventory strategy aligned with the latest business conditions, avoiding outdated assumptions that could lead to stockouts or overstocking.
sbb-itb-f0fc809
Implementing Lead Time-Aware Reorder Points in Shopify

Capturing and Managing Lead Time Data
Shopify doesn’t come with built-in tools to track supplier lead times, so merchants need to create their own dataset. To do this, record the date each purchase order is placed and the date the inventory is available for sale. The difference between these two dates gives you your actual lead time - not the estimate your supplier provides, but what truly happens. This step is critical because accurate calculations depend on historical data rather than optimistic quotes.
Lead times can also vary significantly depending on location. For example, transferring stock from a regional warehouse to a store will likely take less time than shipping from an international supplier. By tracking these timelines separately, you can ensure your reorder points match the specific replenishment needs of each fulfillment location. This level of detail allows Shopify tools to support more precise reorder planning.
Using Shopify Inventory Features for Reorder Planning
Shopify’s built-in inventory tools are a good starting point for managing reorder planning. For instance, Shopify Flow can send low-stock alerts when inventory dips below a set threshold, helping your operations team act before stockouts occur. Additionally, multi-location tracking lets you monitor inventory levels independently across warehouses and stores, which is essential when lead times differ by location.
When setting reorder triggers, focus on available stock rather than just on-hand stock. Available stock considers units already allocated to orders, whereas on-hand stock doesn’t. A helpful formula for this is: Available + On PO − Committed − Backordered. This ensures you’re working with accurate figures.
That said, Shopify’s native tools are mostly reactive - they notify you after thresholds are hit but don’t proactively adjust reorder points. For merchants looking for a more forward-thinking approach, advanced tools can complement Shopify’s features.
How Forstock Automates Lead Time-Aware Inventory Management

Forstock takes inventory management to the next level by integrating dynamic reorder logic directly with Shopify. It calculates reorder points using the formula: average daily demand × supplier lead time + safety stock. The safety stock calculation is particularly robust, factoring in demand and lead time variability based on your chosen service level (e.g., 90%, 95%, or 99%).
One standout feature is supplier reliability grading. Forstock automatically grades vendors (A through D) based on their historical performance in on-time deliveries and order completion. For suppliers with lower grades, you can add a fixed buffer to increase safety stock, protecting against delays.
The platform also tracks purchase orders through various stages - Draft, Ordered, Received - and flags overdue shipments with a "PO Late" badge if they miss their expected arrival date. This real-time tracking ensures that units from open purchase orders are included in stock calculations, preventing over-ordering.
"Lead time has the biggest influence on [the reorder point], so make sure it’s set correctly in Settings." - Forthcast Documentation
Forstock allows merchants to set default lead times across the store and customize them for individual suppliers or SKUs. For businesses that operate on fixed replenishment schedules, like quarterly container shipments, Forstock sizes orders to cover the entire cycle while accounting for lead time buffers. This ensures nothing is overlooked during the planning process.
Keeping Reorder Points Accurate Over Time
How Often to Review and Update Reorder Points
Reorder points aren't something you set and forget. Changes in demand, shipping timelines, or the addition of new fulfillment centers can make old reorder points obsolete.
To stay ahead, it's a good idea to revisit reorder points and safety stock levels every quarter - or sooner if there's a sudden spike in sales, supplier updates their processes, or you open a new fulfillment location. For example, preparing for peak shopping seasons like Black Friday/Cyber Monday means adjusting reorder points at least two weeks in advance. Doubling these thresholds early gives your supply chain the breathing room it needs to handle the rush. Tools like Forstock can make this process easier by automatically recalculating reorder points with every data sync from Shopify, so you don’t have to wait for manual reviews.
"Setting it once and forgetting it [is a common mistake]. Demand changes. Lead times change. Suppliers improve or get worse. Recalculate safety stock at least quarterly, or use a tool that updates it dynamically." - Stockful Blog
Keeping reorder points accurate also means staying on top of supplier performance, which we’ll dive into next.
Tracking Supplier Performance Over Time
Supplier promises don’t always match reality. If a vendor claims a 10-day delivery time but consistently takes 14 days, that four-day gap can throw off your reorder calculations - especially during busy periods.
To get a clear picture, track four key dates for every order: when it’s placed, when it ships, when it arrives, and when the stock is ready for sale. The time from order to shelf reveals the true lead time. By monitoring this over 6–12 months, you can also spot patterns and adjust your safety stock buffer accordingly. Forstock simplifies this process by grading suppliers based on historical delivery performance, helping you quickly identify which vendors need larger buffers in your calculations.
Balancing Inventory Goals with Business Priorities
Once you’ve nailed down your review schedule and supplier tracking, the next step is to align your inventory strategy with your business goals. Not all products need the same level of precision. A tiered approach can help you prioritize effectively:
| Product Tier | Revenue Contribution | Recommended Service Level | Review Frequency |
|---|---|---|---|
| A Items | Top 80% of revenue | 95%–99% | Monthly or real-time |
| B Items | Mid-tier revenue | 90%–95% | Quarterly |
| C Items | Bottom revenue / long tail | 85%–90% | Bi-annually or as needed |
For high-impact A items that drive most of your revenue, it’s worth investing in precise calculations and tighter safety buffers. On the other hand, for slower-moving C items, a simpler formula like average daily sales × lead time × 1.25 is often enough.
If budget constraints are an issue, focus on SKUs where stockouts would cause the biggest revenue hit.
FAQs
How do I calculate lead time variability for a SKU?
To figure out lead time variability for a specific SKU, start by collecting the actual lead times from completed purchase orders. Once you have this data, calculate the standard deviation using this formula:
[ \sigma_{LT} = \sqrt{\frac{\sum (LT_i - \overline{LT})^2}{n}} ]
- ( LT_i ): Each individual lead time
- ( \overline{LT} ): The average lead time
- ( n ): The total number of observations
If you want to compare variability across different suppliers, use the coefficient of variation (CV). This is calculated as:
[ CV = \frac{\sigma_{LT}}{\overline{LT}} ]
The CV helps standardize the variability by expressing it relative to the mean lead time, making it easier to evaluate performance across suppliers.
What service level should I use for safety stock?
Balancing stockouts and inventory costs is key to determining the right service level. Many businesses aim for a 95% service level (Z-score around 1.65), which works well in most cases. However, for items with higher profit margins or critical importance, a 99% service level (Z-score around 2.33) might be more appropriate.
While higher service levels help minimize stockouts, they also demand greater investment in safety stock. To find the right balance, factors like demand variability, lead time, and supplier reliability should be carefully evaluated. Statistical tools, such as the formula Z × σ × √Lead Time, can guide decision-making by accounting for these variables.
How often should I update reorder points?
Reorder points need regular updates to keep inventory at the right levels. For most SKUs, aim to review them at least once a month - more frequently for fast-moving items. During peak seasons or when demand spikes, weekly reviews might be necessary. If there’s a sudden shift in sales trends, lead times, or product performance, it’s crucial to recalculate immediately. Tools like Forstock can help automate these updates, providing real-time adjustments for greater accuracy.