
Quick Summary
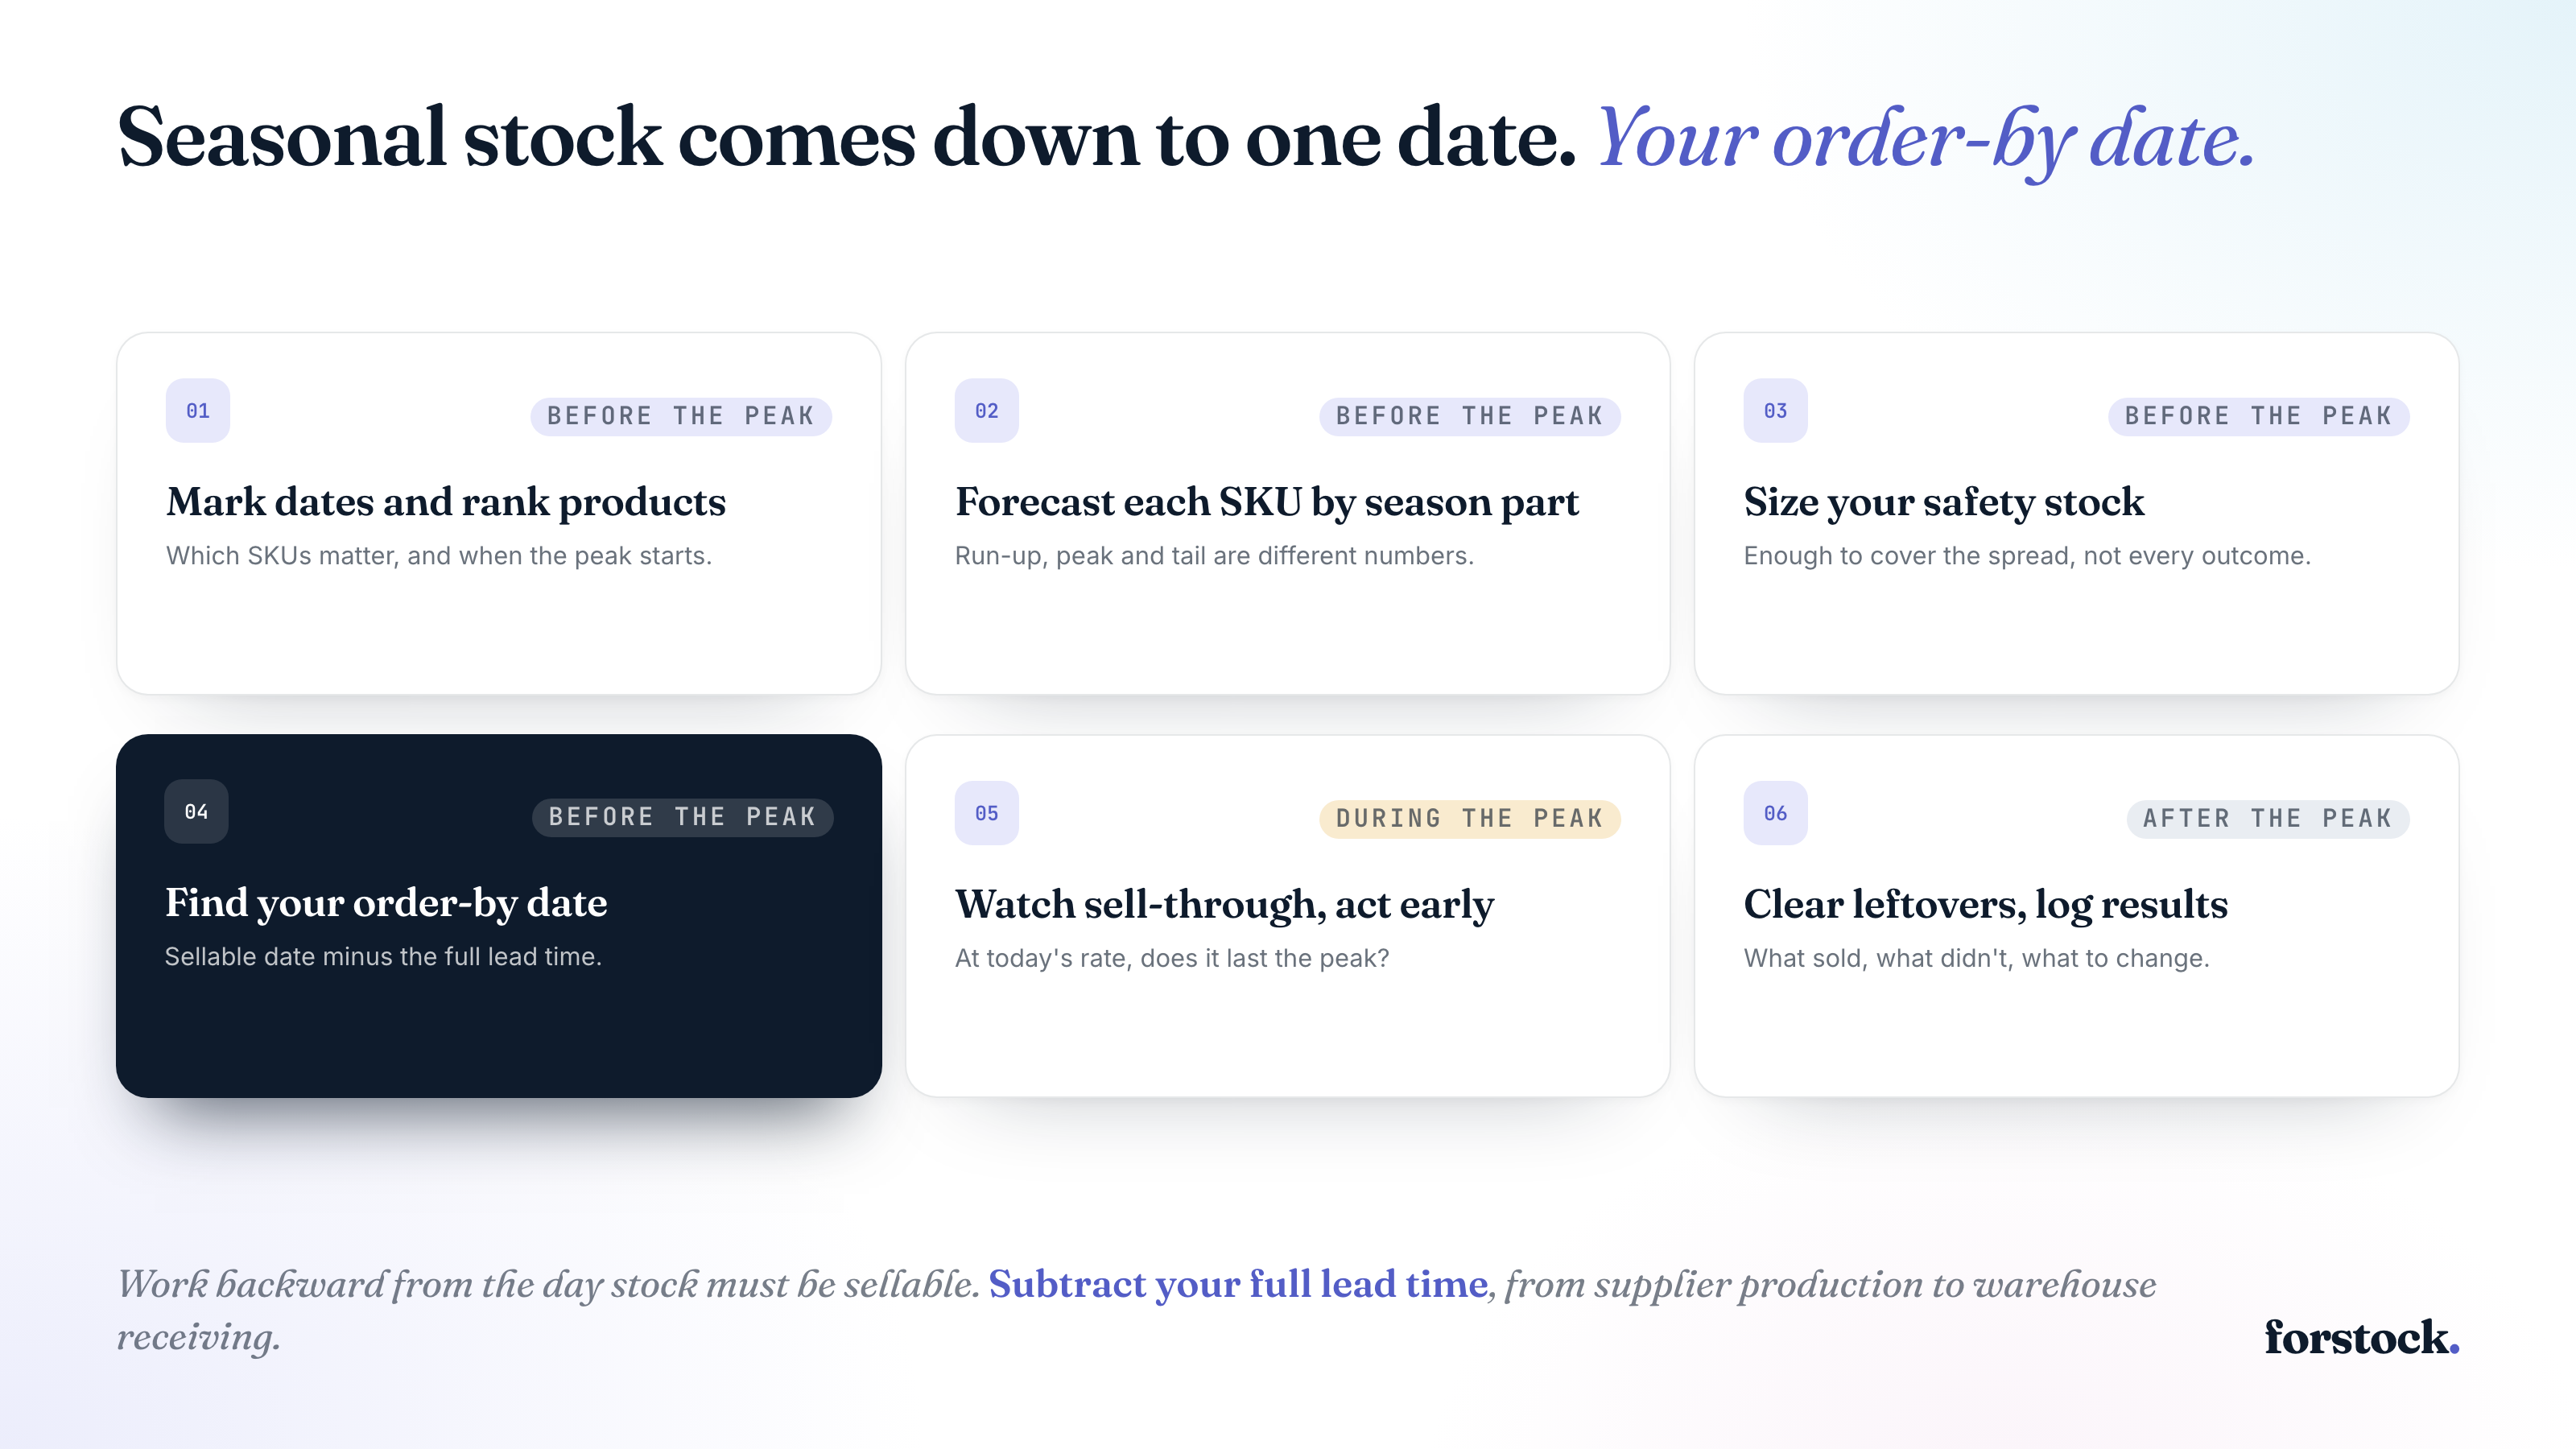
Seasonal inventory management comes down to one date, your order-by date. For seasonal inventory planning, work backward from the day stock must be sellable. Subtract your full lead time, from supplier production to warehouse receiving. Before the peak, size each order to your forecast, plus enough safety stock to cover a miss. During the peak, check sell-through daily and adjust promotions or reorders. Afterward, discount seasonal leftovers while demand lasts.
What Is Seasonal Inventory Management?
Seasonal inventory management covers your stock decisions for a predictable yearly peak. That runs from the first order to the final markdown. Winter coats and holiday gift sets are typical seasonal inventory. Seasonal inventory planning is the work before the peak, when you decide how much to order and when.
Ordering for a peak is harder than everyday reordering. With a normal product, you fix a late supplier or a bad guess on the next order. With a seasonal product, lead time often exceeds the time left once the peak starts. So your main order is hard to correct.
A wrong order costs money in both directions. Over-order and you’re left with overstock that ties up cash until you discount it. Run out on Black Friday and you lose sales on some of the year’s busiest days. During the 2024 Cyber 5, 14.8% of surveyed online shoppers abandoned a site over an out-of-stock product, per Digital Commerce 360 and Bizrate Insights.
Common Seasonal Inventory Patterns
Four patterns shape seasonal inventory. Three come from demand and one comes from your supply chain. Plenty of stores deal with more than one.
- Holidays and shopping events: Black Friday and Christmas produce short spikes, especially in gifting categories.
- Weather seasons: swimwear and winter coats sell for months, then drop sharply when the season turns, and the timing flips in Australia.
- Life and calendar events: back-to-school and wedding season lift the same categories every year, though school calendars differ by country.
- Supply-side seasons: your suppliers and carriers run on seasons of their own, which set when you can buy and what shipping costs.
The supply-side pattern doesn’t show up in your sales data, so it’s easy to miss. Chinese New Year falls between about January 21 and February 20. In 2027, it falls on February 6.
Factories in China tend to slow down from mid-January. They shut for about two weeks around the holiday, then take until March to recover fully. That stretches your lead time and moves your order-by date earlier.
Carriers also raise prices at peak. UPS’s 2026 holiday surcharges start as early as September 27 and run through January 16, 2027. The highest charges apply between November 22 and December 26.
Each peak also has a shape, and the shape sets your plan. Black Friday through Cyber Monday is a four-day spike that usually leaves no time to reorder, so size your safety stock carefully on the first order.
Swimwear sells for months, which leaves room for a mid-season reorder if your lead time is short enough. Christmas gifting ends at your last shipping cutoff in mid-December, so mark down leftover gift stock before then.
How to Manage Seasonal Inventory Before, During and After a Peak
This guide follows one example product, a three-candle gift set from a supplier in China. Production takes 35 days. The set then ships by ocean to a U.S. West Coast warehouse, about 35 days door to door. In a normal October it sells about 4 units a day, and Black Friday through Cyber Monday is its biggest stretch. These numbers are illustrative, so swap in your own.
1. Before the Peak, Mark Dates and Rank Products
Start with the day your stock must be sellable. This guide calls it your sellable-by date. You count back from it to find when to order. Then mark the other dates that decide how early you have to start. The dates below use Black Friday 2026 as the example, so check your own 3PL and supplier dates each year.
- Sellable-by date: the day stock must be received and pickable. Set it about 11 days before your first sale, because 3PLs often stop taking inbound stock 7 to 10 days before a peak. This example’s first sale is November 12, 15 days before Black Friday on November 27, so the date is November 1.
- Warehouse door date: stock must arrive about five days earlier, to leave time for receiving. Here, that’s October 27. Ask your 3PL for its last receiving day, and use whichever date is earlier.
- Supplier closures: get your supplier’s closure dates in writing and check them against your production run. This example’s run ends September 22, so China’s Golden Week (October 1 to 7) doesn’t touch it, but a later order would.
Next, pick the products to plan first. Export last year’s Black Friday through Cyber Monday sales per SKU from Shopify, then rank them and start with your top 20. If cash is tight, rank by gross margin per dollar of stock instead. For a product with no history, borrow the pattern of your closest existing product.
If Black Friday is your main peak, Forstock’s Black Friday inventory checklist has the full countdown and a planner you can download.
2. Before the Peak, Forecast Each SKU by Season Part
You want a forecast per SKU, split into the parts of the season that behave differently. A single number for “Q4” hides that four days in late November outsell the 15 days before them.
Forstock covers how to build the numbers in a guide to demand planning and a guide to seasonal demand forecasting, so here you only need the result. Last year the candle gift set sold out on the Sunday after Black Friday, so last year’s sales understate demand. Correct for that sell-out, lift the result for growth, and you’d get a forecast like the one below. Treat it as a base case that supports your judgment.
| Part of the season | Dates | Days | Units per day | Units |
|---|---|---|---|---|
| Early deals | Nov 12 to Nov 26 | 15 | 12 | 180 |
| Black Friday through Cyber Monday | Nov 27 to Nov 30 | 4 | 90 | 360 |
| Gift season | Dec 1 to Dec 18 | 18 | 20 | 360 |
| After the last ship date | Dec 19 to Dec 31 | 13 | 5 | 65 |
| Total | 50 | 965 |
Gift season ends on your last ship date, the last day you can ship an order and still have it arrive before Christmas. USPS recommends sending Priority Mail by December 18, and Ground Advantage by December 17, in the contiguous U.S. for delivery before December 25. Those dates change each year. This example uses December 18.
Build a forecast for each channel too if you sell in more than one place.
3. Before the Peak, Size Your Safety Stock
Safety stock is the extra stock you hold in case demand or lead time runs higher than planned. For an everyday product, a common formula sizes it from the highest and average values of both.
Safety stock = (max daily sales × max lead time) − (average daily sales × average lead time)
That formula assumes you can reorder when stock runs low. During a seasonal peak you usually can’t, because a fresh order from an overseas supplier wouldn’t arrive until January. So the buffer covers the chance that your forecast is too low.
The simplest way to size it is to check how far off you were before. If last year’s forecast for the candle gift set was 15% too low, hold 15% of this year’s forecast as safety stock. That’s 145 extra units (965 × 0.15, rounded up). Treat one year’s miss as a starting point, and use more years if you have them.
Then scale the buffer to what a leftover would cost you. Items that sell all year can carry a full buffer, because leftovers keep selling after the peak. Holiday-only items need a smaller one, because leftovers turn into markdowns. The candle gift set has no holiday branding and can go back on the shelf, so the full buffer fits. Forstock’s guide to lead time variability covers this formula and a statistical alternative in more detail.
4. Before the Peak, Find Your Order-By Date
Your order-by date is the last day you can place your order and still have stock sellable by your sellable-by date. Count backward from that date through each stage, from receiving back to the PO. Here, stock must be sellable by November 1.
| Stage | Days | Start by |
|---|---|---|
| Buffer before first sale | 11 | Nov 1 |
| 3PL receiving and putaway | 5 | Oct 27 (door date) |
| Customs and trucking from the port | 7 | Oct 20 |
| Ocean freight | 28 | Sep 22 |
| Production | 35 | Aug 18 |
| PO approval and deposit | 3 | Aug 15 |
| Total | 89 | Order by Aug 15 |
That’s 78 days of lead time plus the 11-day buffer.
The quantity comes from steps 2 and 3. This order has to carry you from November 12 to your next delivery in January. So it covers the full 965-unit forecast plus the 145-unit safety stock, which is 1,110. If you’d have 40 sets left on November 12 without this order, and nothing else is on order, that leaves 1,070 to buy. Your supplier packs 12 sets per case, so you’d round up to 90 cases, or 1,080 units. Check your supplier’s minimum order quantity too.
Use lead times you’ve measured yourself, from the day you sent the PO to the day the stock was sellable. A supplier’s quoted lead time typically covers production only and leaves out shipping and customs, according to Alibaba’s seller guide. If your lead times vary, pull your last 10 to 20 POs and use the 90th percentile.
If that date has already passed, the same math still works for a December top-up and for next year’s order. A top-up has to arrive before your last ship date. Air freight usually takes 7 to 10 days door to door, and a domestic supplier takes 2 to 7 days. Air often stops making sense for heavy products like candles, though.
Calculating an order-by date by hand for one SKU takes a few minutes. Doing it for 300 variants across two warehouses takes much longer, and that’s the job Forstock was built for. Its reorder list simulates each SKU at each location day by day to find the day the shelf goes empty. It then works back through your lead time to the day you have to act.
Sent purchase orders count as incoming stock, so you won’t order the same units twice. When you add a promotion, Forstock lifts the forecast by what your past promos did to each SKU. You review each recommendation before it becomes a purchase order.
5. During the Peak, Watch Sell-Through and Act Early
Once the peak starts, compare each SKU’s sales against its forecast every day, and every few hours from Black Friday through Cyber Monday. Sell-through is the share of your available stock that’s sold so far. A day or two of it shows which way the peak is heading.
Run one test on each top SKU. At today’s pace, will it last through the peak with enough left for the rest of the season? Say early deals sold as forecast, so you enter Black Friday with 940 sets. The candle gift set sells 140 on Black Friday against a forecast of 90, so 15% of your stock sells in one day. The table below shows what happens if all four days run at Friday’s pace.
| At forecast | At Friday’s pace | |
|---|---|---|
| Sold, Black Friday through Cyber Monday | 360 | 560 |
| Left on December 1 | 580 | 380 |
| Forecast for December | 425 | 425 |
| Gap | 155 over | 45 short |
At Friday’s pace, you’d use your whole buffer and end up 45 units short of December’s forecast. That shortfall falls after the last ship date, when demand is low, so the gift season is still covered. Keep the offer running, and get a quote for a top-up in case December runs hot too.
A bigger gap needs a faster response. Your options:
- Pull the discount or ad spend off the set so you stop paying to sell out faster.
- Push a similar product that’s selling slower than planned into the same emails and ad slots.
- Move stock between locations only if your warehouse still accepts transfers. Many stop once outbound orders peak, so next season finish planned moves before your first sale.
- Switch to preorders only if a purchase order is confirmed inbound, and show the real ship date. Otherwise, turn on back-in-stock signup.
It works the other way too. If a product is well behind forecast by Saturday, put it in front of more shoppers while traffic is still high. Forstock’s Black Friday guide has a table of if-then rules for the weekend.
6. After the Peak, Clear Leftovers and Log Results
Start on December 1. Work out the days of cover for every seasonal SKU at its normal, non-sale rate. Then compare them with the days left before your last ship date.
Say the spike hit forecast. On December 1, the candle gift set has about 580 units and sells 20 a day, which is 29 days of cover. Only 18 days remain before the last ship date. After that date, you’d sell about 65 of the roughly 220 units still on the shelf, leaving about 155 to clear or hold.
Then decide what to do with the leftovers, product by product. A gift set with no date on it can go back on the shelf for Valentine’s Day. Holiday-themed packaging can’t wait that long, so bundle it or mark it down before the last ship date. Start with a small markdown and deepen it if sales stall. Forstock’s discounting guide covers bundles, flash sales and themed sales.
In early January, count what’s left of every seasonal SKU. Returns peak in the first half of January, so add resellable returns to your count. Then compare the total with the safety stock you planned to hold. A count near your buffer means the forecast was about right. A count well over means you over-forecast. A count under it, or a sell-out, means you under-forecast.
Before you close the season, write down four records for each SKU:
- What it sold, including units cleared at a markdown, and any days it was out of stock.
- How far your forecast missed. If you under-forecast, that percentage guides next year’s safety stock. If you over-forecast, lower next year’s forecast.
- How long each stage of the lead time took, from PO to sellable.
- How your 3PL’s actual dispatch time compared with what it promised.
Spring orders have their own deadline. Many Chinese factories stop accepting new orders 6 to 8 weeks before Chinese New Year, which falls on February 6 in 2027. That works out to a cutoff between December 12 and December 26. Send a provisional PO in mid-November, as Forstock’s Black Friday guide suggests, and adjust it on December 1.
Put Your Next Order-By Date in the Calendar Now
Before a peak, seasonal inventory management comes down to three numbers per SKU. You need a forecast and a buffer sized to how far off you were last time. Then you need an order-by date, counted back from your sellable-by date. Set them early, and you spend the peak checking sales against a plan.
You don’t have to rebuild that math in a spreadsheet every season. Forstock recommends the order-by date and quantity for each SKU at each location. You review each recommendation before it becomes a purchase order.
Start a 14-day free trial with no credit card up front. Or book a demo and Forstock’s team will walk you through your Black Friday plan.