Top 5 Causes of Overstock in Shopify Stores
Identify five common reasons Shopify stores overstock—forecast errors, bad inventory data, fear buying, supplier rules, and weak SKU analysis.

Top 5 Causes of Overstock in Shopify Stores
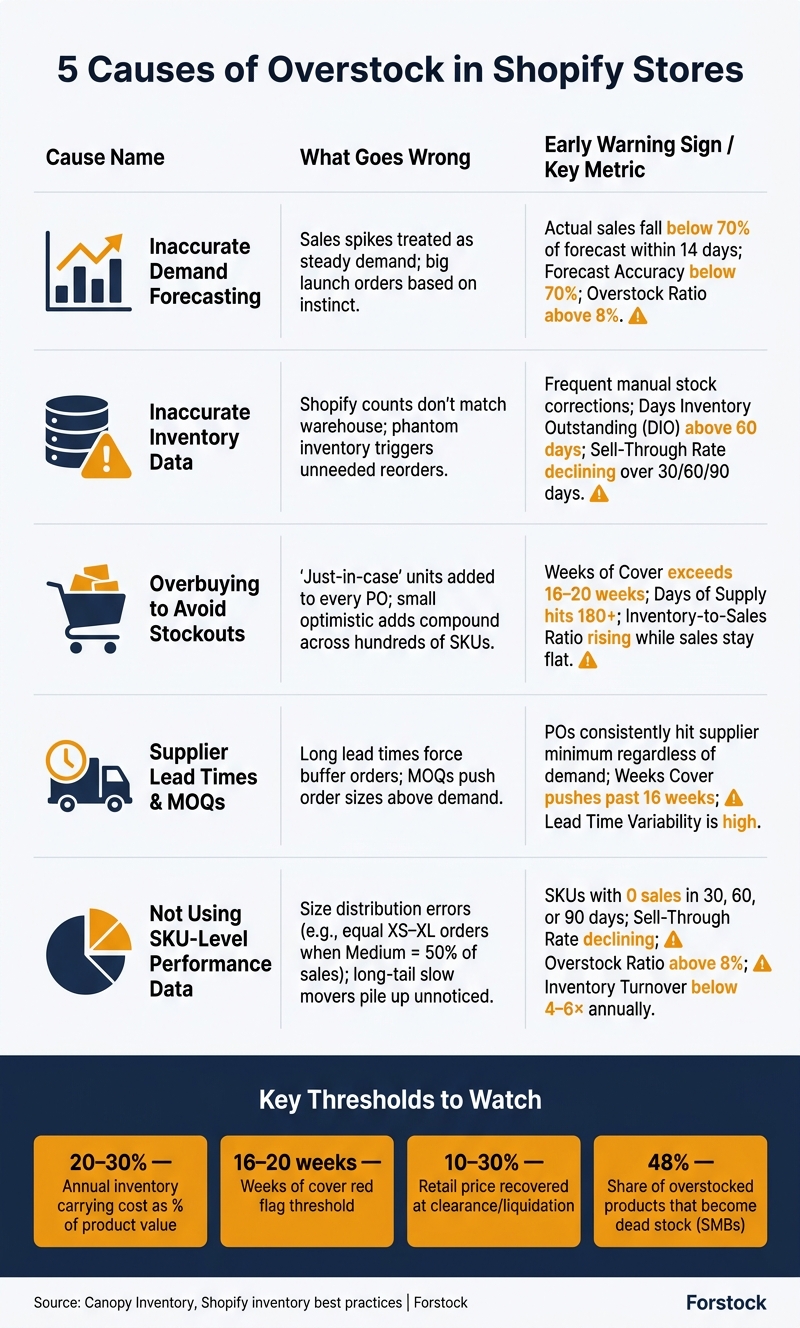
Overstock usually starts with five problems: bad forecasts, bad stock data, fear-based buying, supplier rules, and weak SKU-level analysis. If you carry more than 16–20 weeks of supply, your cash starts getting stuck, storage costs climb, and markdown risk grows fast.
Here’s the short version:
- Bad forecasting leads to orders based on spikes, not normal demand
- Bad inventory data leads to reorders you didn’t need
- Overbuying after stockouts pushes weeks of cover too high
- Long lead times and MOQs force order sizes above demand
- Weak product data use leaves slow variants piling up
A few numbers matter most:
- Inventory carrying costs often run 20%–30% a year
- Overstock often starts when a SKU goes past 16–20 weeks of cover
- Clearance stock may return only 10%–30% of retail price
- SKUs with 0 sales in 30, 60, or 90 days need a hard review
If I had to sum it up in one line: overstock is usually a buying problem before it becomes a warehouse problem.
Quick comparison
| Cause | What goes wrong | Early sign |
|---|---|---|
| Forecasting errors | Sales spikes get treated like steady demand | Actual sales miss forecast early |
| Inventory data issues | System counts don’t match physical stock | Manual stock fixes keep happening |
| Overbuying to avoid stockouts | “Just in case” units get added to POs | Weeks of cover keeps climbing |
| Supplier lead times and MOQs | Vendor terms force larger buys | POs hit MOQ even with weak demand |
| Poor SKU-level analysis | Slow variants pile up | Reorders ignore sell-through |
Below, I’ll break down each cause in plain English and point out the numbers I’d watch first.
5 Causes of Overstock in Shopify Stores: Signals & Key Metrics
Why Overstock Costs Shopify Brands So Much

Overstock is a cash drain, not just a storage problem. For Shopify brands, it usually hits in four direct ways.
Excess Inventory Locks Up Cash
Every unit sitting in a warehouse is money you can't use somewhere else. Inventory carrying costs usually run 20% to 30% of a product's value per year. That includes storage, insurance, taxes, and handling.
So if a brand is sitting on $100,000 in extra stock, it may burn $20,000 to $30,000 per year on that inventory alone. And that's money that isn't going toward faster-selling products.
That gap hurts. Cash tied up in slow-moving SKUs can't fund marketing, hiring, new product launches, or reorders for items that are already selling well. Many brands end up stuck in a painful cycle: too much stock on weak sellers, not enough on best sellers.
Those losses often show up first in day-to-day warehouse costs.
Storage, Fulfillment, and Handling Costs Rise
Extra inventory takes up bin space, pallet positions, and warehouse square footage you're already paying for. It also adds labor. Teams have to move it, count it, and work around it during daily operations.
Markdowns and Dead Stock Cut Into Margins
At first, the damage may look small. A SKU starts aging, so the brand runs a 10% to 20% discount to help it move. But if that product keeps sitting, the next step is usually clearance or liquidation. At that point, brands often recover only 10% to 30% of the retail price.
And some products never recover at all. Dead stock - inventory with little to no real chance of selling - makes up about 48% of all overstocked products for small and mid-sized businesses.
There’s also a longer-term hit here. If shoppers keep seeing clearance sales, they start waiting for the next discount instead of buying at full price. Over time, that weakens your pricing power.
Bad Inventory Decisions Snowball
Excess stock also throws off inventory data, and bad data leads to bad reorder decisions. That's when a stock problem turns into a planning problem.
Key Metrics to Track Before Diagnosing the Causes
Before you dig into the causes, track the metrics that flag overstock early.
| Metric | What It Measures |
|---|---|
| Inventory Turnover | How many times you sell and replace stock in a period (COGS ÷ Average Inventory) |
| Days of Inventory on Hand | How many days your current stock will last at the current sales rate |
| Sell-Through Rate | Percentage of received units sold within a set timeframe |
| Weeks Cover | How many weeks of supply you're holding; anything over 16–20 weeks is a red flag |
| GMROI | Gross margin dollars earned for every dollar invested in inventory |
Track these metrics before diagnosing the five causes.
Once these costs are clear, the next step is finding what caused the buildup.
sbb-itb-f0fc809
1. Inaccurate Demand Forecasting
Demand forecasting shapes every purchase order you make. When the forecast is wrong, the damage spreads fast. You buy too much, products sit in the warehouse, and cash gets stuck on the shelf.
How It Creates Excess Inventory
Bad forecasts often turn short-term demand jumps, new launches, and stockout panic into extra inventory.
One mistake shows up all the time: using past sales like they point in a straight line to future demand. If your store had a viral TikTok moment or ran a flash sale that pushed sales way up for a short stretch, that bump can slip into your baseline. Then the next forecast treats that surge like normal demand, and you end up ordering too much.
The same thing happens with new product launches. Many merchants place big opening orders based on instinct instead of testing with smaller batches first. If the product doesn't sell as expected, that first wave of inventory can turn into dead stock fast.
Stockout fear adds fuel to the fire. After a popular SKU sells out, many merchants swing too far the other way and overbuy “just in case.” That kind of reaction often creates overstock.
On Shopify, this usually doesn't start with one bad order. It tends to show up first as stock imbalances and rising safety stock.
Shopify-Specific Warning Signs
The clearest sign is a stock imbalance. You're heavy on slow-moving items while your best sellers are still running thin. Another red flag is safety stock that keeps creeping up, not because demand is rising, but because your team no longer trusts the forecast. Purchase orders driven by supplier minimums instead of actual demand are another sign the forecasting process is breaking down.
Key Reports and Metrics to Monitor
Use these metrics to catch the issue before excess inventory starts piling up.
| Metric | Formula / Target | What It Flags |
|---|---|---|
| Forecast Accuracy Rate | % of SKUs where actual sales fall within ±15% of projection | Target: 78%–85%; below 70% means poor data inputs |
| Overstock Ratio | Units on hand beyond 90 days of demand ÷ Total units | Target: below 8% |
| Lead Time Demand | Avg lead time (days) × Avg daily sales | Minimum stock needed before the next delivery arrives |
2. Inaccurate Inventory Data and Stock Visibility
Bad inventory data doesn’t make as much noise as a bad forecast. But it can do just as much damage.
When your stock records are off, every purchasing decision built on top of those records is off too. The main issue is stock mismatch: Shopify and your warehouse aren’t showing the same numbers in real time. That gap can hide extra stock in one location and stockouts in another. You’ll usually feel it fastest in multi-location stores, where sales, transfers, and returns don’t update at the same time.
Spreadsheets make the problem worse. By the time a sheet is updated and shared, the numbers are often already out of date. That’s how phantom inventory shows up - stock that looks available in the system but isn’t physically there, or stock that exists but can’t be seen. And that often leads to unneeded reorders.
Shopify-Specific Warning Signs
One of the clearest red flags is manual stock checks. If your team keeps cross-checking inventory against spreadsheets or other systems, your stock data probably can’t be trusted.
Another warning sign is reordering the same SKU while another location is still sitting on extra units. And if you’re making frequent inventory adjustments just to correct stock errors, phantom inventory is already shaping your day-to-day work.
Key Reports and Metrics to Monitor
| Metric | Formula / Definition | Overstock Warning Level |
|---|---|---|
| Days Inventory Outstanding (DIO) | Average days to turn inventory into a sale | > 60 days (growth stage) |
| Sell-Through Rate | (Quantity sold ÷ Original quantity available) × 100 | Declining trend over 30/60/90 days |
Practical Prevention Tactics
Start by fixing your Shopify inventory management source of truth. If the base data is wrong, alerts and reports won’t help much.
A unified commerce setup like Shopify can sync sales and stock across warehouses, retail locations, and pop-up shops in one back office. Once that’s in place, set automated overstock alerts based on real-time sales velocity instead of manual checks. Then back that up with scheduled cycle counts so your physical stock matches your digital records.
Clean stock data gives your reorders a dependable starting point.
3. Overbuying to Avoid Stockouts
After a stockout, it’s common for merchants to swing the other way and order too much next time. What starts as caution can turn into a pattern, and that’s where extra inventory begins to pile up.
How This Creates Excess Inventory
Overstock usually doesn’t come from one huge blunder. As the Canopy Inventory team puts it, "Overstock is not one mistake - it is the compound effect of many small optimistic orders."
That’s the problem in plain English. Ordering 20% extra to reach a bulk discount. Rounding up because lead times feel shaky. Adding a little more “just in case.” Each call may sound sensible on its own. But across hundreds of SKUs, those small adds stack up fast.
Shopify-Specific Warning Signs
In Shopify stores, fear-driven buying often shows up in purchase orders that keep pushing past 20 weeks of cover without any clear promo, seasonal event, or planned sales spike behind them.
Another common signal is when the team keeps saying some version of, “Last time we ran out.” That usually means the next PO is being shaped more by stress than by demand.
Key Reports and Metrics to Monitor
| Metric | Warning Sign | Healthy Target |
|---|---|---|
| Days of Supply | 180+ days of supply | 30–90 days |
| Inventory-to-Sales Ratio | Rising while sales stay flat | Stable or declining |
Practical Prevention Tactics
The fix is simple in theory: stop guessing, and use a repeatable reorder point formula.
Start with the last 90 days of sales to find your actual daily sales velocity. Then multiply that by lead time, and add the safety stock you actually need instead of a padded number that just feels safer. Before placing a new order, reconcile Shopify inventory counts with warehouse records so you’re not buying against bad data.
If supplier minimums are pushing order sizes too high, push back on that setup. Smaller, more frequent shipments are often a better path than treating the MOQ as untouchable. Forstock can generate reorder suggestions using live sales data and lead times, which helps keep buying tied to what’s moving instead of what the team fears might run out.
When supplier terms lock in the order size, lead times and minimums usually become the next source of overstock.
4. Supplier Lead Times and Order Minimums
Even with solid demand forecasting, supplier rules can quietly swell your inventory far beyond what you need. Long lead times and high minimum order quantities, or MOQs, put brands in a tough spot: buy more than demand calls for, or risk running out.
How This Creates Excess Inventory
Accurate forecasts don't help much when supplier terms force bigger orders than demand supports.
Long or shaky lead times often push merchants to place buffer orders just to feel safe. Then MOQs make that overshoot hard to avoid. The result is simple: brands end up holding more stock than demand can justify.
Bulk discounts can make this worse. On paper, the per-unit price looks better. But the full cost tells a different story. Storage fees, handling, and later markdowns often wipe out those savings.
Shopify-Specific Warning Signs
A few red flags tend to show up fast:
- POs keep landing at the supplier minimum even when demand is lower
- Safety stock keeps creeping up even when demand stays flat
Key Reports and Metrics to Monitor
| Metric | Warning Sign | Target |
|---|---|---|
| Weeks Cover | Pushing past 16 weeks without a planned promo | At or below 16 weeks unless there's a documented promotional reason |
| Sell-Through Rate | Low on items recently replenished due to MOQs | Healthy sell-through after each replenishment |
| Lead Time Variability | High deviation from quoted delivery dates | Stable delivery windows |
| Inventory-to-Sales Ratio | Climbing while sales stay flat | Stable or declining |
Practical Prevention Tactics
Ask for smaller, more frequent shipments instead of one large MOQ-driven order. A committed monthly ordering schedule can give suppliers the volume visibility they want while helping you keep stock lean.
Before taking any bulk discount, run the full total cost of ownership. If storage costs and markdown risk eat up the savings, the deal isn't much of a deal.
Set a hard weeks cover ceiling, such as 16 weeks, and don't place an order that pushes a SKU past that mark unless there's a documented reason.
Forstock can use lead times and sales velocity to suggest reorders based on actual demand.
Once supplier terms are in check, the next step is making sure your sales and product data back up the reorder.
5. Not Using Sales and Product Performance Data
Even if your forecasts are clean and your supplier terms look good, overstock can still pile up when buying decisions skip SKU-level performance.
How This Creates Excess Inventory
A common example is size distribution errors in apparel. A merchant orders the same quantity of XS through XL, but Shopify sales data shows that Medium drives 50% of actual purchases. The result is pretty straightforward: shelves packed with XS and XL, while the sizes shoppers want most sell out sooner than expected.
Another issue is the long-tail problem. Merchants put most of their attention on top-selling SKUs, while low-volume items slowly stack up in the warehouse. On their own, each slow mover may not look like a big deal. Put them together, and they lock up cash.
It also happens when teams treat one-time sales spikes like normal demand. That can make the next PO much too large.
Shopify-Specific Warning Signs
The clearest sign is a gap between sell-through and reorder volume. If POs don't reflect SKU-level sell-through, slow movers get overbought and fast movers get understocked.
Key Reports and Metrics to Monitor
Use these metrics together to catch slow movers before they turn into dead stock.
| Metric | Definition | Target Benchmark |
|---|---|---|
| Sell-Through Rate | (Qty Sold / Original Qty Available) × 100 | Review weekly; declining trends can signal overstock risk. |
| Overstock Ratio | Units on hand beyond 90 days of demand / Total units | Below 8% |
| Inventory Turnover | COGS / Average Inventory Value | 4–6× annually for apparel and home goods |
| Forecast Accuracy | % of SKUs within ±15% of projection | 78–85% |
Practical Prevention Tactics
Once the data tells you what's moving, use it to shape the next PO.
ABC analysis helps here:
- Focus on A SKUs
- Keep B SKUs under review
- Flag C SKUs before they quietly build excess
You should also tag every promotional event, including influencer drops and flash sales, inside your forecasting tool. That way, the model treats those jumps as one-off outliers instead of normal demand. Marcus Teal, COO of Driftwood Outdoor Co. (a $7M Shopify-native camping gear brand), did exactly that. By annotating promotional history and flagging a six-week stockout from the previous summer, the brand's overstock recommendation accuracy moved from 61% to 84% in just two planning cycles.
Forstock uses Shopify sales, lead times, and seasonality to keep reorder suggestions tied to current demand instead of one-time spikes.
Early Warning Signs Shopify Merchants Should Watch
Overstock usually shows up in the same places first: SKU velocity, inventory age, and reorder behavior. If you want the fastest read on trouble, start there.
Low-Turn and Aging SKUs
Any SKU sitting above 16–20 weeks of cover should get your attention. Once it hits 52 weeks, you're usually looking at dead stock. Track inventory by age buckets so you can move slow items before they sit too long.
Frequent Manual Stock Corrections
If your team keeps making manual stock corrections, that's a sign your inventory view is off. And when buyers work from numbers that are already stale, they often buy extra just to feel safe. That's how overbuying starts.
Safety Stock Levels That Keep Climbing
If safety stock keeps going up without a matching shift in sales velocity or lead times, something's wrong with the base forecast. A good fix is to recalculate safety stock after stripping out launch spikes and one-off promos.
Purchase Orders Driven by MOQs Instead of Demand
MOQs can cause problems when they force you to buy more than demand can support. Before you send any PO, check whether the incoming units will push that SKU past the 16-week cover mark.
SKUs With No Sales in 30, 60, or 90 Days
A SKU with zero sales is hard to ignore. It usually means purchasing and demand are no longer lined up.
- At 30 days, investigate
- At 60 days, pause replenishment
- At 90 days, look at bundling, transfer, or clearance
Use these thresholds to decide when to pause replenishment or move stock:
| Warning Sign | Red Flag Threshold | Recommended Action |
|---|---|---|
| Weeks Cover | >16–20 weeks | Freeze replenishment; evaluate markdowns |
| Inventory Age | >90 days | Triage for transfer, bundling, or liquidation |
| Sales Velocity | 0 sales in 30/60/90 days | Pause replenishment; investigate SKU performance |
| Inventory Turns | Below target | Review forecast and safety stock |
| Safety Stock | Rising safety stock | Recalculate from lead time data |
Forstock pulls these signals into one dashboard, so teams can step in before inventory gets too old.
Cause-to-Metric Snapshot
Once you’ve looked at the five causes, the next step is simple: tie each one to the KPI that shows trouble first.
| Cause | Shopify Signal | Report or KPI to Check | Earliest Warning Sign |
|---|---|---|---|
| Inaccurate Demand Forecasting | New launches or seasonal SKUs not moving | Forecast vs. Actual Sales; Sell-Through Rate | Actual sales fall below 70% of forecasted units within the first 14 days |
| Inaccurate Inventory Data | Shopify count does not match warehouse stock | Inventory Turnover; Inventory-to-Sales Ratio | Frequent manual inventory adjustments or stock corrections in the Shopify admin |
| Overbuying to Avoid Stockouts | "Just-in-case" stock piling up; climbing safety stock levels | Days on Hand; Weeks Cover | Products sitting at 180+ days of supply or 16+ weeks of cover |
| Supplier Lead Times & MOQs | Bulk receipts arriving before existing stock sells through | Lead Time Variability; Weeks Cover | Purchase orders driven by supplier minimums rather than actual demand |
| Not Using Sales and Product Performance Data | Slow variants piling up while core sizes sell out | Sell-Through Rate; ABC Classification | SKUs with zero sales in the last 30, 60, or 90 days; slow SKUs taking up prime space |
Start with Forecast vs. Actual Sales and Days on Hand. Those two numbers usually show the problem early. If there’s a steady gap between what you expected to sell and what customers bought, overstock is often already starting to pile up.
From there, the warning signs in the table help you spot why it’s happening before the issue gets worse.
How to Prevent Overstock Going Forward
You can prevent overstock by fixing the root issues behind it: clean data, tighter forecasting, supplier-aware buying, and tools that cut down on manual mistakes. Each move below ties back to one of the five causes above.
Start With Clean Inventory Data
Clean inventory data helps you make better reorder calls. If your Shopify stock counts don't match what's sitting in the warehouse, you're making buying decisions from a bad starting point.
Run cycle counts on a set schedule and reconcile the numbers before each reorder. Give A SKUs the closest attention, since even small count errors there can throw off purchasing.
Once your counts are accurate, build forecasts from recent sales instead of old averages that no longer reflect what's happening now.
Forecast Based on Trends and Seasonality
Recent sales data usually gives you a better read on demand. Annual averages can smooth over seasonality and hide what matters, so it's better to forecast from recent SKU-level sales and layer in seasonal patterns, promotions, and holidays.
That gives you a forecast based on what's happening now, not what happened across the whole last year.
Set Safety Stock by SKU Behavior
SKU-level safety stock helps avoid unnecessary padding. Set safety stock using three factors for each SKU:
- demand velocity
- demand volatility
- lead-time risk
Fast, steady SKUs usually need less safety stock. Slow-moving or erratic SKUs should carry very little. And if they start moving past an overstock line like 90 days of supply, flag them for bundling or promotions.
Match Purchasing to Supplier Reality
Purchasing has to work with supplier terms, but supplier terms shouldn't run the whole show. MOQs and lead times are real limits. Still, if an MOQ forces you to buy far more than demand supports, it's time to renegotiate the order size or the order cadence.
A simple fix is to ask for smaller, more frequent shipments in exchange for a committed ordering schedule. It also helps to track lead-time reliability by supplier, so you know which vendors tend to run late and need extra buffer in your reorder timing.
Use Shopify Inventory Tools to Cut Manual Errors
Manual spreadsheets often lead to reorder mistakes. The more SKUs you manage, the easier it is for those mistakes to pile up.
Forstock cuts manual reorder errors for Shopify brands by combining AI-powered demand forecasting, automated purchase order creation, and multi-location inventory visibility in one place. That keeps reorder decisions tied to current demand instead of outdated assumptions.
Conclusion
Overstock almost never comes from one bad call. It tends to build over time through a mix of weak demand forecasts, gaps in inventory data, over-ordering to avoid stockouts, supplier limits, and thin product-level analysis. Then it gets worse when buyers keep reordering based on old assumptions. Put simply, overstock starts when forecasting, data, supplier limits, and product-level decisions stop lining up.
That extra inventory ties up cash, adds storage and carrying costs, and leads to markdowns that slowly eat into margins.
The fix is operational, not structural: track weeks of cover by SKU, flag items that have aged past 60 or 90 days, and review reorder points on a regular basis instead of treating them as fixed.
Clean data, tighter forecasting, and supplier-aware purchasing only work when the team follows through consistently. Fix the inputs, and inventory decisions get better. Learning how to forecast inventory costs is the first step toward better inputs.
FAQs
How do I know if a SKU is overstocked?
A SKU is usually overstocked when you’re holding more inventory than you can sell within a reasonable period.
A simple benchmark: if you have more than 16–20 weeks of cover, the item may be overstocked. And if it reaches 52 weeks of supply, it’s basically dead stock.
One easy way to check is to calculate days of stock remaining. If a product is above your set threshold - often 90 days - it should be flagged for review.
Which inventory metric should I check first?
Start with weeks cover. It shows how many weeks of inventory you have based on your current sell-through rate. A good target is 16 weeks or less to help prevent overstocking.
You should also track sell-through rate on a regular basis so you can catch slow-moving products early, before they start tying up too much cash. Forstock gives you real-time visibility into these metrics and demand forecasts, which helps you make data-driven purchasing decisions and protect cash flow.
What should I do with SKUs that stop selling?
Move fast to recover cash and free up capital instead of letting these items sit as dead stock.
- Start with progressive discounting: begin at 20% off, then increase markdowns if items still don’t move
- Bundle slow-moving products with your best sellers to make the offer more appealing
- List them on other sales channels, or donate them if that makes more sense
- Use Forstock to track sell-through and cut back orders as demand starts to drop
Keep reading
Try Forstock free for 14 days.
AI-powered demand forecasting and reorder automation for Shopify brands. No credit card required.