
Multi-Location Inventory: Planning Reorders Across Warehouses and 3PLs
Reorder by SKU and location: set local reorder points and safety stock, prefer transfers over new POs, split POs by demand, review weekly.

Multi-Location Inventory: Planning Reorders Across Warehouses and 3PLs
If you only look at total stock, you can still run out where it matters. I plan reorders by SKU and location, set reorder points for each site, check transfers before I buy more, and review the whole network every week.
Here’s the short version:
- Track inventory by location, not just in total
- Use available stock first: on-hand minus committed
- Set a separate reorder point for each warehouse or 3PL
- Build safety stock based on demand swings and lead time
- Check if a stock transfer can cover the gap before placing a new PO
- Split new inventory by location demand share, not evenly
- Run a weekly review for top SKUs and low-cover items
- Watch fill rate, stockouts, days of cover, and receipt timing
A simple example: one site may have 10 weeks of supply while another has 1.5 weeks. Total inventory may look fine, but the low-stock site can still miss orders. That’s why I plan inventory as a network, not as separate buildings.
The core rule is simple: move stock inside the network when it’s cheaper and fast enough; place a new PO when network stock can’t cover demand without putting another location at risk.
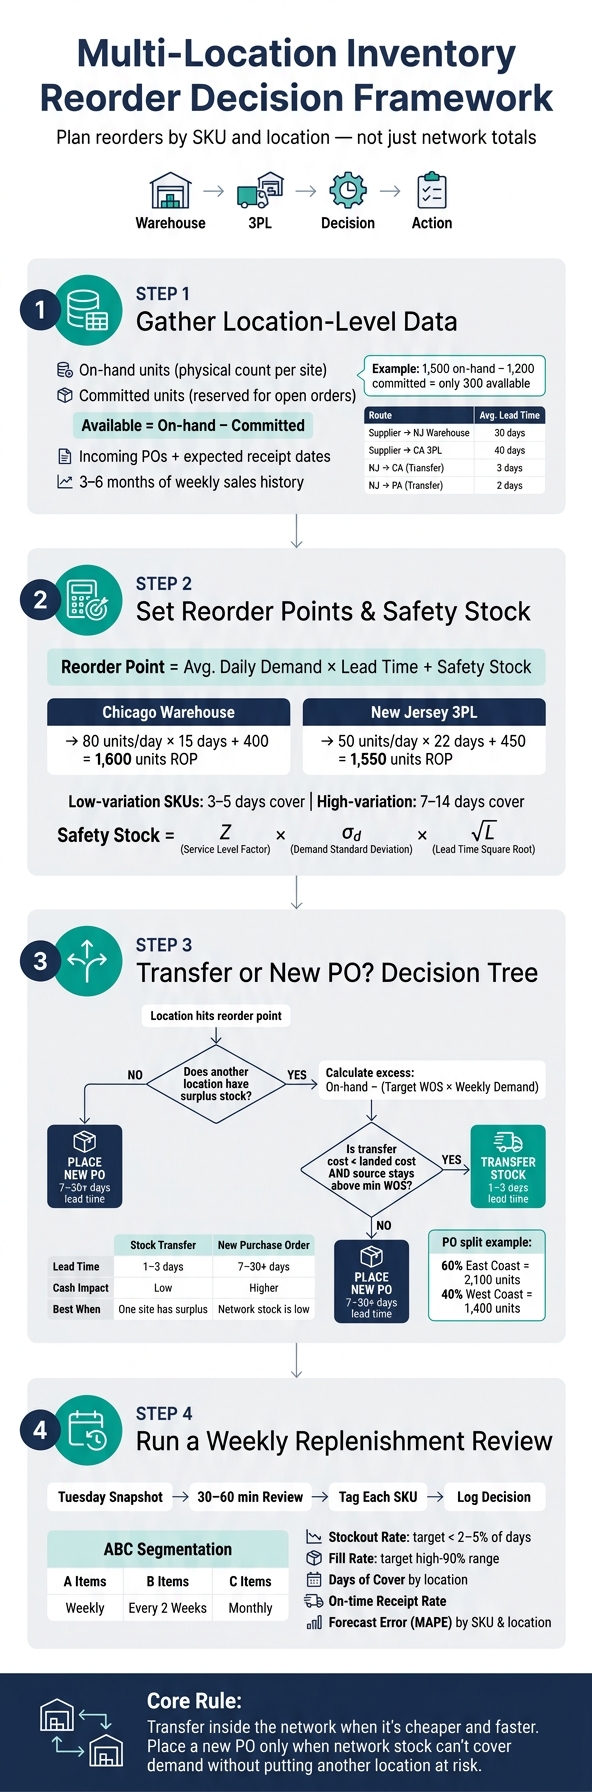
Multi-Location Inventory Reorder Decision Framework
Shopify tutorial: How to manage inventory with multiple warehouses across the globe [with Markets]

sbb-itb-f0fc809
Quick comparison
| Decision | Best when | Lead time | Cash impact | Main risk |
|---|---|---|---|---|
| Transfer stock | One location has extra and another is short | 1–3 days | Lower | Source location gets too lean |
| Place a new PO | Total network stock is too low | 7–30+ days | Higher | Demand runs ahead of lead time |
If you sell through Shopify and use more than one warehouse or 3PL, this article shows how I’d keep reorder decisions simple, location-based, and tied to actual demand. This requires you to track multi-location stock accurately using your store's data.
Step 1: Gather the Data You Need by SKU and Location
Before you reorder, work from SKU-level and location-level data. Network-wide totals can look fine while one site is about to run out. That local view is the starting point. Then Step 2 uses it to set reorder points and safety stock.
Track demand, inventory, and incoming stock by location
For each SKU at each location, track:
- On-hand: the physical units at that site
- Committed: units reserved for open orders that haven’t shipped yet
- Available: on-hand minus committed
- Incoming: purchase orders or transfers on the way, along with expected receipt dates
- Recent sales history: how the SKU has been selling at that location
Of those numbers, available is the one that matters most for reorder math.
Here’s why. Say your East Coast 3PL shows 1,500 units on-hand for a SKU. At first glance, that looks safe. But if 1,200 units are committed to a wholesale PO, you only have 300 units available for new orders.
In Shopify, pull this from Products > Inventory and filter by location. Then match it against 3PL receiving reports, ASNs, and open PO logs so your inbound quantities and receipt dates line up.
For demand history, use at least 3–6 months of weekly sales by SKU and location. Track the SKU, location, week start date, and units sold. That gives you enough to work out average weekly demand and catch changes in the pattern.
Track supplier lead times and internal transfer times separately
Supplier lead time and internal transfer time are not the same thing, so don’t lump them together.
A supplier might take 30 days to replenish your New Jersey warehouse but 40 days to replenish a West Coast 3PL. That gap needs to show up in each location’s reorder point.
Internal transfer time is a different lever. Ground shipping from a New Jersey warehouse to a Pennsylvania 3PL might take 2–3 business days. That’s a much faster move than placing a new supplier PO. Both timing inputs feed the reorder math in the next step.
Build a simple reference table and refresh it every quarter using actual receipt dates, not supplier estimates:
| Route | Type | Avg. Lead Time | Range |
|---|---|---|---|
| Supplier → NJ Warehouse | Purchase Order | 30 days | 28–38 days |
| Supplier → CA 3PL | Purchase Order | 40 days | 38–48 days |
| NJ Warehouse → CA 3PL | Internal Transfer | 3 days | 2–4 days |
| NJ Warehouse → PA 3PL | Internal Transfer | 2 days | 1–3 days |
Set channel and service priorities before you reorder
When stock gets tight, decide your allocation rules before you place the reorder. If you wait until the pressure is on, decisions get messy fast.
Create a channel priority matrix and rank each channel by:
- margin
- stockout penalty
- contractual obligations
A common order is contracted wholesale first, then high-margin DTC, then marketplaces. Also document the target fill rate for each channel.
Say your West Coast 3PL is running low. Now you have a choice: transfer stock from your New Jersey warehouse or hold that inventory for an incoming wholesale order. The priority matrix gives you a rule instead of a guess.
Review that matrix every quarter and anytime your channel mix shifts.
Use these inputs to calculate each location’s reorder point and safety stock.
Step 2: Calculate Reorder Points and Safety Stock for Each Location
Now turn your location-level demand and lead-time data into reorder triggers for each warehouse and 3PL. The point is simple: set a separate reorder point for each SKU at each location, not one blended number for the entire business.
How to calculate a location-level reorder point
The formula is simple:
Reorder Point = Location-Level Average Daily Demand × Lead Time + Safety Stock
Use location-specific inputs only. The same SKU can behave very differently by site. Maybe it sells 80 units per day out of your Chicago warehouse, but only 50 units per day out of your New Jersey 3PL. On top of that, Chicago might get supplier replenishment in 15 days, while New Jersey takes 22 days because transit and receiving take longer.
Put those numbers into the formula and the gap shows up fast:
- Chicago (in-house): 80 × 15 + 400 = 1,600 units
- New Jersey 3PL: 50 × 22 + 450 = 1,550 units
New Jersey ships fewer units per day, but the longer lead time and higher safety stock keep its reorder point close to Chicago’s. If you use one blended reorder point for both locations, one site will keep drifting into understock or overstock.
How to set safety stock for demand swings and lead-time risk
Safety stock is your buffer when demand jumps or a supplier shipment shows up late. How much you need depends on the level of variation at each location.
A good starting point is a days-of-cover rule. Take average daily demand and multiply it by the number of extra days you want to protect. Low-variation SKUs may only need 3–5 days of cover. High-variation or business-critical SKUs may need 7–14 days.
Here’s a simple example: if average daily demand is 40 units and you want 7 days of cover, your safety stock is 280 units.
After you build enough history, you can switch to a tighter formula. If lead times stay fairly steady but demand moves around, use Safety Stock = Z × σd × √L, where:
- Z = service-level factor
- σd = standard deviation of daily demand
- L = lead time in days
Start simple. Then add more precision as your data gets better.
Reorder methods compared: which approach fits your setup
| Method | Best Use Case | Trade-offs |
|---|---|---|
| Reorder point with safety stock | Most multi-location merchants | Practical and easy to explain; safety stock can be tricky to size without enough history |
| Forecast-based coverage planning | Fast-moving, seasonal, or promotional SKUs | Adjusts to changing demand patterns; depends on forecast quality |
Most brands should start with the reorder point with safety stock method. It’s practical, easy to explain to your team, and gives each location a clear trigger. Then move to forecast-based planning for SKUs with heavy seasonality or promo-driven spikes - like Black Friday–Cyber Monday - when simple averages stop matching expected demand.
Either way, the goal is location-level control, not network-wide averages.
Once each location has its reorder point, Step 3 shows when to transfer stock and when to place a new PO.
Step 3: Choose Between a Stock Transfer and a New Purchase Order
When a location hits its reorder point, check your network before you place a new PO. If one site has extra stock, move that inventory first. The key metric here is coverage by location. It tells you whether you should rebalance stock inside the network or buy more from the supplier.
When to use a transfer instead of placing a new order
First, calculate weeks of supply (WOS) for the SKU at each location. Take on-hand units and divide by average weekly demand at that site. Say your East Coast 3PL has 10 weeks of supply, while your California warehouse is down to 1.5 weeks and has already crossed its reorder point. In that case, the 3PL is carrying too much stock, so a transfer is the better move.
Next, figure out how many units you can move without putting the source at risk. Calculate excess inventory at the source by subtracting target inventory from current on-hand. Use this formula:
Target inventory = target WOS × average weekly demand
Here’s what that looks like in practice: if the East Coast 3PL has 5,000 units, sells 250 units per week, and your target is 4 weeks of supply, then target inventory is 1,000 units. That leaves 4,000 units in excess. So 4,000 units is your transfer ceiling. Still, don’t drain the source too far. Leave enough stock to cover demand until the next review cycle.
A transfer usually makes sense when the total transfer cost per unit is lower than the supplier’s landed cost. Time matters too. Internal transfers can show up in 1–3 days, while supplier POs often take 7–30+ days. If the source location still stays above its minimum WOS after the move, transfer the stock.
How to size a purchase order when network stock falls short
If no location has enough extra inventory to share, place a new PO. Use this formula:
PO quantity = forecast demand over the coverage window + safety stock − usable inventory, then round to MOQ or case pack.
For example, if the SKU sells 500 units per week across the network and your coverage target is 8 weeks, forecasted demand is 4,000 units. If you have 1,000 units of usable inventory made up of 600 on-hand + 400 inbound, and you want a 500-unit safety stock buffer, the base PO quantity is 3,500 units. Then round that number to the nearest case pack or MOQ.
After you set the total PO quantity, split it by each location’s share of demand, not evenly. If your East Coast 3PL handles 60% of shipments and your West Coast warehouse handles 40%, send 2,100 units East and 1,400 units West. If one node already has more coverage than the other, lean more inventory toward the understocked location. In many cases, it’s simpler to receive the PO at one main location and then transfer units to the other sites.
Log the decision in your weekly reorder queue.
Transfer vs. purchase order: a side-by-side comparison
| Decision Type | Typical Lead Time | Cash Impact | Freight Cost | Stockout Risk | When to Use It |
|---|---|---|---|---|---|
| Stock transfer | 1–3 days | Low - no new inventory added to the network | Often lower than buying new, but depends on internal freight and handling | Can raise risk at the source if excess is misjudged | One location has surplus; another is below its reorder point |
| New purchase order | 7–30+ days | Higher - adds new units and cash commitment | Includes vendor freight, receiving, and possible expedite fees | Lower source risk, but stockout risk remains if lead time is too long | Network-wide stock is low; no transferable surplus exists |
Step 4: Build a Weekly Replenishment Workflow and Track Results
Run a weekly reorder review by priority SKU and location
Once you choose transfer or PO, put the review on a fixed weekly schedule. The goal is simple: replace last-minute order handling with a process your team can repeat every week. That rhythm helps each warehouse and 3PL stay stocked for its own demand, not some blended network average.
Choose a weekly cutoff - say, Tuesday morning - and use that snapshot for the review. In most cases, 30 to 60 minutes with operations, fulfillment, and finance or purchasing is enough to make the call. Start with priority SKUs first: your highest-revenue items and anything with fewer than 21 days of cover. Then mark each SKU-location pair as transfer, PO, or hold. Before the meeting ends, record each decision in one system so nothing slips through the cracks.
Use ABC segmentation to keep the review focused on the SKUs and locations most likely to cause stockouts. Review:
- A items weekly
- B items every two weeks
- C items monthly
That keeps attention where it matters most without turning the process into a slog.
Use inventory turnover metrics and other performance data to refine your reorder rules
After each review, look at the results and tune the rules for the next cycle. This is how you tell whether your location-level reorder points and transfer rules are doing the job.
Track:
- stockout rate
- fill rate
- days of cover by location
- on-time receipt rate
- forecast error (MAPE) by SKU and location
Watch for stockouts on fewer than 2% to 5% of days and fill rates in the high-90% range.
Each week, review a short exception report: SKUs that stocked out or swung into excess over the past seven days. Save the deeper work - forecast accuracy and lead-time variation - for a monthly review, when you have enough data to support a rule change. If one location keeps missing because transfers show up late, increase the transfer lead time, add more safety stock, and test the updated rule the next week. That loop - observe, adjust, validate - is what makes a reorder rule fit the network instead of sitting there like a stale spreadsheet.
Conclusion: Plan inventory across locations, not in isolation
Keep the loop simple: clean data, location-level reorder points, transfers before new POs, and a weekly review to keep the rules up to date. That rhythm turns reorder planning into a controlled process instead of a reactive scramble. Plan inventory as a network, not as isolated locations.
FAQs
How often should I update reorder points by location?
Review and update reorder points at least once every quarter so they stay in line with changes in sales and supplier performance.
You may need to update them more often during monthly operations reviews, or anytime demand shifts in a big way, a new product launches, or seasonality starts to kick in. Regular monitoring helps you respond to sales spikes and lead-time changes across warehouses and 3PLs.
What if demand shifts quickly between warehouses or 3PLs?
Move away from reactive management and toward proactive, data-led redistribution. A centralized inventory dashboard lets you watch real-time sales velocity and stock levels across every location in one place.
If one site gets a spike in demand while another is sitting on extra stock, shift inventory with automated transfer tools instead of rushing to place new purchase orders. Review safety stock buffers every 90 days, or sooner if demand patterns change.
When is a transfer too risky versus a new PO?
A transfer becomes too risky when shipping, labor, and handling cost more than simply placing a new purchase order. It can also backfire if the origin warehouse can’t spare the inventory without eating into safety stock.
A new purchase order is often the safer move when demand at the source is likely to climb soon. The same goes when transfer transit time is long or shipping costs are high.
Keep reading
Try Forstock free for 14 days.
AI-powered demand forecasting and reorder automation for Shopify brands. No credit card required.