
Inventory Planning for Pet Brands: Multi-Location Growth Without Stockouts
Weekly SKU-by-location forecasts, safety stock, reorder points, and transfers to prevent multi-location stockouts.

Inventory Planning for Pet Brands: Multi-Location Growth Without Stockouts
If you sell pet products from more than one location, stockouts usually come from bad location-level planning, not low total inventory.
I’d boil this article down to four weekly decisions:
- What to stock
- Where to place it
- When to reorder
- When to transfer
The big idea is simple: I should plan inventory by SKU, channel, and location instead of using one blended company forecast. Then I can set reorder points, safety stock, and days of cover for each site, check inbound POs and transfers, and move stock before I place a rush order.
A few numbers from the article make the point clear:
- A warehouse with 40 units/day demand, 10-day lead time, and 280 units of safety stock has a 680-unit reorder point
- Core consumables like food, litter, and treats often need 95%–98% service levels
- Holiday and seasonal pet items can jump to 2x to 3x normal weekly demand
- Good forecast targets for steady consumables are often MAPE under 10%–15%
- Shopify inventory should stay within about ±1% to 2% of physical counts
Here’s the short version of what I’d take away:
- Forecast each location separately
- Split consumables, accessories, and seasonal items into different forecast models
- Use weekly cycle counts on top SKUs
- Reorder based on on-hand + inbound, not on-hand alone
- Transfer stock from overstocked sites before paying for rush POs
- Watch stockout risk, days of cover, transfer activity, and total inventory value every week
If I had to sum up the whole piece in one line, it would be this: multi-location inventory works when forecasts, counts, replenishment, and transfers all run on the same weekly routine.
Forecast demand by SKU, channel, and location
A blended company forecast is one of the easiest ways to end up with stockouts at the location level. The fix is simple: build forecasts by SKU, channel, and location. When you rely on blended numbers, you miss what each site is actually shipping, and that’s where trouble starts.
Start with 12 months of order history. Then map those orders to fulfillment zones and use that mix to set location-level demand. Say your West Coast DC handles 40% of your 20 lb. kibble volume and your East Coast DC handles 35%. Those shares should become your allocation baseline. Don’t split inventory evenly across warehouses just because it feels neat. Once demand is tied to each location, you can set stock targets and reorder timing with far less guesswork.
Forecast consumables, accessories, and seasonal items separately
These categories need separate models because they don’t behave the same way.
Consumables like kibble, wet food, litter, and daily treat pouches tend to have recurring, fairly steady demand. Forecast them using baseline sales, a seasonal index, and a trend factor. For example, if a 12 oz. treat pouch has a November seasonal index of 2.8×, the forecast is:
forecast = baseline × 2.8.
Accessories such as collars, bowls, and leashes usually move more slowly and less evenly. Use 180 to 365 days of history and bias low. If you over-forecast here, you tie up cash without doing much to protect service levels.
Seasonal items need calendar-based profiles of their own. Flea and tick products usually start ramping in March or April and peak around May–June across most U.S. regions, while warmer southern states often start earlier. Summer travel accessories tend to spike from Memorial Day through Labor Day. In Q4, gifting items like holiday bundles, themed treat assortments, and gift-boxed toys can hit 2× to 3× baseline weekly demand in November and December. Build region-specific seasonal factors for these SKUs instead of using one national average. A single national curve can miss spring demand in warm-climate markets and overshoot colder regions.
Combine top-down and bottom-up planning
Top-down planning begins with your quarterly USD revenue target, split by channel. If your DTC channel is expected to bring in $120,000 in dry food revenue for the quarter and your 20 lb. kibble bag sells for $59.99, implied demand is about 2,000 units. From there, allocate units across locations using your past zone demand percentages, then add any planned growth.
Next, check that plan against last year’s actual unit sales. If the top-down plan says a warehouse should double kibble units, but that location grew only 12% last year and there’s no major new initiative behind the jump, that assumption deserves a hard look. On the other hand, if a fast-moving 12 oz. treat pouch shows a big gap between past growth and planned units, you may need to push the forecast up so you don’t under-allocate inventory.
The goal is a clear unit target for each location that flows straight into safety stock and replenishment timing.
Track forecast accuracy and adjust your buys
Forecast accuracy metrics show where the model is going off track before stockouts make the problem obvious. Track MAPE and bias by SKU and location each month so you can see both the size of the error and its direction.
For steady consumables, a MAPE below 10–15% is a solid target. Seasonal and promo SKUs will usually come in higher. But the number to watch most closely is bias. A steady negative bias means actual demand keeps coming in above forecast, which puts you on a direct path to stockouts. A steady positive bias means you’re ordering too much and parking cash in inventory.
Here’s what that looks like in practice:
- If your East Coast DC posts a MAPE of 35% and a bias of -20% on a pumpkin-flavored 12 oz. treat pouch after Q4, your holiday uplift factor was too low. Increase the Q4 seasonal factor for that SKU at that location by 20–25% in next year’s plan and move replenishment earlier.
- If your Central DC shows a positive bias of 10% on grain-free kibble, cut the base forecast there by 5–10% and tighten your open-to-buy for that region.
These are targeted fixes, not blanket corrections. That’s how forecast quality gets better over time.
Use these forecasts to set safety stock and reorder points by location.
Set reorder points, safety stock, and replenishment timing by location
Use your SKU-by-location forecast to turn demand into clear buy signals. That means setting buy points, safety stock, and reorder timing for each location.
Calculate safety stock for each warehouse and store
Safety stock is your buffer against demand jumps and supplier delays. Set it by location type, demand swings, and how steady lead times are.
For a central warehouse, a stats-based formula is a good fit:
Safety Stock = Z × √(L̄ × σ_d² + D̄² × σ_LT²)
Here, Z is the service level factor, L̄ is average lead time in days, σ_d is the standard deviation of daily demand, D̄ is average daily demand, and σ_LT is the standard deviation of lead time. At a 95% service level, Z is about 1.65.
For stores that get replenished from a warehouse, a simpler max/min method can do the job:
Safety Stock = (Max Daily Sales × Max Lead Time) − (Avg Daily Sales × Avg Lead Time).
The table below gives rough ranges by location type.
| Location Type | Lead Time (from supplier or warehouse) | Demand Volatility | Recommended Safety Stock (days of cover) | Best Use Case |
|---|---|---|---|---|
| Central warehouse | 7–30 days, variable | Aggregated, more stable | 10–20 days (consumables); 5–10 days (accessories) | National or regional hub feeding stores and online channels |
| Regional warehouse | 5–15 days | Moderate | 7–14 days (consumables); 5–7 days (accessories) | Regions with distinct demand patterns |
| High-volume store | 2–7 days from warehouse | High; spikes on weekends and promos | 5–10 days (consumables); 3–5 days (accessories) | Urban or flagship locations with heavy foot traffic |
| Standard store | 2–7 days from warehouse | Moderate, stable repeat customers | 3–7 days (consumables); 2–4 days (accessories) | Typical suburban stores with predictable local demand |
| Seasonal/pop-up | Variable, often longer | Highly volatile, event-driven | 7–14 days for key seasonal SKUs; minimal for non-core | Holiday markets, event booths, temporary promos |
For core consumables like dry food, wet food, and litter, aim for 95%–98% service levels and carry more days of cover before peak seasons. For slower-moving accessories, keep buffers tighter so you don’t tie up cash.
Build reorder points that account for inbound inventory and supplier constraints
A reorder point, or ROP, tells your team when it’s time to place the next order:
ROP = (Average Daily Demand × Lead Time) + Safety Stock Units
Say your central warehouse stocks a 20 lb. grain-free kibble bag. If average daily demand is 40 units, supplier lead time is 10 days, and safety stock is 7 days of cover or 280 units, the ROP is 680 units.
Before anyone places an order, check more than just on-hand stock. Look at:
- on-hand inventory
- open POs
- inbound transfers
If you have 900 units on hand and 300 units inbound, there’s no need to reorder yet.
Supplier minimums and case-pack rules shape the final order quantity. If your dry food supplier has a 600-unit minimum in case packs of 12, and your raw need comes out to 500 units, you round up to 600. If you buy on a weekly schedule, fold that cadence into your effective lead time so the ROP matches the gap until the next order window.
Use open-to-buy planning to protect cash while staying in stock
Reorder points tell you when to buy. Open-to-buy (OTB) tells you how much you can buy in a given month without going past your inventory budget.
The category-level formula is:
OTB (at cost) = Planned Ending Inventory + Planned Sales − Current Inventory − On Order (all at cost)
If planned sales at cost are $60,000, planned ending inventory is $60,000, current inventory is $80,000, and on order is $20,000, then OTB is $20,000.
Run OTB by category, not as one big pool. A simple split would be:
- food
- litter
- treats
- seasonal items
If a reorder point says “buy now” but that purchase would push you past the OTB cap, put fast-moving, high-margin SKUs first. For perishable pet food and treats, don’t build extra buffer that may sit too long and expire before it sells.
If one location is running short while another is sitting on extra stock, move inventory first instead of placing a rush PO.
sbb-itb-f0fc809
Allocate inventory and plan transfers across your network
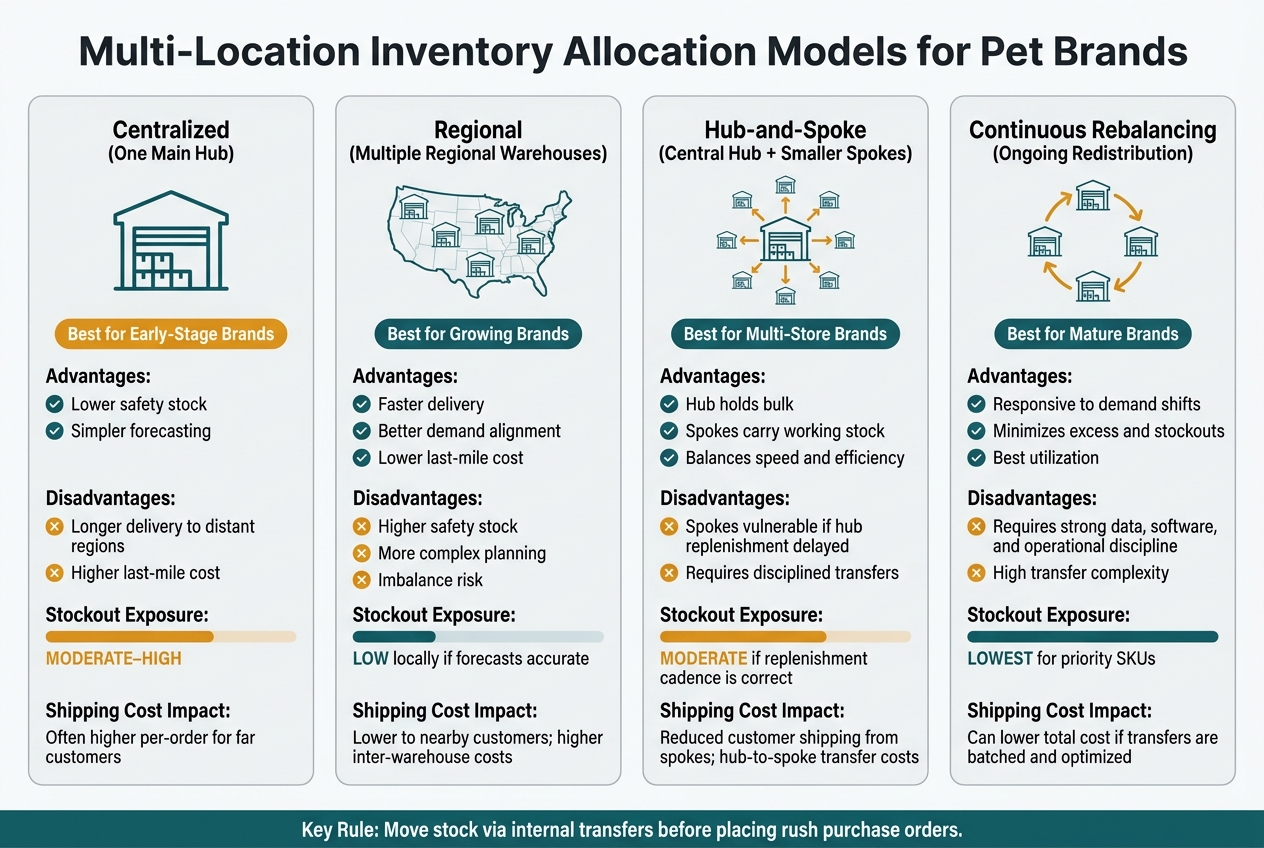
Multi-Location Inventory Allocation Models for Pet Brands
Place the right pet SKUs in the right locations
Use your forecast at the SKU, channel, and location level to decide where each item should live. The goal is simple: put each SKU in the place where it’s most likely to sell fast. That means looking at sales velocity, size, regional demand, and service level.
Some pet products need to stay close to demand. Large bags of dry dog food, cat litter, and top-selling treats move fast, cost more to ship across long distances, and can create stockouts fast if replenishment drags. Put bulky, fast-moving items near major demand centers to cut shipping cost and handling time.
Other products give you more room to work. Slow-moving accessories like grooming tools, specialty harnesses, and novelty toys can usually stay in one central warehouse without hurting service levels. Customers tend not to need those items right away, and the shipping math is less painful.
Regional demand matters too. Flea-and-tick products tend to sell faster in warmer, more humid markets. Winter paw balm usually does better in colder regions. If a SKU has a clear regional pattern, stock it where demand is strongest instead of spreading it evenly across the network.
One simple way to set this up is to split your catalog into three groups:
- A SKUs - dog food, cat litter, and top treats. These should be in every high-demand location and checked every week.
- B SKUs - seasonal flea and tick products, training pads, and mid-tier accessories. These can sit in one regional hub plus your main warehouse.
- C SKUs - niche supplements, premium gift sets, and specialty harnesses. Keep these centralized to limit handling and carrying costs.
As you assign SKUs, don’t stop at demand alone. Packaging size, shelf life, and minimum order quantities all matter.
Use transfers before placing rush purchase orders
If one location is running low and another has extra weeks of cover, an internal transfer is often the best first move. It helps you avoid supplier expedite fees, work around minimum order limits, and, in many cases, get stock there sooner than a new purchase order would.
A transfer makes sense when the receiving location is headed toward a stockout and the sending location can spare inventory without dropping below its safety stock floor. Say Store A has 12 days of litter left and Store B has 45 days. Moving 7 days of supply from B to A may stop a stockout at A without hurting B’s service level.
You also need to account for the full transfer lead time: pick, pack, ship, receive, and put-away. If that cycle takes several days, your rebalancing call has to include all of that time. Once a transfer starts, treat that inventory as unavailable at the origin. And don’t count it as usable at the destination until it has been received and reconciled.
That said, transfers can turn into a bad habit. If you’re moving the same SKUs between locations every few days, that usually points to a forecasting or starting allocation issue, not a shipping issue. Set a minimum transfer threshold based on unit count or projected shortage window before you trigger a move. It also helps to batch transfers around existing truck routes or labor windows so costs don’t get out of hand.
If transfers and reorders run off the same inventory view, you’ll spot shortages sooner.
Choose an allocation model that fits your growth stage
There’s no one setup that fits every brand. The right model depends on how many locations you have, how much demand swings, and whether you care most about cash, speed, or resilience.
| Model | Advantages | Disadvantages | Best Fit | Stockout Exposure | Shipping Cost Impact |
|---|---|---|---|---|---|
| Centralized (one main hub) | Lower safety stock; simpler forecasting | Longer delivery to distant regions; higher last-mile cost; stockout risk if demand spikes | Early-stage brands; primarily online with national shipping | Moderate–high in distant regions | Often higher per-order shipping for far customers |
| Regional (multiple regional warehouses) | Faster delivery; better demand alignment; lower last-mile cost in core regions | Higher safety stock; more complex planning; imbalance risk without active rebalancing | Growing brands with distinct regional demand and large customer bases in multiple areas | Lower locally if forecasts are accurate; higher if rebalancing lags | Lower to nearby customers; higher inter-warehouse and carrying costs |
| Hub-and-spoke (central hub + smaller spokes) | Hub holds bulk; spokes carry working stock; balances speed and inventory efficiency | Spokes vulnerable if hub replenishment is delayed; requires disciplined transfer processes | Brands with multiple retail stores or small warehouses replenished from a central DC | Moderate if replenishment cadence and safety stock are set correctly | Reduced customer shipping from spokes; hub-to-spoke transfer costs |
| Continuous rebalancing (ongoing redistribution) | Responsive to demand shifts; minimizes excess and stockouts; best utilization across locations | Requires strong data, software, and operational discipline; transfer volume and complexity rise | Mature brands with volatile demand and high-velocity SKUs across multiple locations | Lowest for priority SKUs when rules and data are solid | Can lower total cost if transfers are batched and optimized |
The next step is keeping that allocation accurate across Shopify and every other channel.
Track inventory across Shopify and other channels, then review the right metrics

Maintain one accurate inventory view across locations and channels
Once your allocation and transfer rules are in place, the next job is simple to say and hard to do: keep your live inventory record accurate enough to trust. That tracking layer is what keeps SKU forecasts, safety stock, and transfer calls grounded in what’s actually happening across locations.
Shopify tracks inventory by location. So each warehouse, store, 3PL, or pop-up should have one master SKU record, plus automated two-way sync across every system. Inventory remains separate by location, and your fulfillment rules determine which site ships each order. That way, each sale stays tied to the same item, overselling drops, and demand data stays clean enough for forecasting.
You’ll also want a steady routine for cycle counts, negative inventory checks, and record cleanup. Keep Shopify within ±1% to 2% of physical counts, and give one team or person clear ownership of that process so it doesn’t drift.
When you have one clean inventory view, weekly forecasts and replenishment calls are based on reality, not guesswork.
Use Forstock to turn inventory data into actions
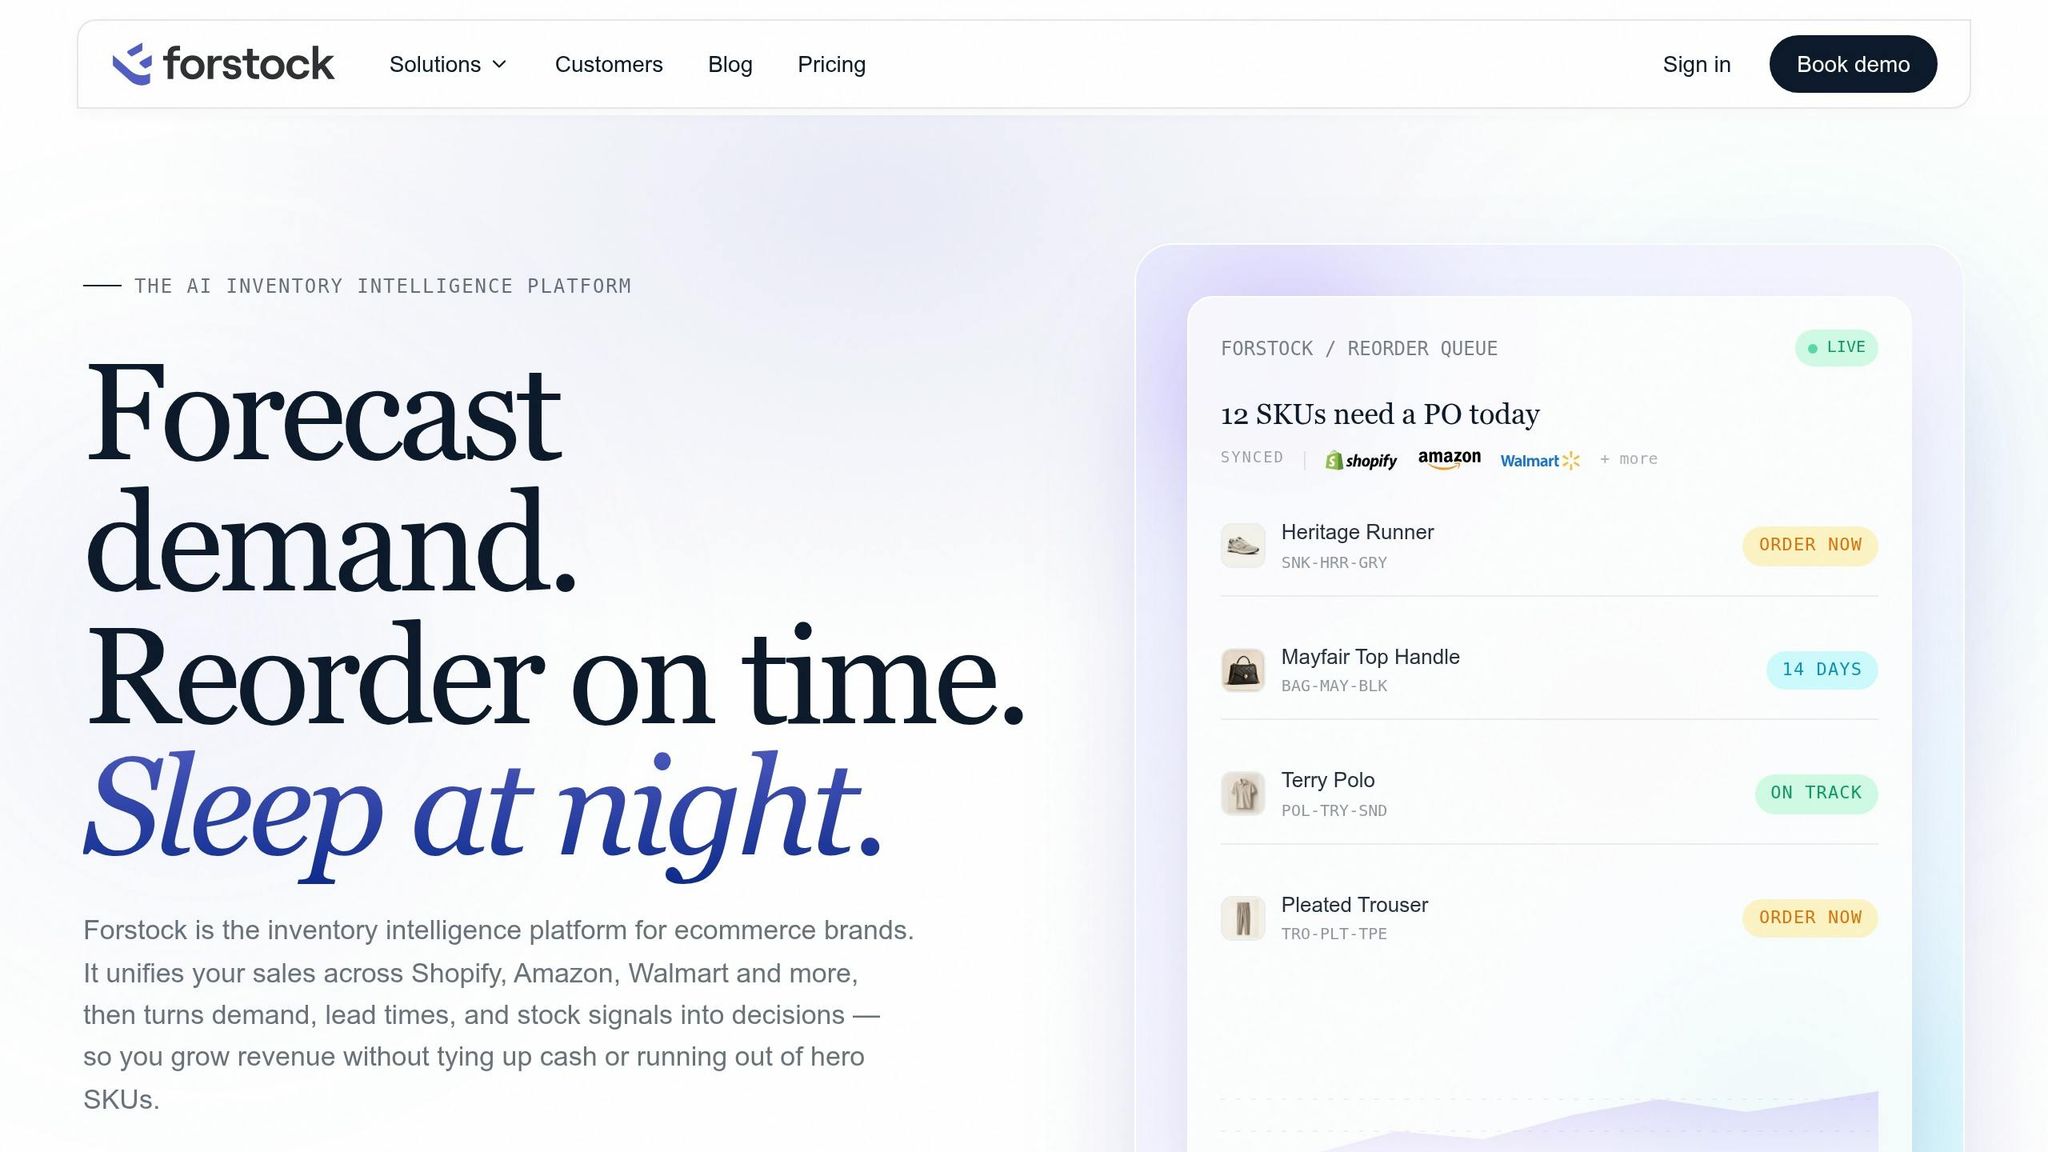
A single inventory view matters only if it helps your team make reorder and transfer decisions fast. Forstock pulls together your Shopify sales data, location-level inventory, supplier lead times, and warehouse activity into one planning workflow. In plain terms, it helps turn location-level demand forecasts and reorder points into action.
For pet brands, this tends to matter most for consumables. The system should flag stockout risk and point to the next step by location. You can use it to check days of cover by SKU and location before a promotion, then move before stockouts hit.
On the purchasing side, Forstock uses forecasted demand, current on-hand quantities, inbound POs, and supplier constraints to suggest order quantities and timing by location. From there, your team can review, approve, and export suggested POs in the same workflow.
Conclusion: A weekly routine that prevents stockouts
Multi-location growth is much easier to control when forecasting, replenishment, transfers, and inventory counts stay in sync. On a weekly cadence, review:
- Stockout risk
- Days of cover
- Transfer activity
- Total inventory value
FAQs
How do I forecast demand by location?
Treat each location as its own node. That means each one gets its own sales velocity, lead times, and safety stock instead of sharing one blended number across the network.
Use SKU-level sell-through data to measure demand. Leave out out-of-stock periods, and filter promo spikes so you can get to the true baseline instead of a distorted one.
Then calculate the reorder point for each location:
(Average Daily Sales × Lead Time in Days) + Safety Stock
Use that location’s actual transit and processing time. And when the history is strong enough, factor in weighted averages or seasonal patterns to make the number match how that location actually sells.
When should I transfer stock instead of reordering?
Transfer stock when one location has extra units and another is getting close to a stockout. Moving inventory you already have can meet short-term regional demand faster than placing a new supplier order.
This works well when inventory is uneven across locations. It can help cut holding costs and prevent stock from piling up where it isn’t needed. Before you move anything, compare the transfer, labor, and shipping costs against the cost and lead time of ordering from a supplier.
Which SKUs should stay centralized?
Put slower-moving C items in a central location. Keep fast-selling A items at each site so they stay available and service levels don’t slip.
ABC analysis helps you protect the products that drive sales by keeping top sellers close to customers. At the same time, it lets you centralize lower-performing items, which can cut storage costs and reduce day-to-day complexity.
Keep reading
Try Forstock free for 14 days.
AI-powered demand forecasting and reorder automation for Shopify brands. No credit card required.