Best Practices for Inventory Audit Checklists
Practical inventory audit checklist for Shopify stores covering prep, cycle counts, reconciliation, shrinkage analysis, and tools to maintain accuracy.
Best Practices for Inventory Audit Checklists
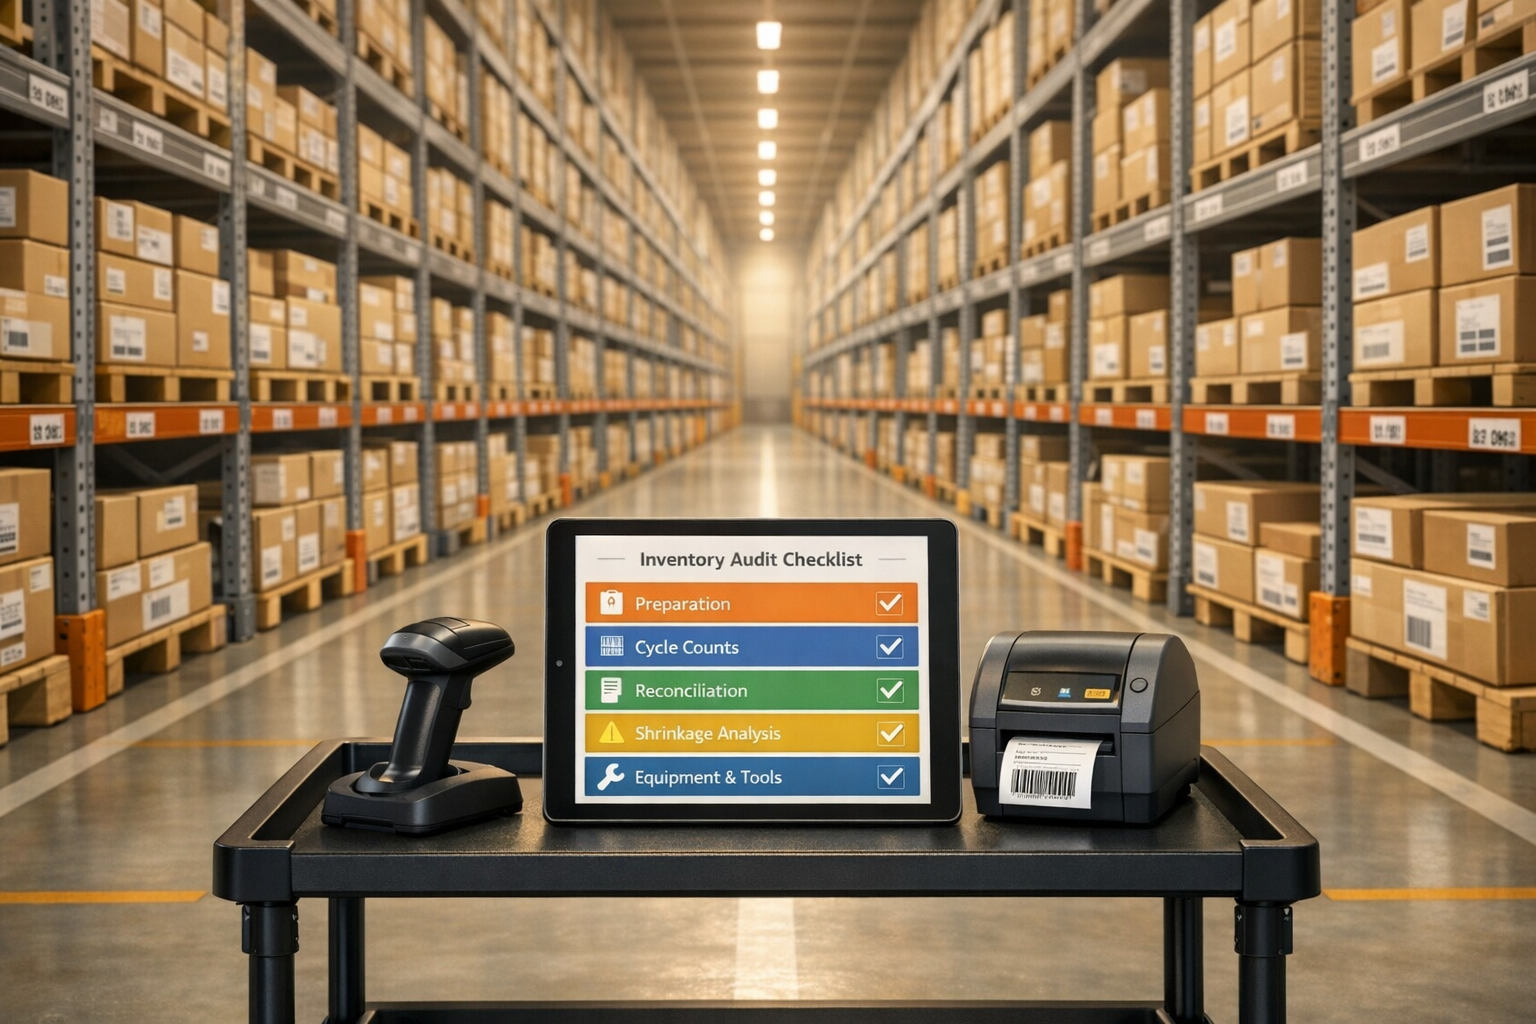
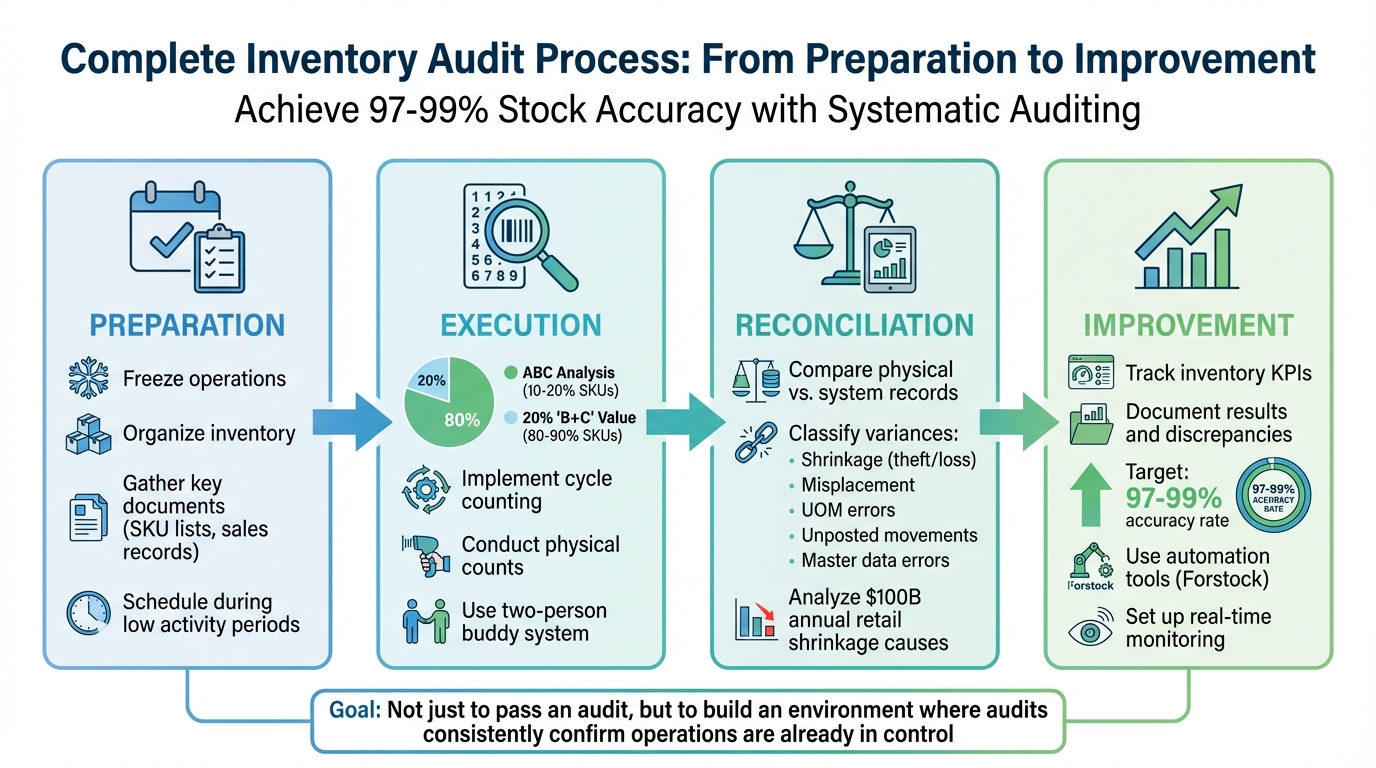
Inventory audits are essential for keeping your Shopify store's stock accurate and aligned with your records. A structured checklist helps identify discrepancies, reduce losses, and improve stock accuracy, which can reach levels of 97%-99% when done consistently. Here’s a quick summary of the process:
- Preparation: Freeze operations, organize inventory, and gather key documents like SKU lists and sales records.
- Execution: Use ABC analysis to prioritize high-value items, implement cycle counting to maintain accuracy, and conduct physical counts with clear procedures.
- Reconciliation: Compare physical counts with records, classify variances (e.g., theft, misplacement), and analyze shrinkage causes.
- Improvement: Track inventory KPIs, document results, and use tools like Forstock for real-time monitoring and automation.
4-Stage Inventory Audit Process for Shopify Stores
Inventory Management Audit Checklist | How to do Audit Testing of Material Receipt, Stored & Issued
sbb-itb-f0fc809
Pre-Audit Preparation Checklist
Getting ready for an inventory audit is all about ensuring your stock count matches what your system shows. The key? Freeze your operations so no transactions disrupt the process. Start by planning your audit during quieter times.
Schedule Audits During Low Activity Periods
For many retail businesses, January is a great time for audits since inventory levels are typically lower after the holiday rush. Aligning audits with your financial reporting cycles ensures your records are accurate. If possible, conduct counts overnight or during non-operational hours. If closing isn’t an option, stop all stock movements 1–2 hours before starting the count.
"Freeze receiving, picking, returns, transfers, and stock adjustments at least 1–2 hours before the audit window." - Team EasyReplenish
Physically block off areas like receiving and dispatch zones to prevent accidental stock movement. Make sure your team is informed ahead of time, so they understand their roles and the importance of maintaining the freeze.
Once the timing is set, it’s time to organize your inventory.
Organize Inventory for Easy Access
Start by separating inventory based on its condition. Damaged, expired, QC-hold, and return items should be moved into distinct areas. Mixing sellable and unsellable stock can lead to errors that complicate reconciliation.
Stick to a one-SKU-per-bin rule to avoid confusion or double-counting. Each bin should have a visible label that matches your system records and should only contain inventory listed in your system. Clear any obstacles in aisles and ensure items stored on higher shelves are easy to access. Open pallets and partially filled cartons should be tagged to prevent assumptions about their contents. Organizing the audit by physical location - like aisle or bay - rather than product type makes the workflow more manageable.
"An effective inventory audit isn't about 'counting stock.' It's about controlling the environment in which counting happens." - Team EasyReplenish
This level of organization ensures your count starts on the right foot.
Gather Required Documentation
Export your most recent Shopify inventory data, including a master SKU list, shipping logs, and sales records. Pull balance sheets, invoices, and purchase orders to cross-check against your physical counts.
Gather all open purchase orders, perhaps using specialized purchase order apps, Return to Vendor (RTV) authorizations, and pending stock adjustments. Make sure these transactions are either cleared or posted before the count begins, so your system reflects the actual stock baseline. Double-check SKU details, including units, barcodes, pack sizes, and variants.
Prepare count sheets, maps, and labels organized by bin or SKU. Review past audit reports to identify problem areas - like high-risk SKUs or zones - and integrate these findings into your planning process.
Core Audit Execution Checklist
Begin your physical inventory count to confirm whether your system's data aligns with what's actually in stock. This step is crucial to identify and correct any discrepancies.
Perform ABC Analysis for Prioritization
ABC analysis helps you focus on the inventory that matters most. Start by pulling your full SKU list along with annual demand and unit costs. Multiply these to calculate each item's annual value. Then, sort the list from highest to lowest and calculate cumulative percentages.
- Class A items: These typically make up 10%-20% of SKUs but represent 70%-80% of your inventory's total value. High-priority items like these require daily or weekly counts.
- Class B items: About 30% of SKUs, accounting for 15%-25% of value. These should be checked monthly.
- Class C items: Roughly 50% of SKUs but only 5% of the value. Quarterly or annual counts are sufficient for these.
This approach can achieve accuracy levels of 97%-99%. For Class A items, use blind counts - don't reveal system quantities to counters. This ensures they report what they see rather than what they expect.
"Blind counts test truth; guided counts test compliance. Mature warehouses use both - blind for control, guided for efficiency." - Team EasyReplenish
If you notice recurring discrepancies in Class B or C items, temporarily treat them as Class A until the issue is resolved. Once your priorities are set, integrate cycle counting to maintain accuracy.
Implement Cycle Counting Procedures
Cycle counting ensures accuracy without disrupting operations. Instead of shutting down for a full count once or twice a year, you check smaller groups of items on a rotating schedule.
For example, in July 2022, Alliance Resource Partners shifted from paper-based systems to mobile scan-as-you-go apps. This change improved their inventory accuracy by 40% and streamlined warehouse operations. Similarly, NLMK USA, a global steel manufacturer, adopted daily cycle counts with mobile barcoding. They reduced labor time by 60% while achieving 100% accuracy.
To minimize errors, use mobile scanners for real-time updates and apply a soft freeze in the counting zone. If a bin is emptied during picking, initiate an immediate zero count to confirm it's truly empty.
Every discrepancy requires investigation, not just adjustment. Apply the 5 Whys technique to uncover root causes, such as process flaws or data entry mistakes. Assign reason codes like "receiving error" or "mislabeling" to track trends and address recurring issues.
Conduct Physical Inventory Counts
Before starting, ensure your SKU master data is accurate. Many discrepancies stem from confusion over units - like individual pieces versus packs or cases - rather than missing stock. Assign team members to specific zones, and have them count systematically from left to right, top to bottom.
To reduce errors, use a two-person buddy system: one person counts while the other records. Mark counted items with colored stickers or tags to avoid double-counting or skipping areas. For high-value items, always perform a second independent count. Flag items that can't be counted - like those missing barcodes or damaged goods - with temporary labels for supervisor review.
The goal for Inventory Record Accuracy (IRA) is not 90% - it's 99% or higher. Every audit procedure should aim for this standard.
| Feature | Full Physical Inventory | Cycle Counting |
|---|---|---|
| Frequency | Once or twice a year | Daily, weekly, or monthly |
| Operational Impact | Requires full facility shutdown | Integrated into daily operations |
| Accuracy | High at point of count; decays quickly | Maintains high accuracy year-round |
| Labor | High intensity, often requires overtime | Low intensity, manageable daily routine |
Reconciliation and Analysis Checklist
After completing your physical inventory count, it's crucial to reconcile your records to spot discrepancies and address their causes effectively.
Reconcile Physical Counts with Records
Start by comparing your physical counts to the system records for each SKU, location, and unit of measure (UOM). To ensure accuracy, pause inventory movements and process all pending paperwork 1–2 hours before the audit. If discrepancies arise, recount the items - preferably with a fresh pair of eyes - to reduce human error. Pay close attention to unit consistency, such as distinguishing between cases and individual pieces.
Sometimes, variances that are multiples of 12 or 24 hint at case-versus-piece confusion rather than actual missing stock. If your physical count surpasses system records, check for unrecorded receiving paperwork or consignment stock from suppliers. Only update your records after verifying the counts, obtaining managerial approval, and using the correct reason codes.
Analyze Shrinkage Causes
Inventory shrinkage is a massive issue, costing the retail industry nearly $100 billion every year. Top retailers lose billions due to theft, damage, or misplaced items.
Classify variances into these key categories:
- Shrinkage: Includes theft or physical loss.
- Misplacement: Items stored in the wrong location.
- UOM Errors: Case-versus-piece confusion or mismatched pack sizes.
- Unposted Movements: Transfers or returns not logged in the system.
- Master Data Errors: Problems like duplicate barcodes or incorrect product identifiers.
Categorizing variances is essential. Without it, recurring issues might go unnoticed. For example, consistently finding extra stock in receiving areas could point to unposted Goods Received Notes (GRNs), while frequent shortages of high-value items might signal the need for tighter security measures.
| Variance Category | Common Root Causes | Recommended Corrective Action |
|---|---|---|
| Shrinkage | Theft, shoplifting, or physical damage | Enhance security and tighten access controls |
| Misplacement | Incorrect putaway or picking errors | Retrain staff on proper procedures |
| UOM Error | Case vs. piece confusion, pack-size issues | Update SKU data and standardize unit labeling |
| Unposted Movement | Pending GRNs, unrecorded transfers/returns | Freeze inventory movements; clear pending transactions |
| Master Data Error | Duplicate barcodes or wrong product IDs | Audit and clean up the SKU master database |
Focus your reconciliation efforts on high-value, fast-moving SKUs and items with repeated variances. If a particular category shows significant shrinkage, consider increasing cycle count frequency to catch future issues early. These classifications also help shape long-term trend analysis and process improvements.
Compare Trends from Prior Audits
Once discrepancies are reconciled and root causes identified, reviewing historical data can reveal recurring patterns. Metrics like stock accuracy percentage (comparing physical inventory to digital records) and shrinkage rate over time are particularly useful. For example, operations with accuracy levels of 97% to 99% typically have strong controls in place, while variances above 10% call for immediate attention.
Watch for patterns in specific warehouse zones. If certain aisles consistently show high discrepancies, it could point to poor picking or putaway practices. Additionally, analyze whether variances spike during busy times, like the holiday season, to improve labor and process planning. Issues with specific vendors - such as frequent receiving errors or short shipments - may highlight areas for supplier process reviews.
Maintain a detailed audit log that includes each variance, its reason code, and the root cause. This historical record helps leadership monitor warehouse performance and assess the impact of process improvements. To ensure corrective actions are working, conduct follow-up spot checks on high-variance zones or SKUs within 7–14 days after a major audit.
Post-Audit Improvement Checklist
Once you've reconciled discrepancies and identified root causes, the next step is to turn those audit insights into actionable, long-term process improvements. Here's how to use your findings to strengthen operations and prevent recurring issues.
Document Results and Discrepancies
Keep a detailed audit log that tracks every variance by SKU, location, and unit of measure (UOM). This log should identify where systems failed without glossing over issues. Include essential details like the audit date, auditor's name, variance amount, root cause classification (e.g., shrinkage, misplacement, UOM error, unposted movement, or master data error), corrective actions taken, and the responsible process owner.
To add clarity, include photos of critical discrepancies, such as damaged goods, mislabeled bins, or significant variances. These visuals provide context that raw numbers can't. Set variance thresholds based on item value - for instance, ±2% for low-value items and ±1% for high-value SKUs - so you can prioritize investigations where they’ll have the greatest impact.
Prepare a formal audit report summarizing key findings, such as the total value of adjustments required, recurring problem areas (e.g., specific warehouse zones), and specific recommendations for improvement. As Kendall Kunz from Forms On Fire explains:
"A good audit report doesn't just tell you what's wrong - it helps you make things right".
Track Inventory Accuracy KPIs
Use your physical count results to establish a baseline, then monitor key performance indicators (KPIs) to assess whether your process improvements are working. High-performing warehouses typically achieve inventory accuracy rates of 97% to 99%, with top facilities aiming for 99% or more.
| KPI | Formula / Definition | Purpose |
|---|---|---|
| Inventory Accuracy Rate | (Number of Accurate Items / Total Items Counted) × 100 | Measures how reliable your inventory records are |
| Inventory Shrinkage | (Value of Inventory Losses / Value of Total Inventory) × 100 | Quantifies losses from theft, damage, or errors |
| Inventory Turnover | Cost of Goods Sold / Average Inventory | Tracks how quickly inventory is converted into sales |
| Variance Rate | Average difference between physical count and system record | Highlights the size of discrepancies over time |
Drill down into these metrics by SKU, location, and zone to identify gaps in your processes. For example, if certain aisles consistently show high discrepancies, it could signal a training issue or a flawed workflow that requires immediate attention. Comparing results from multiple audits will also reveal whether accuracy is improving or if persistent problem areas remain.
Improve Methods with Forstock Analytics

Once you’ve identified patterns using KPIs, platforms like Forstock can help streamline improvements. With real-time dashboards, you gain continuous visibility into inventory health, eliminating the need to wait for the next physical audit to catch issues. Forstock's AI-powered forecasting models adjust to sales trends, lead times, and seasonality, ensuring you maintain optimal stock levels while avoiding excess inventory.
Set up automatic exception triggers to flag sudden drops in stock, repeated discrepancies in specific zones, or recurring UOM errors. These alerts allow for immediate action instead of waiting for scheduled audits. Forstock also categorizes variances automatically, helping you determine if issues are systemic - like understaffing in receiving causing rushed data entry - or one-off incidents.
The platform's unified dashboard tracks stock across multiple locations, offering the granular data needed for root cause analysis. For example, if a 10-unit shortage occurs, you can use tools like the "5 Whys" to trace the problem back to its source (e.g., rushed data entry due to understaffing). This proactive approach shifts audits from being reactive check-ups to driving continuous improvement. As Team EasyReplenish puts it:
"The goal isn't to pass an audit, but to build an environment where audits consistently confirm that the operation is already in control".
Using Forstock for Automated Audit Support
Incorporating Forstock's automated audit support into your inventory management process builds on the improvements you've already made. By automating audits, Shopify brands can transform routine checks into proactive measures, maintaining inventory accuracy without disrupting daily operations.
Set Up Real-Time Inventory Dashboards
Forstock's unified dashboard gives you instant access to stock levels across all locations, bridging the gap between physical counts and digital records. This means you can immediately identify discrepancies, such as "phantom inventory" - items that show up in your system but aren't actually on the shelves . By addressing these issues in real time, you eliminate the delays caused by manual counts.
The dashboard uses ABC analysis to focus attention on high-value items, ensuring detailed counts for critical SKUs. It also sends automated alerts for stockouts or overstock situations, helping you stay on top of inventory levels and protect your margins.
Additionally, the dashboard allows you to categorize variances - whether due to shrinkage, misplaced items, or unit-of-measure errors - so you can trace problems back to their source. For example, if discrepancies frequently occur in a specific warehouse zone or during certain shifts, it could point to a training issue or a flawed process. Before starting any audit, make sure all open purchase orders, returns, and transfers are updated in the system to avoid timing mismatches that could compromise your counts.
Use Reorder Suggestions During Audits
Audits don't just uncover errors - they also provide valuable data for refining your inventory decisions. Forstock's AI uses audit results to adjust reorder suggestions, factoring in physical count data, turnover rates, and supplier lead times . However, the accuracy of these suggestions depends on how well your physical and digital records align, so syncing them is essential.
During audits, check that Forstock's "Quantity on Hand" matches your actual counts. Use this information to fine-tune reorder points based on current turnover rates and margins. For instance, if an audit reveals high shrinkage for certain SKUs, you can adjust safety stock levels to account for these ongoing losses . Focus on high-value "A" items first, ensuring you avoid tying up cash in slower-moving "C" products. Also, review supplier lead times to ensure they reflect current performance. If a supplier consistently delivers late, update the lead time in Forstock to prevent stockouts or overordering in the future.
Automate Purchase Order Tracking
Forstock simplifies the purchase order process from start to finish. The platform automatically generates purchase orders based on reorder triggers and tracks them in real time by matching invoices, shipping logs, and supplier records . This eliminates the need for manual cross-checking, speeding up post-audit reconciliation.
During audits, Forstock's PO tracking feature allows you to confirm that all expected shipments have been received and properly recorded. If discrepancies arise, you can quickly access the relevant purchase order, check the shipping status, and identify whether the issue stems from a receiving error, supplier shortage, or data entry mistake. This level of visibility ensures that any problems uncovered during the audit are addressed immediately. By integrating these automated processes into your audit strategy, you can maintain continuous inventory accuracy without adding extra workload.
Conclusion
A well-structured inventory audit checklist isn’t just a formality - it’s a cornerstone for maintaining accurate stock control and ensuring smooth operations. When your physical inventory matches your financial records, you’re safeguarding one of your company’s most valuable assets while promoting financial accuracy and investor confidence.
Systematic audits go beyond simple verification. They help identify issues like phantom stock and shrinkage, which costs the retail industry nearly $100 billion annually. These audits also provide essential insights for forecasting and resource management. Companies with disciplined audit processes often achieve an impressive 97–99% stock accuracy rate, proving that structured systems lead to real, measurable results. Such precision lays the groundwork for integrating automation, making audits more efficient and effective.
Technology takes these benefits even further. For Shopify brands, tools like Forstock simplify the entire audit process. With real-time dashboards, AI-driven reorder recommendations, and automated purchase order tracking, it minimizes manual errors while keeping inventory visibility seamless. By incorporating these innovations into your audit strategy, you can shift your focus toward growth, all while keeping inventory management sharp and reliable.
"An effective inventory audit isn't about 'counting stock.' It's about controlling the environment in which counting happens." - Team EasyReplenish
FAQs
How often should I run inventory audits vs. cycle counts?
Inventory audits are usually done once a year or whenever necessary to verify stock accuracy across the board. In contrast, cycle counts happen more often - weekly or monthly - allowing businesses to tackle discrepancies in smaller, more manageable chunks. By keeping inventory records current, regular cycle counts can minimize the need for large-scale audits.
What should I do if my physical count doesn’t match Shopify?
If the numbers from your physical inventory count don’t align with what Shopify shows, it’s time to dig deeper. Start by reviewing your inventory records for any inconsistencies. Look for unposted adjustments, misplaced items, or possible data entry mistakes. Once you figure out the cause, make the necessary inventory adjustment to fix the mismatch. To avoid similar issues down the line, focus on regular audits and maintaining precise records.
How can Forstock help prevent inventory discrepancies?
Forstock tackles inventory issues by providing real-time demand forecasting, automated purchase order creation, and detailed inventory analytics. These features help keep stock levels in sync with sales trends, minimizing problems like stockouts, overstocking, or mismatched records. With its data-focused tools, Forstock simplifies inventory management, making it more precise and efficient.
Keep reading
Try Forstock free for 14 days.
AI-powered demand forecasting and reorder automation for Shopify brands. No credit card required.