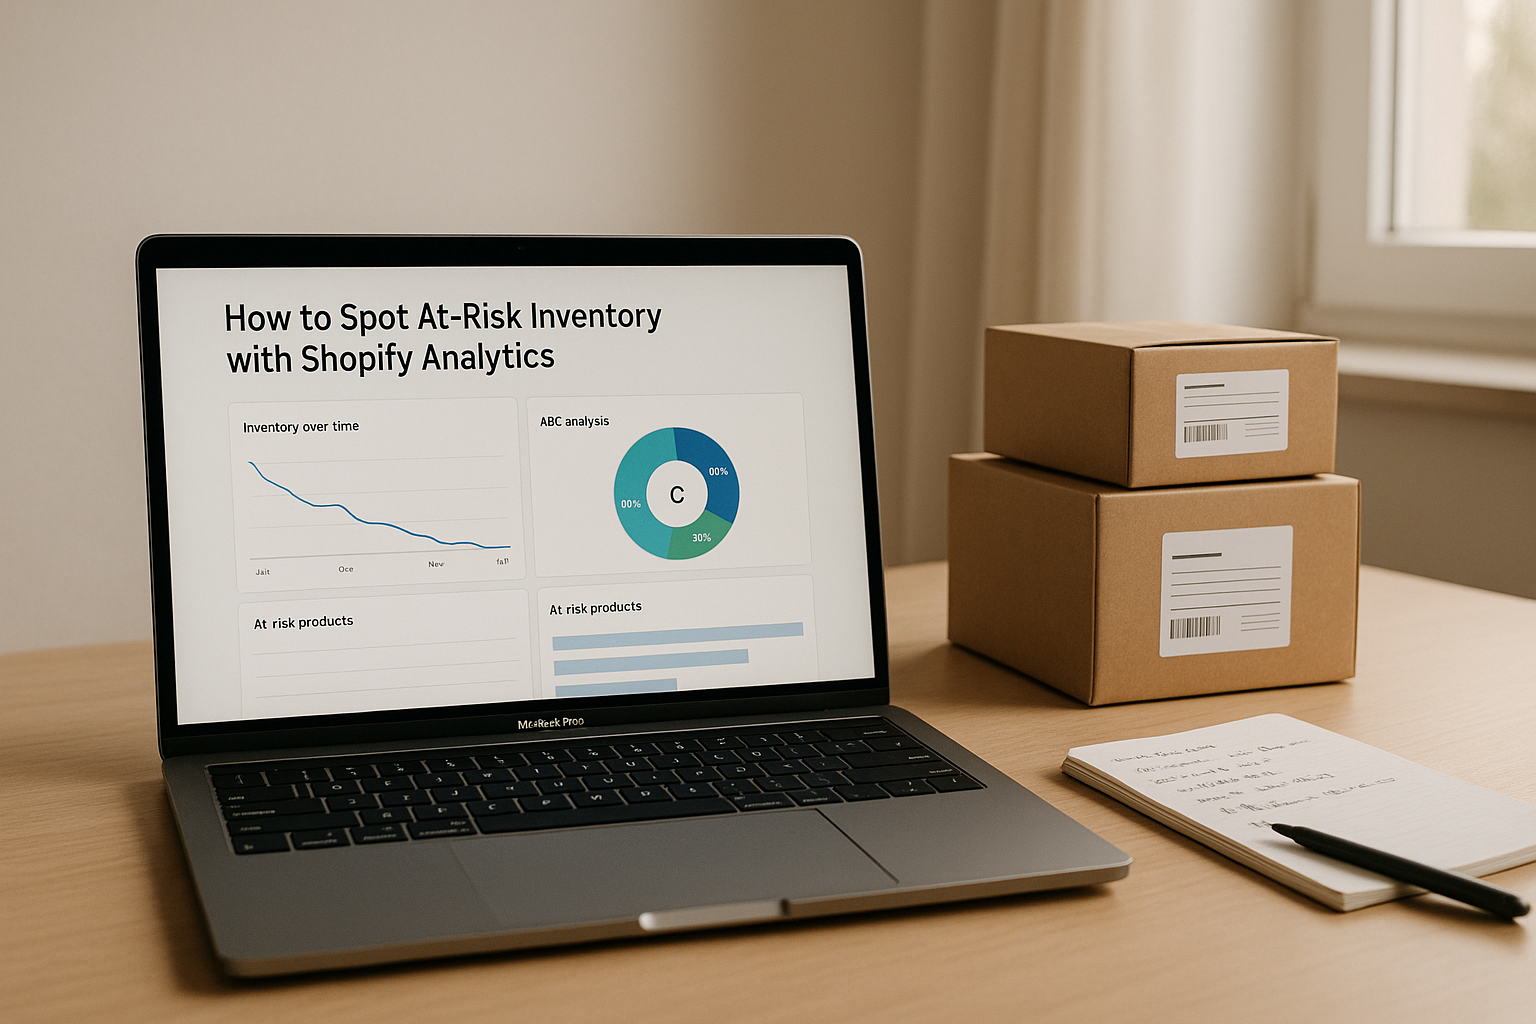
How to Spot At-Risk Inventory with Shopify Analytics
Learn how to identify and manage at-risk inventory using Shopify Analytics to prevent cash flow issues and enhance profitability.
How to Spot At-Risk Inventory with Shopify Analytics
Managing inventory well can prevent cash flow problems and lost sales. Shopify Analytics helps you identify at-risk inventory - products that sell too slowly, become dead stock, or sell out too quickly. Using key reports like Inventory Aging, Sales Velocity, and Inventory Turnover Rate, you can:
- Spot slow-moving or unsellable stock tying up capital.
- Identify products at risk of stockouts due to high demand.
- Reduce overstocking by tracking "days of inventory remaining."
For deeper insights, tools like Forstock integrate with Shopify to forecast demand, automate reordering, and simplify inventory management. This approach helps avoid costly mistakes, improve stock health, and free up capital for growth.
Shopify’s New Month-End Inventory Report Explained

Key Metrics to Track in Shopify Analytics
When it comes to optimizing your inventory management, Shopify Analytics provides several essential reports that can help you spot at-risk inventory. By keeping an eye on these metrics, you can address potential problems before they disrupt your cash flow. Below, we break down how each key metric can reveal inventory risks.
Inventory Aging
Inventory aging tracks how long products have been sitting in your warehouse without selling. This is crucial for identifying potential dead stock. The Month-end inventory value report shows the total monetary value of your inventory, calculated based on the cost per item at the time of sale. Pairing this report with sales data can highlight items with high inventory values but low sales, signaling a potential strain on cash flow.
The ABC product analysis report adds another layer by categorizing products into A, B, and C grades based on their revenue contribution. C-grade items - those contributing the least to revenue - pose a risk because they tie up warehouse space and capital. If a large portion of your inventory falls into this category, it may be time to reassess your stock strategy.
Sales Velocity and Inventory Turnover Rate
Sales velocity measures how quickly individual products sell within a specific timeframe, while the inventory turnover rate reflects how often your entire stock is sold and replenished. A decline in sales velocity can indicate shifting customer preferences or waning product demand.
To calculate your inventory turnover rate, divide your cost of goods sold by your average inventory value. A low turnover rate might signal overstocking, though the ideal rate will vary depending on your industry. Keeping an eye on these metrics can help you fine-tune purchasing plans or launch targeted promotions to clear out slow-moving products before they become a bigger issue.
Excess Inventory Value and Coverage
The Inventory remaining per product report estimates how many days your current stock will last based on average sales rates. Often referred to as "days of inventory remaining" or inventory coverage, this metric helps you spot overstocking risks.
For example, products with more than 180 days of inventory remaining are likely overstocked. Holding onto these items for six months or longer can lead to obsolescence or higher storage costs.
| Report Type | Key Insight | Action Trigger |
|---|---|---|
| Month-end inventory value | Total capital tied up in current stock | High values for slow-moving items indicate overstocking |
| ABC product analysis | Revenue contribution by product grade | C-grade products with high inventory values need reduction |
| Inventory remaining per product | Days of stock left at current sales pace | 180+ days remaining signals potential overstocking |
By using these reports, you can identify areas where your capital is unnecessarily tied up. For instance, spotting $50,000 worth of C-grade items with over 200 days of inventory coverage could highlight a major cash flow issue. Reducing orders for these products and prioritizing faster-selling items can free up working capital and improve overall efficiency.
Consistently monitoring these metrics allows you to adjust your reorder quantities and avoid overstocking before it becomes a costly problem.
Step-by-Step Guide: Using Shopify Analytics to Find At-Risk Inventory
Shopify Analytics is a powerful tool for identifying inventory that may need your immediate attention. Follow these steps to access, interpret, and act on your inventory data effectively.
How to Access Shopify Analytics Reports
Start by logging into your Shopify admin account. From the main menu, head to the Analytics section and select Reports to access the dashboard. To save time, use the Category filter at the top of the page and choose Inventory from the dropdown. This ensures you're only looking at inventory-specific data, avoiding distractions from sales, marketing, or customer reports.
You can refine these reports further by selecting specific date ranges or filtering by individual products or categories. Just make sure your staff has the necessary Analytics permissions to access this data. Keep in mind that inventory updates may take anywhere from 12 to 72 hours to reflect in your reports. Once you're set up, focus on your inventory aging and sales velocity to identify potential risks.
How to Read Inventory Aging and Sales Velocity Reports
Start with the month-end inventory report. Compare the data to your recent sales figures to spot products that have high inventory but slow sales. These items could signal potential issues.
Next, check the Inventory Remaining per Product report. This report estimates how many days your current stock will last based on your current sales pace. If the estimated duration is unusually long, it could indicate a problem.
Pay close attention to sales velocity trends rather than just the current numbers. For example, a product that sold well a few months ago but is now slowing down might reflect changing customer preferences or market conditions. Spotting these trends early allows you to adjust your purchasing strategy before excess inventory becomes dead stock. Once you've identified at-risk products, export the data for a deeper dive.
How to Export and Analyze Inventory Data
To analyze your data further, use the Export button to download reports as CSV files. These files can be opened in tools like Excel or Google Sheets for advanced analysis. Export multiple reports from the same time period to cross-reference data and perform custom calculations. With this approach, you can develop formulas to track metrics like inventory turnover rates or detect seasonal patterns that might not be obvious in Shopify's interface.
Combine these insights with supplier details, lead times, and seasonal trends to create smarter reorder strategies. By setting up a regular schedule - weekly or monthly - for exporting and reviewing inventory data, you can identify trends early and make informed decisions to keep your cash flow steady.
sbb-itb-f0fc809
Using Advanced Tools for Better Inventory Management
Shopify Analytics offers a solid foundation for understanding your inventory performance, but advanced tools can take your management strategy to the next level. By pairing Shopify's data with automation and forecasting, these tools help you make smarter, more proactive decisions.
How Forstock Works with Shopify Analytics
Tools like Forstock build on Shopify Analytics by refining demand forecasting and automating key processes. Forstock integrates directly with your Shopify store, using the data you already track to predict future demand. While Shopify Analytics focuses on past performance, Forstock extracts insights from sales history, current stock levels, and product trends to forecast what’s ahead.
This forward-looking approach helps you spot inventory risks, like potential dead stock, before they become costly problems.
Forstock’s AI-powered models analyze sales patterns, lead times, and seasonal trends to automate reorder quantities. This reduces the risk of stockouts or overstocking, keeping your cash flow in check. Beyond forecasting, the platform streamlines supplier management, allowing you to track supplier performance, manage lead times, and coordinate orders - all while keeping your Shopify data in full view. Say goodbye to juggling spreadsheets and disconnected systems when making purchasing decisions.
Key Forstock Features for Shopify Merchants
Forstock offers a dashboard that gives you a clear, real-time view of your inventory health across all products and locations. You can quickly see which items are nearing reorder points, identify excess stock, and monitor shifts in demand - all in one place.
The 12-month demand planning feature helps you prepare for seasonal changes, optimize marketing campaigns, and make smarter product decisions. For example, if you’re gearing up for a holiday sale, you can estimate the inventory you’ll need by analyzing historical trends and current patterns.
Forstock’s Stock Intelligence feature provides detailed performance insights for each product. With its Inventory Table, you get reorder suggestions, safety stock recommendations, and analytics that explain why certain items might be at risk. This is especially helpful for merchants managing complex catalogs with multiple product variations.
Reorder suggestions simplify purchasing decisions by calculating specific quantities based on your sales velocity, lead times, and target stock levels. This ensures you maintain the right inventory balance without over-investing in slow-moving items.
For businesses operating across multiple channels or locations, Forstock combines Shopify data with insights from other sales platforms, giving you a unified view of your inventory. With this comprehensive perspective, you can make informed decisions based on the most current and complete data available.
Best Practices to Prevent Dead Stock with Data Analytics
Avoiding dead stock requires consistent monitoring, smart automation, and thoughtful planning. By leveraging data analytics, you can keep your inventory in check, improve cash flow, and boost profitability. Let’s explore some practical strategies to help you stay ahead of potential inventory issues.
Check Inventory Metrics Regularly
Keeping a close eye on your inventory metrics is the backbone of good stock management. Reviewing key performance indicators (KPIs) weekly can help you spot potential problems before they snowball into costly mistakes. Pay attention to metrics like inventory turnover, sell-through rates, and weeks on hand to uncover emerging trends.
"Effective inventory management is about maintaining the right amount of stock to avoid excess supply while ensuring sufficient supply to meet market demand. It is a balancing act, and when done well, all of the brand's marketing activities will work better." – Deb Mukherjee, Head of Marketing, GoodDay Software
Two key metrics to watch are your inventory turnover ratio and dead stock percentage. A low turnover ratio often signals overstocking, while higher dead stock percentages indicate items that are tying up capital without contributing to revenue.
To stay on top of these trends, update your inventory data frequently - ideally in real time or with hourly reporting. This level of visibility allows you to act quickly, whether that means adjusting prices, launching promotions, or liquidating stock before it becomes unsellable.
Additionally, tracking trends over time can reveal valuable insights. For example, if your sell-through rate steadily declines over a three-month period, it might signal a shift in market demand or suggest that you’re ordering too much. Regular analysis of these patterns helps you make informed decisions and lays the groundwork for automated inventory control.
Set Up Automated Reorder Points
Relying on manual processes for inventory management can lead to errors and inconsistencies. Automated reorder points take the guesswork out of restocking by triggering orders when stock levels hit predefined thresholds. This helps you avoid both stockouts and over-purchasing, which are common culprits behind dead stock.
To establish effective reorder points, consider your sales velocity and supplier lead times. For instance, if a product sells 50 units per week and your supplier takes two weeks to deliver, setting a reorder point at 120–130 units provides a buffer for safety stock and demand fluctuations.
Modern inventory tools can make this process even easier by automatically calculating optimal reorder quantities based on historical sales data. You can also set up alerts for low-stock levels on fast-moving items and warnings for products with poor sell-through rates. These automated notifications ensure you’re always a step ahead without needing to micromanage your inventory.
Combine Supplier Data with Sales Trends
Your suppliers play a big role in your inventory strategy. Variability in lead times or inconsistent deliveries can force you to hold extra stock, increasing your risk of dead inventory. Tracking supplier performance against promised lead times can help you improve your forecasts and reduce these risks.
Take it a step further by sharing 12-month demand forecasts with your suppliers. Incorporating seasonal sales patterns into these conversations can lead to better pricing, more reliable delivery schedules, and even reduced minimum order quantities during slower periods.
Conclusion: Managing At-Risk Inventory
Managing at-risk inventory isn’t just about avoiding losses - it’s about creating opportunities. By keeping a close eye on key Shopify Analytics metrics like inventory aging, sales velocity, and turnover, you can spot potential issues early and take action before they snowball into bigger problems.
Staying on top of these metrics, setting up automated reorder points, and working closely with your suppliers helps minimize waste and keeps your inventory aligned with demand. When you frequently track inventory turnover and maintain real-time stock visibility, your business is ready to adapt to market shifts and changing customer preferences. These foundational practices are essential, and advanced tools can take them even further.
Forstock, for example, uses AI to provide demand forecasting and automated purchase orders, helping businesses move from simply reacting to problems to proactively managing their inventory.
Effective inventory management doesn’t just prevent losses - it frees up cash that can be reinvested in growth areas like marketing, new product launches, or scaling operations. This improved cash flow can give your business a competitive edge and lay the groundwork for long-term success.
FAQs
How can I use Shopify Analytics to identify and manage at-risk inventory?
Shopify Analytics offers a powerful way to identify inventory that might be heading toward dead stock. It highlights crucial metrics like slow-moving products, low sales velocity, and aging stock. By digging into these insights, you can take proactive steps - whether that’s adjusting pricing, launching targeted promotions, or scaling back reorder quantities.
Keeping an eye on trends such as seasonal demand and product performance helps you fine-tune inventory turnover while cutting down on waste. These tools ensure your stock matches customer demand, boosting cash flow and keeping excess inventory in check.
How can integrating tools like Forstock with Shopify Analytics improve inventory management?
Integrating tools like Forstock with Shopify Analytics takes inventory management to the next level. It offers real-time demand forecasting, automated purchase order creation, and in-depth inventory insights. These capabilities help cut down on overstocking and stockouts, simplify operations, and enable smarter, data-driven decisions.
With Forstock’s AI-powered forecasting and smooth Shopify integration, you can stay ahead of sales trends, coordinate seamlessly with suppliers, and fine-tune stock levels. The result? You save time, improve cash flow, and meet customer demands with greater efficiency.
How can I use Shopify Analytics to identify the best inventory turnover rate for my business?
The best inventory turnover rate varies based on your industry and business model. Take retail as an example - here, a turnover ratio between 4 and 6 is often seen as a good range. This indicates that inventory is being refreshed consistently, avoiding issues like overstocking or running out of products.
To figure out the right rate for your business, tools like Shopify Analytics can be incredibly useful. By analyzing your sales trends, average inventory levels, and turnover ratio over time, you can uncover valuable insights. Compare these numbers to industry benchmarks to spot trends and fine-tune your restocking strategy. Keeping an eye on these metrics helps you maintain a balance between supply and demand, leading to smoother operations and improved cash flow.
Keep reading
Try Forstock free for 14 days.
AI-powered demand forecasting and reorder automation for Shopify brands. No credit card required.