Top KPIs for Advanced Inventory Analytics
Track nine essential inventory KPIs and use AI dashboards to reduce stockouts, cut carrying costs, and improve fulfillment for Shopify stores.
Top KPIs for Advanced Inventory Analytics
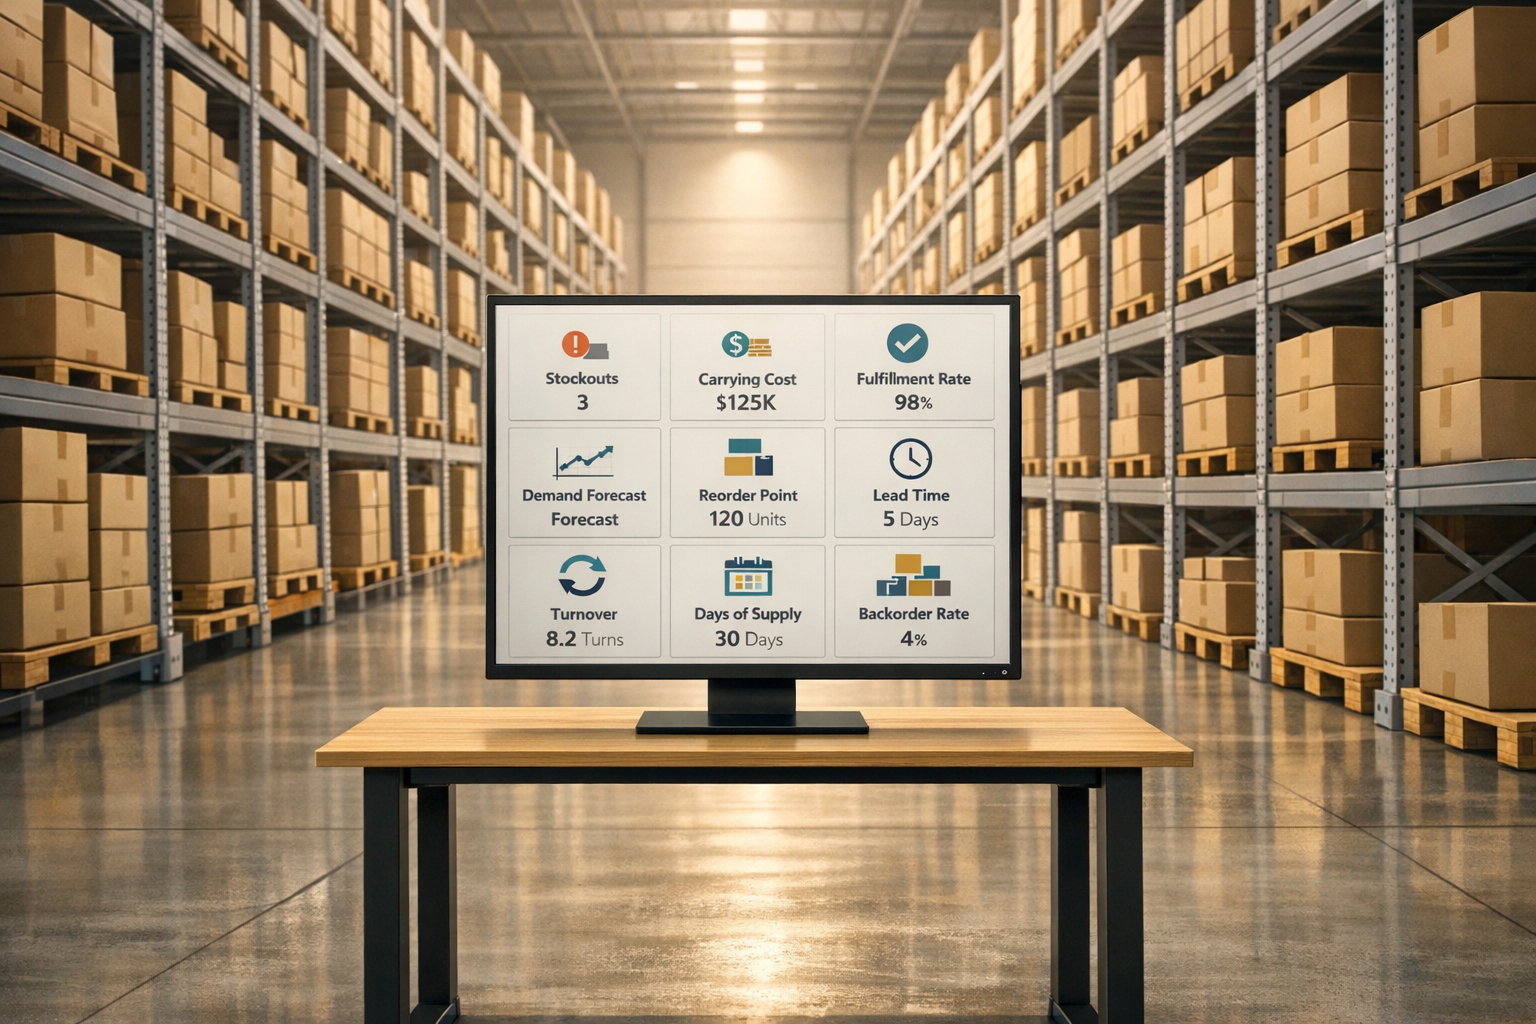
Advanced inventory analytics helps businesses make smarter decisions about stock levels, reducing costs and improving customer satisfaction. By tracking key performance indicators (KPIs), Shopify brands can avoid stockouts, minimize overstocking, and optimize cash flow. Here's what you need to know:
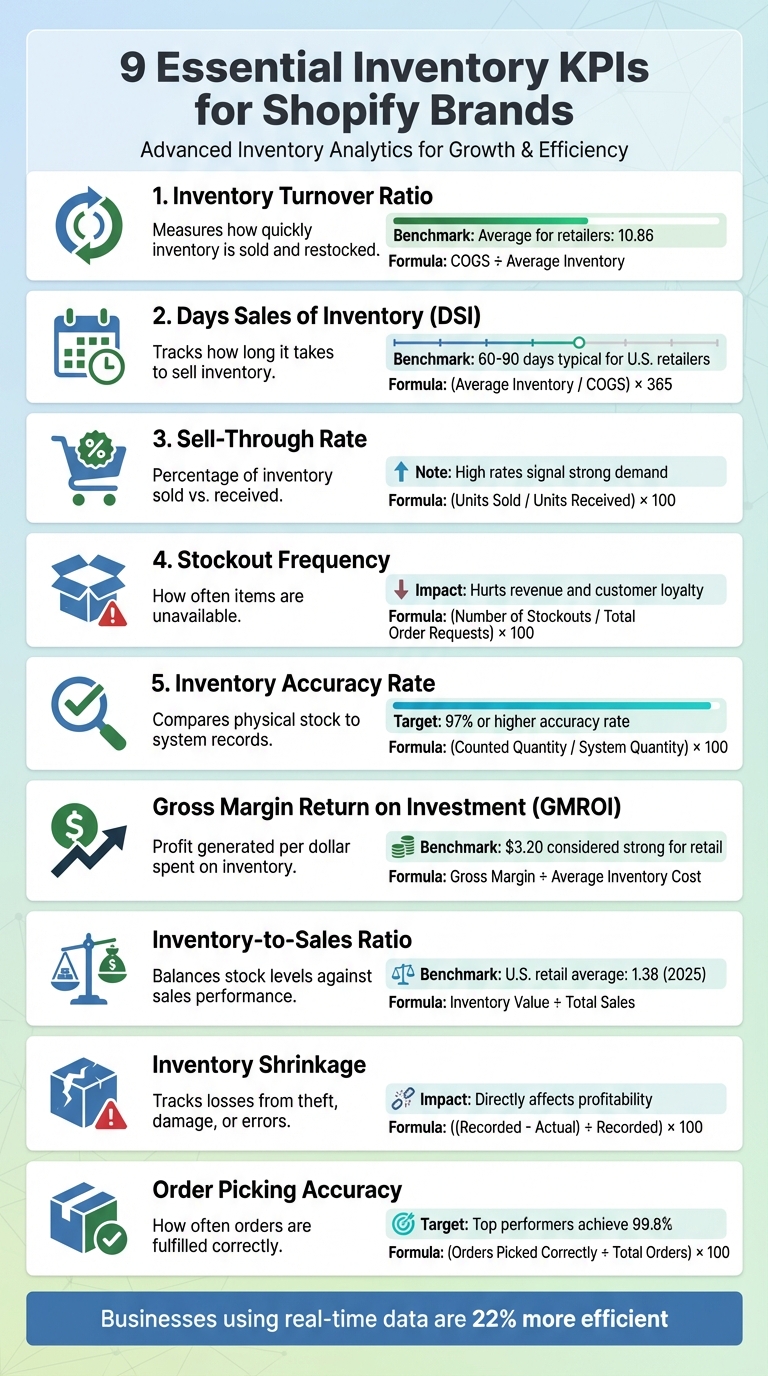
- Inventory Turnover Ratio: Measures how quickly inventory is sold and restocked. Higher ratios indicate efficient stock movement.
- Days Sales of Inventory (DSI): Tracks how long it takes to sell inventory. A range of 60–90 days is typical for U.S. retailers.
- Sell-Through Rate: Shows the percentage of inventory sold compared to what was received. High rates signal strong demand.
- Stockout Frequency: Highlights how often items are unavailable when customers want them. Frequent stockouts hurt revenue and loyalty.
- Inventory Accuracy Rate: Compares physical stock counts to system records. A 97% or higher accuracy rate is ideal.
- Gross Margin Return on Investment (GMROI): Reveals how much profit is generated for every dollar spent on inventory.
- Inventory-to-Sales Ratio: Balances stock levels against sales performance to avoid tying up capital in slow-moving items.
- Inventory Shrinkage: Tracks losses from theft, damage, or errors, which directly impact profitability.
- Order Picking Accuracy: Measures how often orders are fulfilled correctly, reducing returns and improving customer trust.
Platforms like Forstock simplify KPI tracking by centralizing data, automating forecasts, and providing real-time insights. This helps brands make better inventory decisions, cut costs, and boost profitability.
9 Essential Inventory KPIs for Shopify Brands
A Guide to Inventory KPIs and Reporting in Power BI
sbb-itb-f0fc809
Core Inventory KPIs Every Shopify Brand Should Track

Keeping an eye on the right KPIs is key to fine-tuning your inventory strategy. These metrics shed light on stock movement, cash flow challenges, and operational inefficiencies. Each one plays a role in helping you improve how your inventory performs.
Inventory Turnover Ratio
The Inventory Turnover Ratio is a must-track metric for managing inventory effectively. It tells you how often your business sells and replenishes inventory within a set period. The formula is simple: Cost of Goods Sold (COGS) divided by Average Inventory. To find the average inventory, add the starting inventory value to the ending value for the period, then divide by two.
A high turnover ratio points to strong sales and efficient inventory management - products are moving quickly, and cash isn’t tied up in unsold items. On the flip side, a low ratio could mean overstocking or weak demand, leaving you with stagnant inventory. For context, the average inventory turnover ratio for retailers is 10.86.
Forstock takes it a step further by tracking turnover rates at the SKU level, helping you pinpoint which items are selling fast and which ones are just sitting there. This insight allows you to make smarter purchasing decisions.
Days Sales of Inventory (DSI)
Also called Days on Hand, DSI measures how long it takes to turn inventory into sales. The formula is: (Average Inventory / COGS) × 365.
A good DSI typically ranges between 60 and 90 days. On average, U.S. retailers hold about $1.39 of inventory for every dollar they make. Items left in stock for 180 days or more are often considered dead stock.
Forstock uses AI-driven forecasting to analyze sales patterns, supplier lead times, and seasonal trends, helping you set optimal reorder points. For example, a 15-day DSI signals you have about two weeks’ worth of inventory left. This approach helps prevent stockouts while avoiding excessive storage costs.
Sell-Through Rate
This metric measures the percentage of inventory sold compared to the amount received from suppliers. The formula is: (Units Sold / Units Received) × 100. It’s especially useful for assessing seasonal items, promotional campaigns, and new product launches, as it shows how quickly specific shipments are moving.
A high sell-through rate indicates strong demand and a good product-market fit. A low rate suggests over-ordering or that the product isn’t resonating with customers. Tracking this metric within 30 days of receiving new stock allows you to adjust quickly if needed.
Forstock provides real-time sell-through insights across all SKUs and locations, helping you identify top performers and slow movers. This data empowers you to tweak pricing, bundle slow-selling items with popular ones, or adjust your ordering strategy. Pairing this with stockout frequency tracking ensures you meet demand while maintaining customer trust.
Stockout Frequency
Stockout frequency shows how often items are unavailable when customers want to buy them. The formula is: (Number of Stockouts / Total Order Requests) × 100. This metric directly impacts revenue and customer loyalty - frequent stockouts can push customers to competitors and hurt your brand’s reputation.
Forstock helps reduce stockout frequency using demand forecasting and safety stock recommendations. By analyzing past sales, current trends, and supplier lead times, the platform ensures you place replenishment orders before running out of stock. Automated low-stock alerts and reorder triggers further streamline the process, helping you capture every sales opportunity and keep customers happy.
Inventory Accuracy Rate
This KPI compares your physical inventory count to what your system says you have. The formula is: (Counted Quantity / System Quantity) × 100. A high accuracy rate - ideally 97% or more - is critical for reliable forecasting and smooth operations.
Discrepancies often arise from shrinkage or administrative errors, which can lead to unexpected stockouts or overstocking. Regular physical counts help close these gaps and keep your data reliable.
Forstock’s unified tracking system creates a single source of truth across all sales channels and warehouses. Integrated with Shopify, it provides real-time stock visibility and flags any discrepancies automatically.
Financial KPIs for Inventory Optimization
Operational KPIs track the flow of inventory, but financial metrics ensure that your inventory investments are actually driving profitability. These KPIs connect inventory decisions directly to cash flow and bottom-line performance, helping you evaluate whether your stock is delivering meaningful returns.
Gross Margin Return on Investment (GMROI)
GMROI tells you how much profit you're making for every dollar spent on inventory. The formula is simple: Gross Margin ÷ Average Inventory Cost. A GMROI above $1.00 means you're turning a profit, while a GMROI of $3.20 is often seen as strong for retail businesses.
This metric can be applied broadly, like across your entire store, or drilled down to specific SKUs. For example, in 2021, industry benchmarks showed electronics at $6.21, convenience stores at $6.69, and sporting goods at $2.10. Since inventory typically represents 70% to 80% of a retailer's assets, understanding which products justify that investment is crucial.
"GMROI helps you tailor your merchandising strategy to your most profitable items." - Deb Mukherjee
If an item has high sales but a low GMROI, it could signal a margin issue. In that case, adjusting supplier costs or pricing might make more sense than simply increasing orders. On the flip side, products with high GMROI but slower sales may benefit from better visibility - think improved merchandising or targeted email campaigns - rather than discounts. Tools like Forstock integrate GMROI data into purchase order recommendations, ensuring you prioritize restocking items that boost your bottom line. Shopify users can also access the "Profit by product" report to review gross profit and inventory costs without manual calculations.
Once you've tackled profitability, it's time to ensure your inventory aligns with sales performance.
Inventory-to-Sales Ratio
This ratio compares your inventory's value to the sales it generates. The formula: Inventory Value ÷ Total Sales. It’s a key indicator of whether your stock levels are balanced - enough to meet demand without tying up too much cash in slow-moving products.
A high ratio suggests your capital is stuck in inventory, leading to higher carrying costs, storage fees, and potential obsolescence. On the other hand, a low ratio could mean you're cutting it too close, risking stockouts and unhappy customers. For context, the U.S. retail inventory-to-sales ratio stood at 1.38 in 2025.
Breaking this ratio down by product category or vendor can reveal where your resources are being underutilized. If a SKU's ratio exceeds your target, consider clearance sales or bundling promotions to free up cash. Forstock’s demand planning tools align stock levels with sales forecasts, ensuring inventory doesn't outpace revenue - a critical factor for maintaining healthy cash flow.
Finally, safeguarding your inventory investment means keeping an eye on shrinkage.
Inventory Shrinkage Percentage
Shrinkage reflects inventory loss due to theft, damage, or administrative errors. The formula is: ((Recorded Inventory - Actual Inventory) ÷ Recorded Inventory) × 100. Every bit of shrinkage eats into your profitability.
The usual culprits include shoplifting, employee theft, fulfillment damage, and errors in manual data entry. Businesses that leverage real-time data are 22% more efficient and 17% better at managing risks, making accurate shrinkage tracking a must.
Regular physical inventory counts can help reconcile records and identify problem areas. Transitioning from manual spreadsheets to automated systems also reduces data entry errors. Forstock supports this process by offering month-end snapshots that flag discrepancies, such as negative quantities, for immediate follow-up. Its unified tracking system syncs inventory levels across all sales channels and warehouses in real time, helping to minimize losses from administrative mistakes.
Operational KPIs to Improve Fulfillment Efficiency
Operational KPIs measure how well daily processes are running. Inefficient fulfillment can lead to unhappy customers and hurt your brand's reputation.
Order Picking Accuracy
Order Picking Accuracy is a key metric calculated as: (Number of Orders Picked Correctly ÷ Total Number of Orders Picked) × 100. It reflects how well orders are being fulfilled without errors.
Incorrect order picking is a major issue, accounting for about 23% of all e-commerce returns. Top-performing companies maintain an accuracy rate of 99.8%, while most leading e-commerce brands aim for rates above 99% to reduce returns and protect their profitability.
"Mistakes at the picking stage directly impact customer experience and profitability." - Team Hopstack
Improving accuracy starts with optimizing your warehouse layout. Place high-demand items closer to packing stations and organize SKUs based on how frequently they’re ordered. Incorporating barcode or RF scanning technology and automated pick-and-pack systems can reduce errors by as much as 40%. Regular cycle counts also ensure that your system’s inventory data matches the actual stock on hand.
Forstock enhances operational accuracy by streamlining inbound inventory management. Proper labeling and recording of stock from the beginning ensure clean data and well-organized inventory. This precision at the start leads to fewer picking errors, which means fewer returns, less re-shipping, and happier customers. A smooth, accurate process is critical for maintaining efficient fulfillment operations.
How to Track Inventory KPIs with Forstock
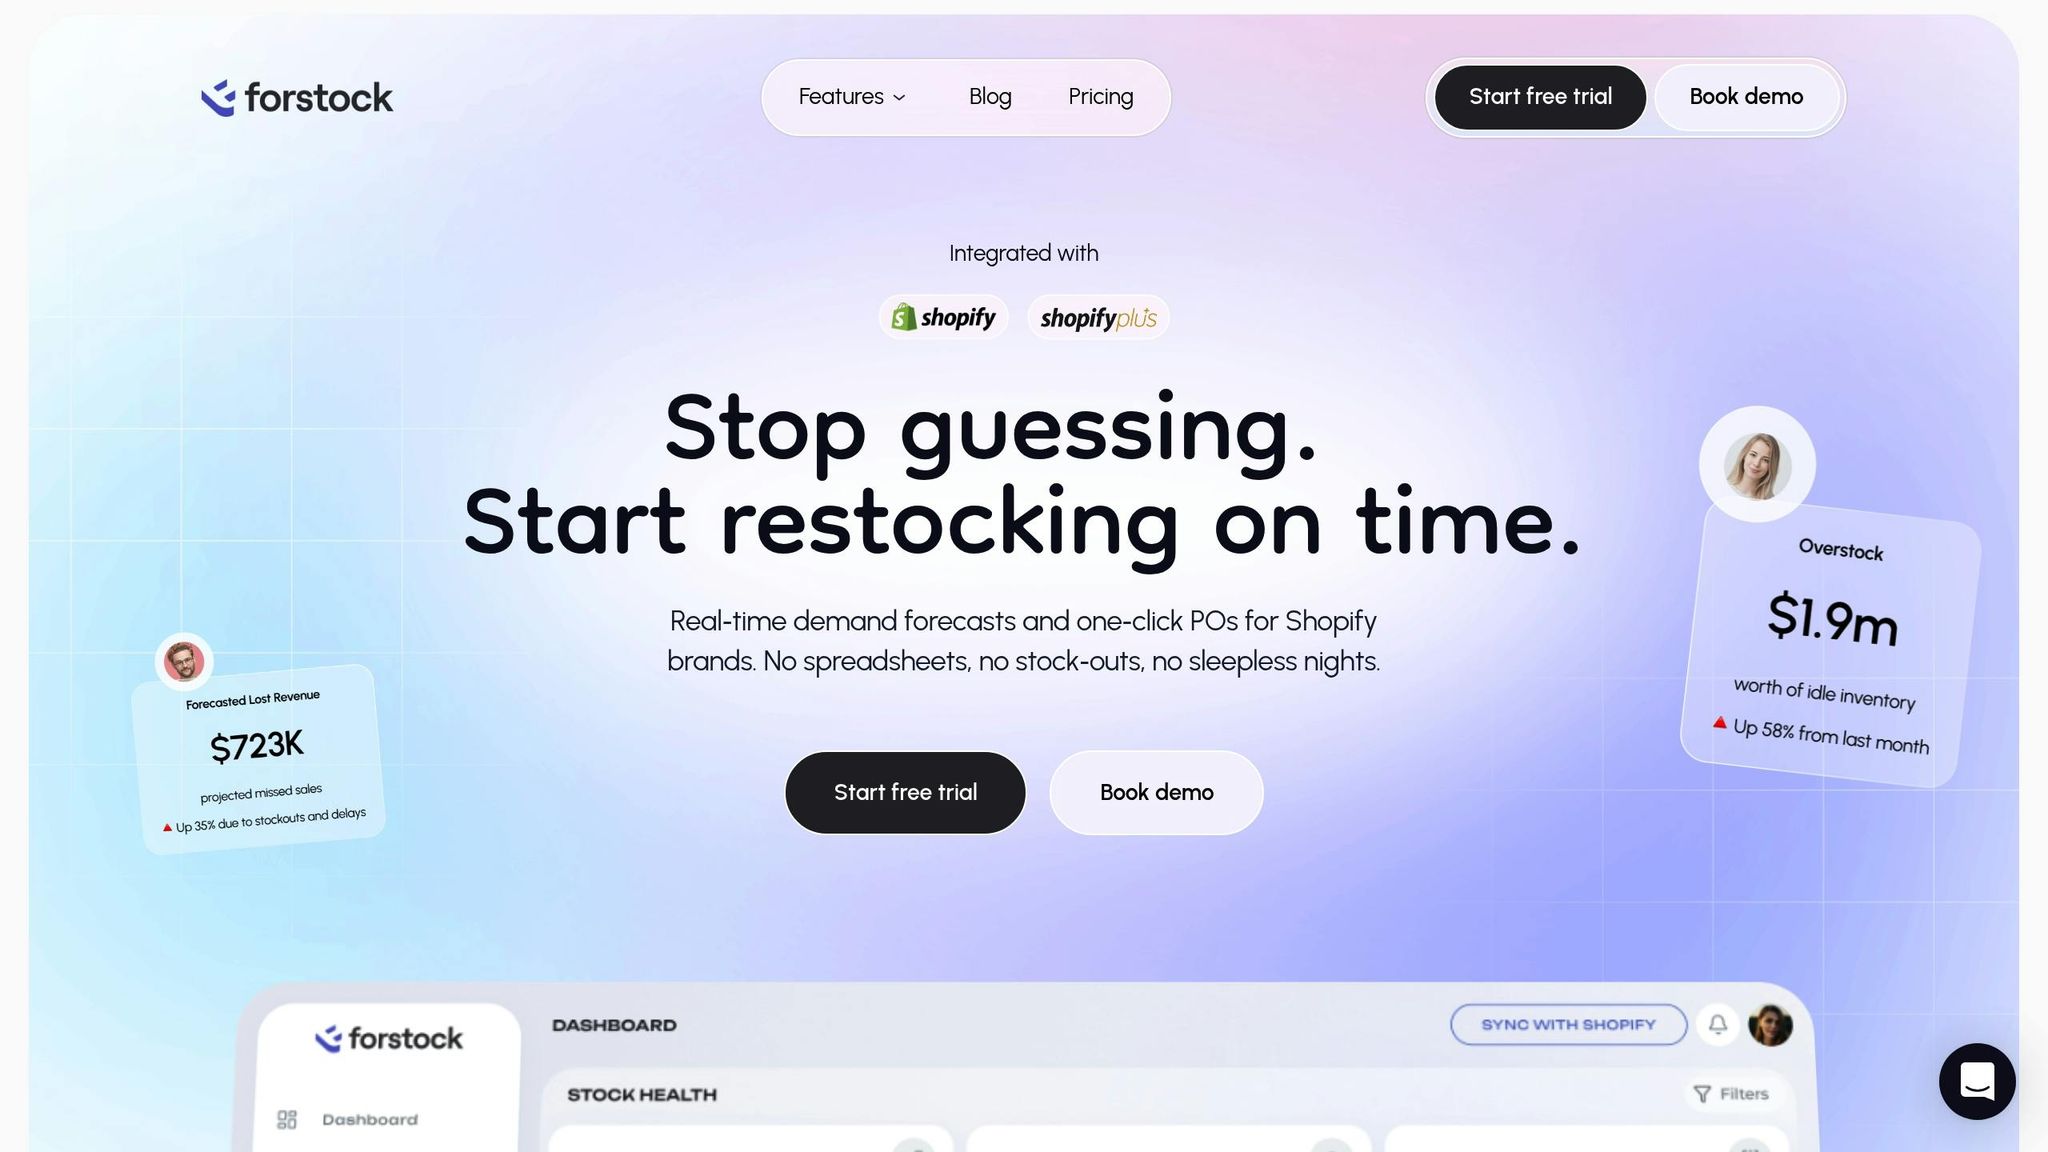
Tracking inventory KPIs manually can be a tedious and error-prone process. That’s where Forstock comes in. This platform consolidates all your inventory metrics in one place, giving you real-time insights into your performance and helping you make data-driven decisions.
Setting Up Forstock Dashboards for KPI Tracking
Forstock simplifies the setup process by importing 12–24 months of historical Shopify sales data. This creates a baseline for KPIs across SKUs, product variants, and warehouse locations. It monitors critical metrics such as inventory turnover, days of supply, stockout percentage, fill rates, and aged inventory.
| Feature | Forstock Capability |
|---|---|
| Data Backfill | Imports up to 24 months of Shopify sales data |
| Forecasting Level | Tracks performance by SKU, variant, and warehouse |
| Key Metrics Tracked | Inventory turnover, days of supply, stockout %, fill rates, aged inventory |
| Automation | Automates reorder triggers and purchase orders based on trends |
| Integration | Fully integrates with Shopify and Shopify Plus |
The unified dashboard allows you to compare current performance against historical trends. For example, if your sell-through rate decreases or your inventory-to-sales ratio exceeds the projected 2025 U.S. average of 1.38, you’ll be able to spot the issue immediately and adjust your purchasing strategy.
Forstock’s AI further enhances these insights, ensuring your operations stay aligned with evolving sales patterns.
Using AI for Continuous Optimization
Forstock’s AI takes your KPI tracking to the next level by analyzing sales trends, seasonality, and lead times. This AI-driven approach can reduce stockouts by 20–50% and holding costs by 15–30%. Whether it’s a seasonal spike or an unexpected surge in demand, the platform adapts to keep your forecasts accurate.
Automated workflows handle the heavy lifting, triggering low-stock alerts and generating purchase orders without manual intervention. You’ll also get proactive recommendations based on real-time data, helping you maintain a low stockout frequency while maximizing your GMROI. All of this happens seamlessly, so you can focus on growing your business instead of constantly monitoring inventory.
Conclusion
Keeping track of inventory KPIs is essential for protecting cash flow, building trust with customers, and staying adaptable. Businesses using real-time performance data see 22% greater efficiency and are 17% better at managing risk. Understanding your inventory performance allows you to adjust quickly when needed.
"Inventory is where promises meet reality. For Shopify-first merchants... the moment a customer clicks buy they are not just buying a product, they are buying a promise." - CommerceBlitz
This perspective underscores the importance of efficient, real-time inventory management.
Forstock simplifies inventory management by centralizing key metrics like inventory turnover and GMROI into one dashboard, enabling smarter, data-driven decisions. Its AI-powered forecasting tailors recommendations to your sales trends, helping you keep optimal stock levels. This prevents overstocking, which ties up capital, and stockouts, which can drive customers away.
Set performance benchmarks for critical indicators like DSI and stockout frequency, and review these metrics weekly or biweekly. This proactive approach helps spot potential issues before they escalate. Use ABC analysis to focus on your top revenue-generating products. Tracking these KPIs equips Shopify brands with actionable insights to fine-tune inventory management and boost profitability.
Brands that consistently monitor inventory KPIs don’t just stay afloat - they grow. With carrying costs making up 20% to 30% of total inventory value, even small efficiency gains can significantly impact your bottom line. By leveraging these metrics, Shopify brands can tap into advanced analytics and drive long-term success.
FAQs
What are the top 3 inventory KPIs to track first?
To get a handle on inventory management, focus on monitoring these three key metrics:
- Inventory turnover rate: This shows how frequently your inventory is sold and replenished, giving insight into sales efficiency and stock movement.
- Stockout rate: This metric reveals how often items run out of stock, helping you identify gaps in supply and demand.
- Carrying costs: These are the expenses tied to storing and maintaining inventory, including warehousing, insurance, and depreciation.
By keeping an eye on these numbers, you’ll have a solid starting point for streamlining inventory processes and boosting efficiency.
How often should I review inventory KPIs for my Shopify store?
To keep your inventory management running smoothly, it's important to review your inventory KPIs on a regular basis - whether that's weekly or monthly. Regular check-ins allow you to spot trends, prevent stockouts, and cut down on overstock. This way, your store can operate more efficiently and meet customer demands without unnecessary hiccups.
What benchmark targets should I use for DSI, accuracy, and turnover?
Efficient inventory management often revolves around key metrics. A Days Sales of Inventory (DSI) between 40 and 80 days is considered optimal. Additionally, maintaining an accuracy rate above 92% ensures reliable tracking and minimizes errors. Lastly, an inventory turnover rate of 5 to 10 times per year reflects a healthy balance between stock levels and sales. These benchmarks are aligned with industry standards and support smooth operations.
Keep reading
Try Forstock free for 14 days.
AI-powered demand forecasting and reorder automation for Shopify brands. No credit card required.