
How to Use Your Email List and Ad Data to Size Your First Inventory Order
Base your first inventory buy on email and ad-derived demand, then adjust for MOQ, lead time, safety stock, and cash.
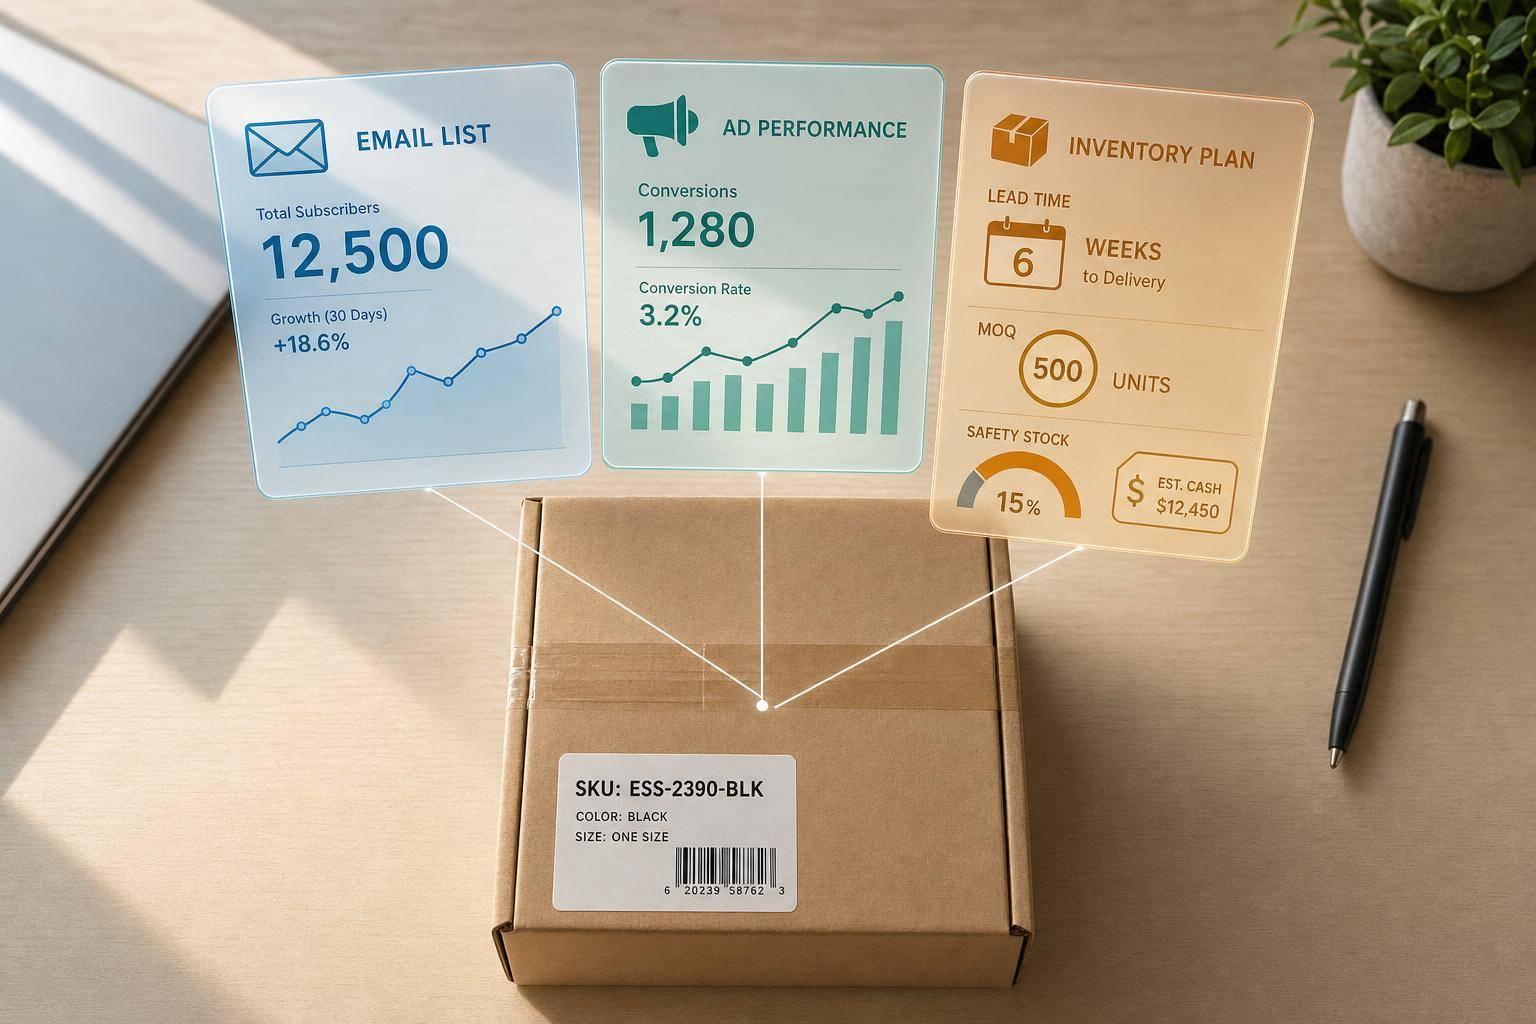
How to Use Your Email List and Ad Data to Size Your First Inventory Order
Your first inventory order should come from simple math, not a guess. I’d start with projected demand from my email list, add projected demand from paid ads, remove overlap, then check that number against MOQ, lead time, safety stock, and cash.
Here’s the short version:
- Email list demand: Estimate opens, clicks, orders, and units from your prelaunch list.
- Paid ad demand: Use CTR, CPC, CPL, spend, and site conversion rate to turn traffic or leads into projected units.
- Three scenarios: Run conservative, base, and optimistic cases because small shifts in rates can change demand fast.
- Supplier limits: Adjust for MOQ, case packs, and lead time before you place the order.
- Inventory buffer: Add safety stock, often around 20%, and more if your lead time is long.
- Reorder planning: Set a reorder point before launch so you know when to buy again.
A few numbers from the article make the point fast:
- Warm email or waitlist segments may convert at 5% to 10%+
- Broader email lists often land closer to 1% to 3%
- Cold paid leads may convert around 0.5% to 1%
- Cold traffic site conversion can be about 1% to 2%
- A $5,000 ad budget at $2.50 CPC can drive 2,000 clicks
- At a 2.0% site conversion rate and 1.5 units per order, that’s about 60 units
If I were sizing a first order, I’d treat email as the floor, ads as the upside, and cash flow as the final check. That keeps the buy grounded in data without pretending the forecast is perfect.
| Input | What I’d use it for |
|---|---|
| Email subscribers + segments | Estimate warm launch demand |
| Open rate + click rate | Judge list activity |
| CPC / CPL / CTR + spend | Project traffic or leads from ads |
| Site conversion + units per order | Turn visits into unit demand |
| MOQ + lead time + case packs | Turn demand into a supplier-ready order |
| Cash on hand | Make sure the buy fits the budget |
Bottom line: I’d build a base-case forecast first, pressure-test it with a low and high case, then place an order that covers expected demand during lead time plus buffer stock.
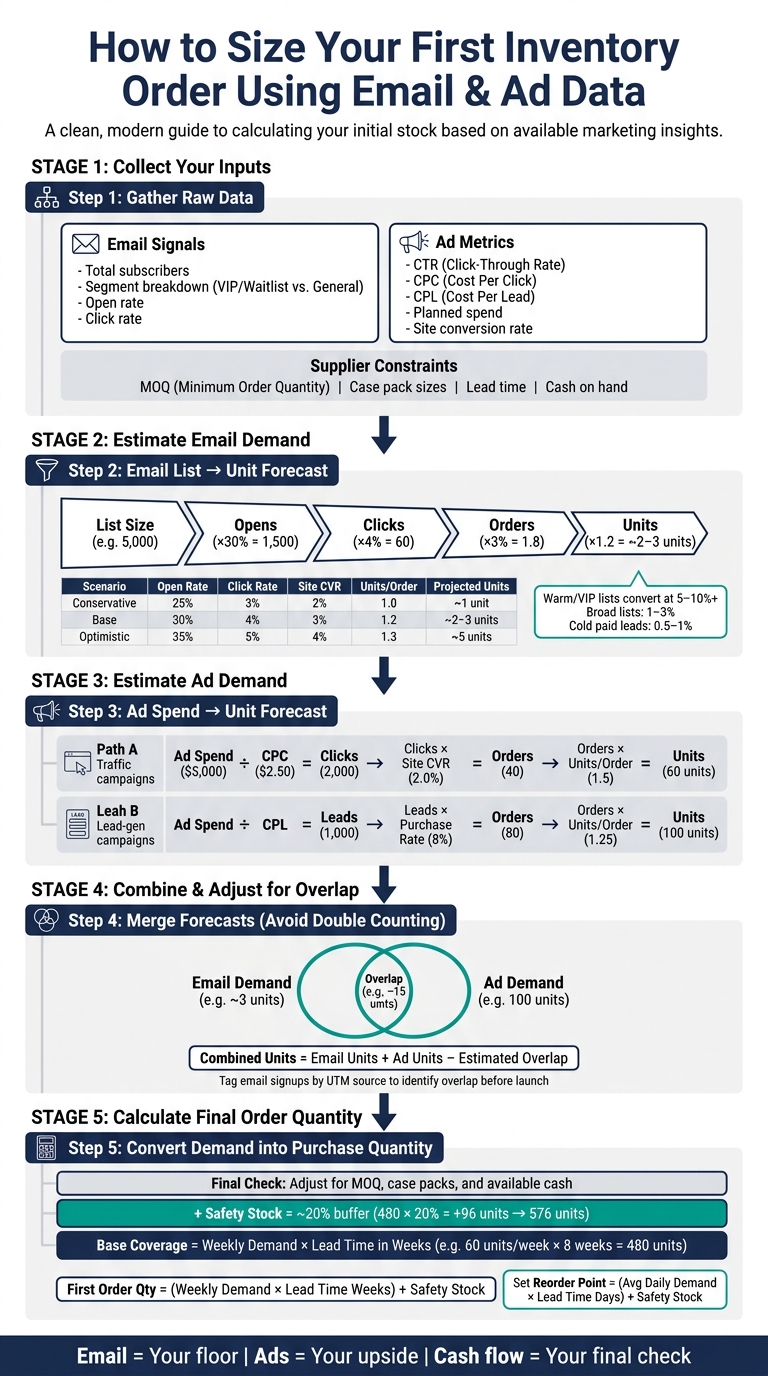
How to Size Your First Inventory Order: Email + Ad Data Formula
1. Collect the inputs you need before estimating demand
Start with the raw numbers. If you're missing inputs, the forecast gets weaker fast.
| Input Category | Inputs to collect |
|---|---|
| Email signals | Total subscribers, signup sources, segment breakdown (general vs. VIP/waitlist) |
| Ad metrics | CTR, CPC, CPL, planned spend by campaign |
| Conversion assumptions | Expected site conversion rate, average units per order |
| Supplier constraints | MOQ, case pack sizes, lead time in days or weeks |
| Timing | Planned launch window (e.g., first 4–8 weeks) |
Email list signals to pull from your prelaunch campaign
Subscriber count is just the first layer. You also need to split the list by source and buyer intent. A VIP or waitlist group often converts at 5–10%+ during launch, while a broader list usually falls closer to 1–3%. Warm site leads tend to convert at about 1–2%. Cold paid leads are often lower, around 0.5–1%.
That gap matters. A list of 5,000 people can mean very different sales numbers depending on who joined, how they joined, and how much intent they showed.
It also helps to check teaser-email open and click rates. If those numbers are soft, the list may not be as active as it looks on paper.
Once you’ve sorted these segments, you can turn them into unit assumptions for launch.
Ad metrics you can translate into unit demand
Pull CTR, CPC, CPL, and planned spend for each campaign. These numbers give you a simple way to move from budget to likely unit demand.
For lead-gen campaigns, estimate leads with:
planned spend ÷ CPL
Then apply your expected launch purchase rate to those leads.
For direct-traffic campaigns, use CPC to estimate clicks from planned spend, then apply your site conversion rate to estimate orders. For new DTC brands, a cautious benchmark is 1–2% for cold traffic and 3–5% for warm email traffic.
Put another way: ad spend tells you how much traffic or how many leads you can buy, and conversion rate tells you how many of those people may turn into orders.
Shopify and supplier constraints that affect your final order size

Before you run the numbers, enable inventory tracking for every product variant in Shopify. Don’t stop at total units. Demand needs to be mapped at the variant level.
This is where things get a little messy in the real world. MOQ and case pack sizes force rounding, and that rounding stacks up across variants. A forecast might point to one number, but supplier rules can push your order higher or lower.
Your final order size is shaped by:
- Lead time
- MOQ
- Case pack sizes
- Cash on hand
Those limits matter just as much as the demand model. Once you’ve pulled these inputs together, you can start turning email subscribers into projected unit demand.
sbb-itb-f0fc809
2. Estimate launch units from your email list
A simple formula for turning email subscribers into unit demand
Start with your subscriber list. Then work down the funnel until you reach orders and units.
Each step trims the audience a bit more:
- Projected opens = list size × open rate
- Projected clicks = opens × click rate
- Projected orders = clicks × site conversion rate
- Projected units = orders × units per order
List size is the number of subscribers who get your launch email. Open rate is the share who open it. Click rate is the share of openers who click. Site conversion rate is the share of visitors who buy. Units per order turns order count into stock need. That last piece matters more than it may seem. Someone buying a 3-pack changes your inventory picture a lot more than someone buying one item.
For planning, use benchmark assumptions of 1% to 3% site conversion, anchored by the 2.06% U.S. average, and 1.0 to 1.3 units per order for a single-item launch.
Build conservative, base, and optimistic demand scenarios
One forecast can make you feel more certain than you should. A better move is to run three versions: conservative, base, and optimistic.
Small shifts in the inputs can change the outcome a lot. If open rate moves from 25% to 35%, click rate from 3% to 5%, and conversion from 2% to 4%, your final order estimate can more than double even when list size doesn't change.
Use the conservative case as your minimum order floor. Use the base case for the main purchase call. Keep the optimistic case handy in case launch week comes in hotter than expected and you need to reorder fast.
Example: converting a 5,000-person list into a unit estimate
Say a brand launches with 5,000 subscribers, a 30% open rate, a 4% click rate, a 3% site conversion rate, and 1.2 units per order.
Here’s how the math plays out:
5,000 × 0.30 = 1,500 opens → 1,500 × 0.04 = 60 clicks → 60 × 0.03 = 1.8 orders → 1.8 × 1.2 = 2.16 units
That comes out to roughly 2 to 3 units from the email list alone.
That number may feel low, but that's the point: a single send rarely covers total launch demand. If you plan to send more than one email, run the formula for each send or add up the traffic you expect from all of them. Then, over a 30- to 90-day window, divide total projected units by the number of weeks in your planning period. That gives you a weekly demand figure you can use for reorder timing.
The table below shows how the same 5,000-person list can lead to very different unit estimates.
| Scenario | Open Rate | Click Rate | Site Conversion | Units/Order | Projected Units (single send) |
|---|---|---|---|---|---|
| Conservative | 25% | 3% | 2% | 1.0 | ≈ 1 |
| Base | 30% | 4% | 3% | 1.2 | ≈ 2–3 |
| Optimistic | 35% | 5% | 4% | 1.3 | ≈ 5 |
Use this email forecast as your floor, then layer in paid ad demand.
3. Estimate launch units from paid ads and combine both channels
Convert ad spend or traffic data into orders and units
Once you've set your email floor, paid ads help you estimate the upside. They add to your email forecast. They don't replace it.
The math is simple:
- Projected clicks = Ad spend ÷ CPC
- Projected orders = Projected clicks × site conversion rate
- Projected units = Projected orders × units per order
If you're starting with impressions instead of spend, estimate clicks first:
Clicks = Impressions × CTR
Then move from clicks to orders and units.
Here's a simple example. A $5,000 ad budget with a $2.50 CPC gives you 2,000 clicks. If your site conversion rate is 2.0%, that turns into 40 orders. If customers buy 1.5 units per order, your forecast comes to 60 units.
Lead-gen campaigns work a bit differently. Start with leads, then estimate how many of those leads will buy during the launch window. For example, if a campaign brings in 1,000 leads and 8% are expected to purchase, that gives you 80 orders. At 1.25 units per order, the forecast becomes 100 units.
Treat leads as warm interest, not as direct demand. For cold prelaunch traffic, a cautious 1% to 3% lead-to-purchase rate is a safer place to start.
For paid social, use benchmark ranges for CTR, CPC, and conversion rate to shape your scenarios. Put your conservative case at the low end, your base case around the middle, and your optimistic case near the high end.
How to combine email and ad forecasts without double counting
This is where forecasts often get sloppy.
Someone who clicked an ad last week might also be on your email list. If you count that person in both places, your demand estimate gets padded.
A cleaner approach is to break demand into three buckets:
- Direct email demand
- Direct paid-traffic demand
- Overlap
That overlap is the adjustment most brands skip.
Before launch, the easiest way to sort this out is to tag email signups by source with UTM parameters. That helps you see how much of your list came from paid campaigns and how much came from organic traffic.
If you can't separate the overlap cleanly, use a blended forecast. Add your email units and ad units, then trim the total with a small overlap factor. Your first purchase order should be based on that adjusted figure, not the raw total.
Combined forecast units = Direct email units + Direct ad units − Estimated overlap
When lead times are long or your ad data is still thin, use the low end of your combined range as the anchor for your buy. That adjusted total should feed into your purchase quantity.
Email demand vs. ad demand: a side-by-side comparison for first-order planning
For planning, email-to-purchase assumptions often land around 1% to 3%, while traffic-campaign conversion rates tend to be about 1.5% to 2.8%.
| Signal | Email Demand | Ad Demand |
|---|---|---|
| Reliability | Higher - audience already opted in | Lower - cold traffic behavior is harder to predict |
| Speed | Slower to build; depends on list size | Faster - you can scale spend to generate traffic fast |
| Cost visibility | Lower - the cost sits in list-building effort | Higher - spend, CPC, and CPL are directly measurable |
| Volatility | Lower - engagement rates are relatively stable | Higher - results shift with creative, audience, and auction changes |
| Best for | Gauging warm, existing demand | Estimating upside and testing how fast the market can expand |
| Common forecasting inputs | List size, open rate, click rate, purchase rate | Ad spend, CPC, CTR, site CVR, CPL, lead-to-purchase rate |
| Typical conversion assumption | 1%–3% email-to-purchase | 1.5%–2.8% site CVR for traffic campaigns |
Email gives you the base. Ads show how far you might push beyond it. Used together, they give you a tighter launch demand range.
4. Convert your demand estimate into a purchase quantity
Calculate weekly demand, lead time demand, and safety stock
Start with your base-case unit forecast, then turn it into inventory coverage. The goal is simple: take your combined email-and-ad unit forecast and convert it into an order quantity using weekly demand, lead time, and safety stock.
Divide total projected units by the number of weeks in your launch window to get weekly demand. For example, 240 units over 4 weeks equals 60 units per week. If your lead time is 8 weeks, your base coverage is 480 units.
Next, add safety stock. A 20% buffer takes 480 units to 576 before MOQ and cash changes. If the launch feels less certain, use a larger lead-time buffer in the 50%–70% range.
First order quantity = (weekly demand × lead time in weeks) + safety stock
After that, check the number against MOQ and landed cost.
Adjust the order quantity for MOQ, available cash, and reorder timing
This is where the math meets reality. In many cases, MOQ and available cash decide the final order size.
Use landed cost, not just unit cost. That means you should include:
- Freight
- Duties
- Customs
- Packaging
- Labeling
- Prep
- Receiving
If the MOQ would eat up too much of your launch budget, a smaller first order can lower cash risk, even if it gives you a shorter inventory window.
Full-coverage order vs. smaller test order: a side-by-side comparison
This comparison helps you pick between a full first order and a smaller test buy. A bigger order cuts stockout risk, but it locks up more cash. A smaller order protects cash, but you'll need to reorder sooner.
| Factor | Full-Coverage Order | Smaller Test Order |
|---|---|---|
| Cash impact | Higher upfront - covers the entire initial coverage period plus safety stock | Lower upfront - covers a shorter period and frees cash for the reorder |
| Stockout risk | Lower - buffer absorbs demand spikes and lead-time delays | Higher - a demand surge or supplier delay can wipe out stock before replenishment arrives |
| Excess inventory risk | Higher - if demand underperforms, you're left holding more units | Lower - less exposure if the launch doesn't hit base-case projections |
| Best when | Forecast confidence is high, lead times are long, or stockouts are especially costly | Forecast confidence is low, lead times support a fast reorder, or launch budget is limited |
| Reorder effort | Lower - fewer decisions during launch | Higher - requires a clear reorder trigger and close inventory monitoring |
Set your reorder point before launch. Use this formula: reorder point = (average daily demand × lead time in days) + safety stock. That number becomes the trigger for your first replenishment.
Conclusion: Start with simple assumptions, then refine the plan once sales begin
Start with the base case. Then adjust it for lead time, cash on hand, and MOQ. That final figure is your first order quantity, based on the data you have right now.
If demand at launch feels uncertain, a smaller test order can protect your cash and help you get actual sales data sooner. That’s often a smart move when you’d rather learn from the market than bet too much up front.
Once orders start coming in, stop treating the plan like a fixed guess and start treating it like a working model. Compare actual sales against your conservative, base, and optimistic scenarios every week for the first four weeks. Then update your purchase rate, conversion rate, and units per order using what customers are actually doing.
Those first four weeks are where the picture gets clearer. Use them to turn your first order into a sharper reorder plan.
FAQs
How far ahead should I place my first inventory order?
Place your first inventory order early enough to cover the full lead time from purchase order to sellable stock. That means more than just supplier production time. You also need to account for processing, receiving, QC, and a buffer in case something slips.
For new SKUs, a safe place to start is a 7–14 day inventory buffer, or about 3–5 days as a fixed buffer. If you work with domestic suppliers, start with around 5–7 days of stock. If you rely on overseas ocean freight, plan for 14–21 days.
One more thing: use your actual lead times, not the supplier’s quoted timeline. Quotes are a starting point. What matters is how long it takes in practice for inventory to become sellable.
What if my email list is small or mostly cold traffic?
If most people on your email list are cold traffic, don't use that list as your main demand signal. It's a shaky read.
A better move is to use a proxy model. Find a similar product in your catalog with a close price point, the same general category, and a similar audience. Then use that product's early sales data as the template for your forecast.
From there, adjust your unit estimate based on search patterns, social media trend lines, and your planned ad spend. Start with a conservative safety stock buffer too, such as a 7- to 14-day supply, until you have your own sales data coming in.
Should I order by total units or by variant?
Order by variant, not just total units. A black medium shirt and a red small shirt might look like the same product on paper, but they often move at very different speeds. If you lump them together, your forecast gets messy fast, and that can leave you overstocked on one version and short on another.
Planning at the variant level helps you set reorder points and safety stock based on each item’s sales velocity and lead time. To make that work, each variant should have its own SKU and its own supplier link.
Keep reading
Try Forstock free for 14 days.
AI-powered demand forecasting and reorder automation for Shopify brands. No credit card required.