
The Three-Scenario Forecast: A Simple Model for First-Year CPG Brands
Plan base, upside, and downside demand paths to size first buys, reorder points, safety stock, and cash needs for new CPG launches.

The Three-Scenario Forecast: A Simple Model for First-Year CPG Brands
If you’re launching a new CPG brand, one forecast number is not enough. I’d plan three paths instead: base, upside, and downside. That gives me a better way to decide my first buy, reorder timing, safety stock, and cash needs before sales data starts to come in.
Here’s the short version:
- New products miss plan all the time. First-six-month forecast accuracy can land around 50% to 70%, and many new SKUs drop out within 1 to 2 years.
- A three-scenario model helps me plan for range, not one guess.
- I’d build each case from a few inputs: price, landed cost, starting inventory, MOQ, lead time, launch velocity, repeat rate, promo lift, and channel mix.
- Then I’d turn each case into four decisions:
- How much to buy first
- When to reorder
- How much buffer stock to hold
- How much cash each PO will use
- After launch, I’d review the model every week and flag any SKU running 20% above or below the base case.
A simple example shows why this matters. If demand comes in at 150 units/week instead of 350 units/week, the same opening order can either leave me short on stock or stuck with months of unsold product. And if my MOQ is 5,000 units at $6.20 each, every reorder starts with a $31,000 cash decision.
Here’s the core idea in one glance:
| Scenario | What it means | Main risk | Main action |
|---|---|---|---|
| Base | Sales track close to plan | Missing in either direction | Use for launch plan |
| Upside | Velocity or repeat comes in higher | Stockout and earlier cash need | Reorder sooner |
| Downside | Sell-through is slower than expected | Cash tied up in extra inventory | Keep first buy tighter |
So if I had to sum it up in one line: I’d use three demand paths to make better inventory and cash calls in year one, then update the model weekly as actual sales replaces guesswork.
The Art & Science of Inventory Forecasting for CPG Founders | Webinar
sbb-itb-f0fc809
Choose your inputs before building the scenarios
Before you build scenarios, sort your inputs into two buckets: fixed inputs and assumptions. Fixed inputs set the guardrails. Assumptions are the parts you’ll revise after launch. Those numbers shape your base, upside, and downside cases.
Required inputs: price, starting inventory, lead time, and MOQ
These four inputs set the bounds for all three scenarios.
Selling price includes your MSRP and, if it applies, your wholesale price. Pair selling price with your fully landed unit cost to estimate margin and how much cash gets tied up in each unit.
Starting inventory limits how much you can sell early on. MOQ sets the minimum size of a reorder. Lead time tells you when that reorder has to happen. Put those together, and you get a much clearer picture of cash timing.
For example, if your co-manufacturer requires 5,000 units at $6.20 each, every replenishment call begins with a $31,000 cash commitment. That’s not a small detail. MOQ and lead time tell you both when the next cash outlay hits and how big it will be.
Demand assumptions: launch velocity, repeat rate, promotions, and channel mix
Once the fixed inputs are in place, model the drivers that can swing from week to week. The point isn’t to guess the future with perfect accuracy. It’s to build a baseline you can adjust without a lot of friction.
Launch velocity is your expected sell-through by channel: per store per week, per account per week, or per day or week online. For a mid-priced shelf-stable snack, a fair starting point is about 4–8 units per store per week. A premium niche item may sit closer to 1–3.
Repeat rate shows how many first-time buyers come back, and how soon. For a daily-use consumable, you might assume 30% reorder within 30 days and another 20% within 60 days. Start with category norms, then swap in your own cohort data as it comes in.
Promotional lifts should be treated as short-term multipliers, not a new normal. A retailer temporary price reduction might drive a 30%–40% lift over baseline for that week. A feature-and-display event can hit 60%–120%. Keep these events separate on your calendar so they don’t distort your core demand picture.
Channel mix affects margin, fulfillment cost, and how you divide inventory. A DTC-first brand may plan for 60% of units through Shopify, 20% through marketplaces, and 20% through wholesale. A broker-led retail launch may look very different, with 70% going through brick-and-mortar.
Planning inputs checklist
Use this checklist to separate fixed numbers from the ones you’ll update each week after launch.
| Input | Category | Review Frequency |
|---|---|---|
| MSRP and wholesale price (USD) | Fixed | Monthly or seasonal |
| Fully landed unit cost (USD) | Fixed | Per shipment |
| Starting inventory (units by SKU) | Current state | Weekly |
| Supplier MOQ (units and USD) | Fixed | Per contract |
| Replenishment lead time (days) | Fixed | Monthly |
| Launch velocity (units/week by channel) | Assumption | Weekly after launch |
| Repeat rate (% reordering in 30/60/90 days) | Assumption | Weekly after launch |
| Promo lift (% over baseline, by event) | Assumption | Per campaign |
| Channel mix (% DTC / retail / wholesale / marketplace) | Assumption | Monthly |
| Available cash for inventory (USD) | Constraint | Weekly |
How to build the base, upside, and downside forecast
Once price, lead time, MOQ, and demand inputs are set, turn them into three demand paths. Don’t use a flat percentage up or down. Build each case from the actual demand drivers.
That matters for a simple reason: each scenario should explain why demand ends up where it does. When the story makes sense, the model is easier to defend to suppliers and investors. It also gives you a better read on how much inventory to buy.
Base case: the most likely run rate
Your base case is your current plan. It’s the outcome that looks most likely based on what you know right now. Start with the operating plan you expect to happen.
For a new refrigerated beverage brand in 20 local grocery stores and on Shopify, the base case might begin at 160 units per week, then grow to 30 stores by week 5, add repeat purchases in week 6, and include one confirmed demo in week 8. By weeks 9–12, modest merchandising gains lift velocity to 7 units per store per week, which gets you to about 2,000–2,500 units over 12 weeks. Count only promotions that are already confirmed.
Upside case: faster velocity, stronger repeat, or a better channel mix
In the upside case, demand moves faster because one or more drivers outperform the base plan. Maybe velocity ramps sooner, a regional chain adds 50 strong doors, or repeat climbs to 35%–40% within 4–6 weeks.
That can move 12-week demand to 3,600–4,000 units. And this is where the buy decision changes fast. A 3,000-unit first buy could stock out by week 9. With a three-week lead time, you’d need to place a reorder by week 5 or 6. So upside demand creates two pressures at once: you need cash earlier, and your stockout risk goes up at the same time.
Downside case: slower sell-through and weaker follow-on demand
The downside case is meant to test a slower ramp, not a total wipeout. Think of it as the version where things work, just not as well or as fast as planned.
In this case, velocity drops to 4 units per store per week, launch doors open more slowly, repeat lands at 10%–15%, and promos miss the mark. That can pull demand down to 1,200–1,500 units in the first 12 weeks. The inventory math changes in a hurry. If MOQ is 5,000 units at a $2.00 landed cost, you could be sitting on 3,500+ unsold units after three months, plus storage costs and spoilage risk. That downside view helps you decide whether a smaller first run is worth paying a higher unit cost.
Turn each scenario into inventory and cash decisions
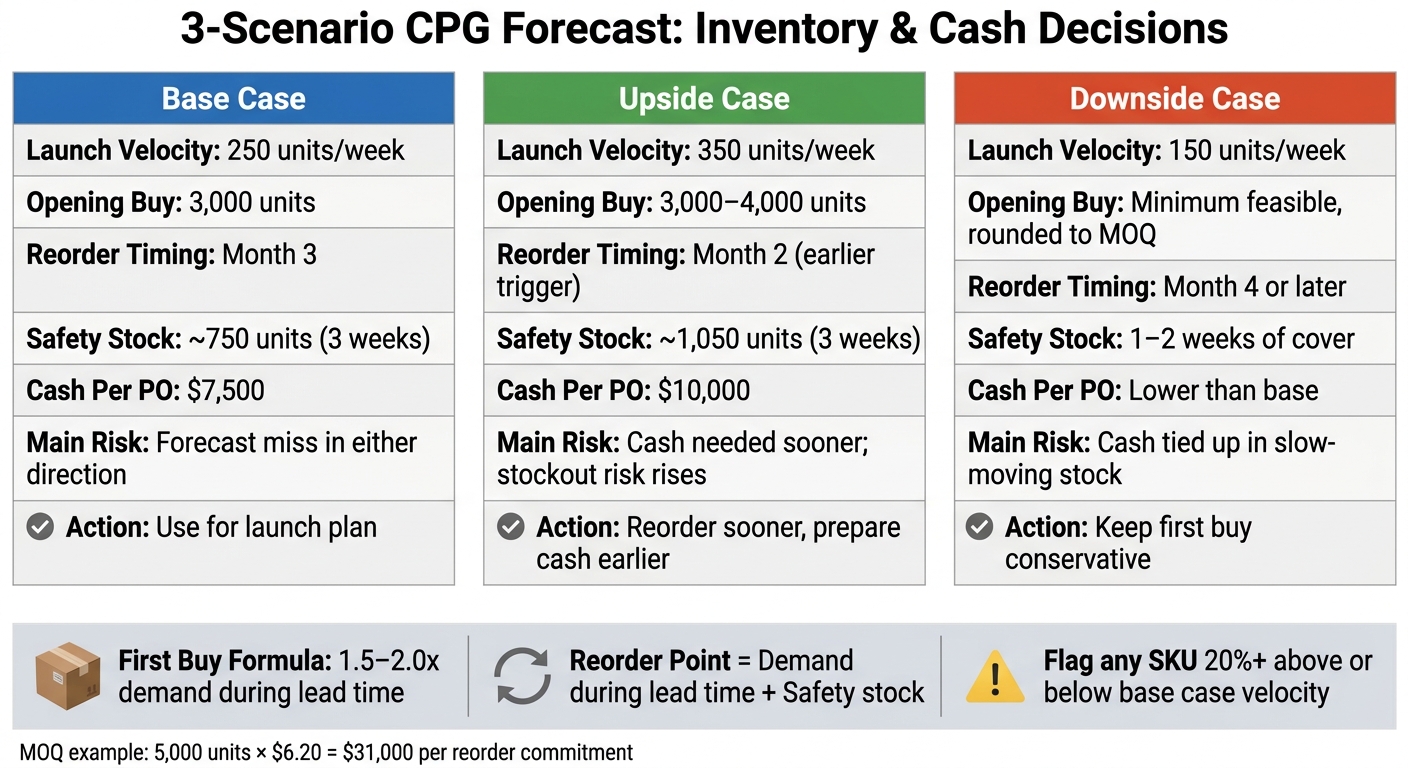
3-Scenario CPG Forecast: Base vs. Upside vs. Downside at a Glance
From forecast to first buy, reorder point, and safety stock
Use each scenario to make three calls: your first order size, your reorder trigger, and how much buffer stock to hold. Put simply, each scenario should help you answer one thing: how many units can you buy to reduce stockouts and save money without squeezing cash too hard?
For the opening order, a good starting point is 1.5–2.0x demand during lead time. Say your base case is 250 units per week and lead time is 8 weeks. That means demand during lead time is 2,000 units. So your first buy would land around 3,000 to 4,000 units. That gives you room for upside and helps fill the channel at launch, rounded to your MOQ.
For the reorder point, use this formula: Reorder Point = demand during lead time + safety stock. A simple way to set safety stock is 2–4 weeks of base-case demand. In this example, that puts the reorder point at about 2,500–3,000 units.
If the upside case starts to happen and sales move up to 350 units per week, update the reorder point to match the new pace. At that rate, 350 × 8 = 2,800 units during lead time, and then you add your buffer on top. If you're producing overseas, use a 4–6 week buffer.
How each scenario changes the cash required
Inventory ties up cash fast. The basic math is simple: Cash tied up = order quantity × landed unit cost.
With a $2.50 landed cost and a 3,000-unit opening buy, your first PO comes to $7,500. If your supplier terms are 30% deposit and 70% on shipment, you need $2,250 when you place the PO and another $5,250 when the goods ship. That money goes out before you’ve sold a single unit.
In the upside scenario, faster sell-through sounds great, but it pulls cash forward. If sales run at 350 units per week, those first 3,000 units last a little over 8 weeks instead of 12. That means you're placing the second PO in month 2, and the next cash need jumps to $10,000 sooner than expected. Sales are moving, but cash still leaves first.
In the downside scenario, the problem flips. At 150 units per week, a 3,000-unit opening buy lasts about 5 months. Your cash sits on the shelf and comes back slowly through sales. That’s why the downside case should guide a more conservative opening order.
Scenario comparison table
| Base Case | Upside Case | Downside Case | |
|---|---|---|---|
| Launch velocity | 250 units/week | 350 units/week | 150 units/week |
| Opening buy quantity | 3,000 units | 3,000–4,000 units | Minimum feasible opening buy, rounded to MOQ |
| Reorder timing | Month 3 | Month 2 (earlier trigger) | Month 4 or later |
| Safety stock target | 3 weeks of cover (~750 units) | 3 weeks of cover (~1,050 units) | 1–2 weeks of cover |
| Cash exposure per PO | $7,500 | $10,000 | Lower than base |
| Main cash risk | Forecast miss in either direction | Cash needed sooner to support velocity | Cash tied up in slow-moving stock |
Use the base case to plan the launch, the upside case to judge how fast you may need to reorder, and the downside case to keep your first buy from getting too heavy on cash.
Review weekly and keep the model current
A weekly review routine after launch
The three-scenario model only helps if you update it every week. After launch, keep using the same three cases to check whether demand is landing above or below plan.
Block off 30–60 minutes each week for the review. Compare actual units sold against all three cases so you can see which scenario the business is moving toward. Then update launch velocity and repeat rate. If you ran a promotion, compare the actual lift with what you assumed and adjust future promo estimates. Also review channel mix. If DTC, wholesale, or a retailer is beating plan, update the mix so inventory cover matches where demand is coming from.
Flag any SKU that is more than 20% above or below base case velocity. That’s the point where you should revisit the reorder point and safety stock before the issue turns into stockouts or overstock.
When a spreadsheet is no longer enough
A spreadsheet is fine when you have one or two SKUs, one channel, and one supplier. But once SKU count grows, channels stack up, or purchase orders start overlapping, the weekly file-matching work can turn into a drag. If those updates are taking too much time by hand, move the model into a connected workflow.
A connected workflow can tie forecasting, replenishment, purchase orders, and inventory monitoring together, so changes in velocity feed into reorder alerts and cash needs automatically.
Key takeaways
Three things make first-year CPG forecasting work:
- Use three scenarios instead of one number
- Tie each scenario to a clear inventory and cash action
- Update the model every week as actual sales data replaces assumptions
Start with a small group of inputs: velocity, repeat rate, lead time, MOQ, and channel mix. Then sharpen the model over time. The forecast doesn’t need to be perfect at launch. It needs to get better every week.
FAQs
How do I choose realistic base, upside, and downside assumptions?
Start with historical sales data as your base case. Then build your upside and downside cases around planned promotions, seasonal swings, and any likely supply chain changes.
The key is to tie every assumption to actual numbers. Use current sales velocity, real supplier lead times, and safety stock levels instead of rough guesses. That keeps your forecast grounded.
If you don't have much history, use proxy data from similar products or market benchmarks. It’s not perfect, but it’s a lot better than flying blind. Then, as real-time sales data starts coming in, update each scenario on a regular basis so your forecast stays close to what’s happening on the ground.
What should I do if my MOQ is higher than my downside forecast supports?
If your minimum order quantity (MOQ) is higher than your downside forecast, weigh two risks: ending up with too much inventory or running out of stock.
Start by working on supplier terms. For example, ask for net-60 instead of net-30, or request split shipments so inventory lands closer to when you’ll sell it. That can make cash flow a lot easier to manage.
If cash is tight, put your money into the products with the best margins or the ones that sell fastest. And if you have to buy the full MOQ, don’t leave the extra units to chance. Go in with a plan to move them through markdowns or marketing.
When should I switch from a spreadsheet to a more automated workflow?
Switch when forecasting stops being a one-time setup and turns into a weekly chore. The same goes if you're spending more than about 5 hours a week fixing inventory gaps and updating data.
It also makes sense to switch when demand shifts faster than your spreadsheet can keep up. If you're managing more SKUs, selling across multiple channels, and need faster scenario generation plus real-time updates, a spreadsheet usually starts to show its limits.
Keep reading
Try Forstock free for 14 days.
AI-powered demand forecasting and reorder automation for Shopify brands. No credit card required.