
How to Forecast Demand for a New Product With No Sales History
Build a 13-week launch forecast using analogs, preorders, channel splits, and scenario planning to size your first buy.

How to Forecast Demand for a New Product With No Sales History
No sales history doesn’t mean no forecast. If I’m launching a new product, I can still build a usable demand plan by combining similar product data, pre-launch signals, channel splits, and simple scenario planning.
Here’s the short version:
- I start with 3 to 5 close product analogs
- I build a 13-week forecast, not a full-year guess
- I check that forecast against a top-down market-size estimate
- I add preorders, waitlists, and traffic to tighten the numbers
- I turn unit demand into a first-buy plan, using lead-time demand, reorder points, and 1 to 2 weeks of safety stock
- I pressure-test the plan with conservative, base, and upside cases
- Then I update the forecast after week one and keep revising it
A few numbers matter right away. New products often see around 64% forecast error, which is why early safety stock matters. And for most launches, a first order of base case + 20% to 30% buffer is a sensible middle ground between stockout risk and tying up too much cash.
If I had to sum up the whole process in one line, it would be this: use analogs to make the first call, then let live demand take over as soon as possible.
Before I place the first PO, I want answers to these four questions:
- What could this SKU sell in the first 13 weeks?
- How should I split units across DTC, wholesale, Amazon, or retail?
- How much stock do I need to cover lead time and uncertainty?
- What happens if demand comes in below plan or above plan?
That’s the frame for the article: build a baseline, tighten it with launch signals, convert it into inventory decisions, and keep adjusting once the product is live.
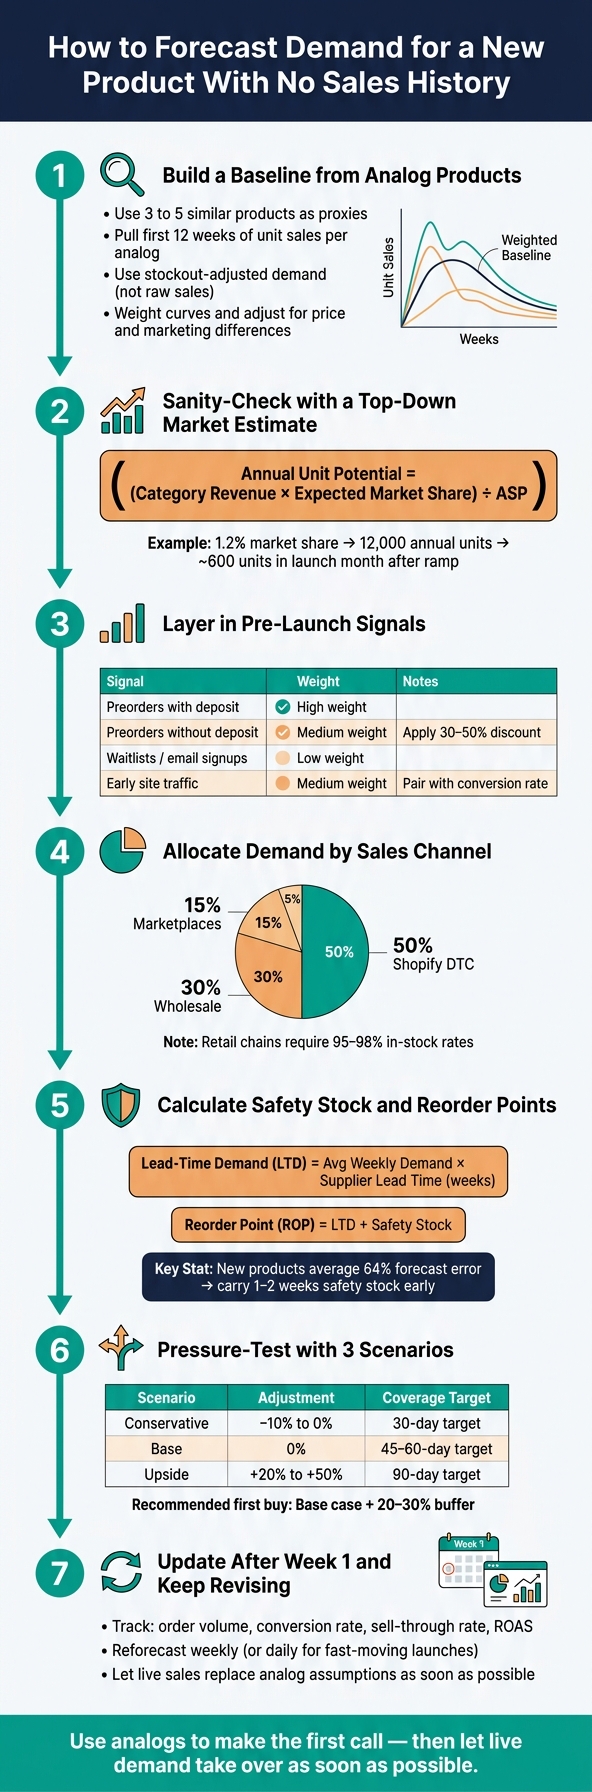
How to Forecast Demand for a New Product: 7-Step Framework
How to Forecast New Products
sbb-itb-f0fc809
Step 1: Build a baseline forecast from similar products and market size
With no sales history, you need a stand-in. The best place to start is a small group of products that already sell in your market and look a lot like what you're about to launch.
Use 3 to 5 similar products as proxies for sales history
Choose analog products based on category, price range, customer type, and seasonality. Put more weight on the closest match. A different colorway of the same model is a much better proxy than a product that only shares a broad price band.
Pull the first 12 weeks of unit sales for each analog and line them up from week 1. That way, you're comparing ramp curves, not calendar timing. One fix matters here: use stockout-adjusted demand, not raw sales. Raw sales can fall to zero when inventory runs out, and that can make past demand look weaker than it was.
As you compare analogs, split base demand from trend, seasonality, and promo lift. This helps you see which part of the curve can carry over to the new launch. Then weight the curves, average the weekly unit sales, and adjust for any material differences between the analogs and your new SKU, especially price and marketing spend. If the new SKU launches with 2x the ad budget of your closest analog, move the baseline units up to reflect that.
Check the baseline against a top-down demand estimate
After you build a bottom-up estimate from analogs, sanity-check it with a simple top-down model. The formula is:
Annual unit potential = (Category revenue × Expected market share) ÷ Average selling price (ASP)
Then apply a ramp curve so the annual figure matches your launch window. Demand rarely shows up in a flat line. It builds as awareness grows and distribution opens up. For example, a base-case market share of 1.2% might suggest 12,000 annual units, but only about 600 in the first launch month after you apply a realistic ramp.
If the analog forecast and the top-down estimate land in the same range, that's a solid starting point. If the gap is big, dig into what's causing it. Maybe your marketing budget is much higher. Maybe there's a wholesale commitment the analog model didn't include. Those are common reasons to move the number up. From there, use the baseline as your starting point and tighten it with early launch signals.
Use Forstock to bring inputs together and reconcile top-down and SKU-level plans
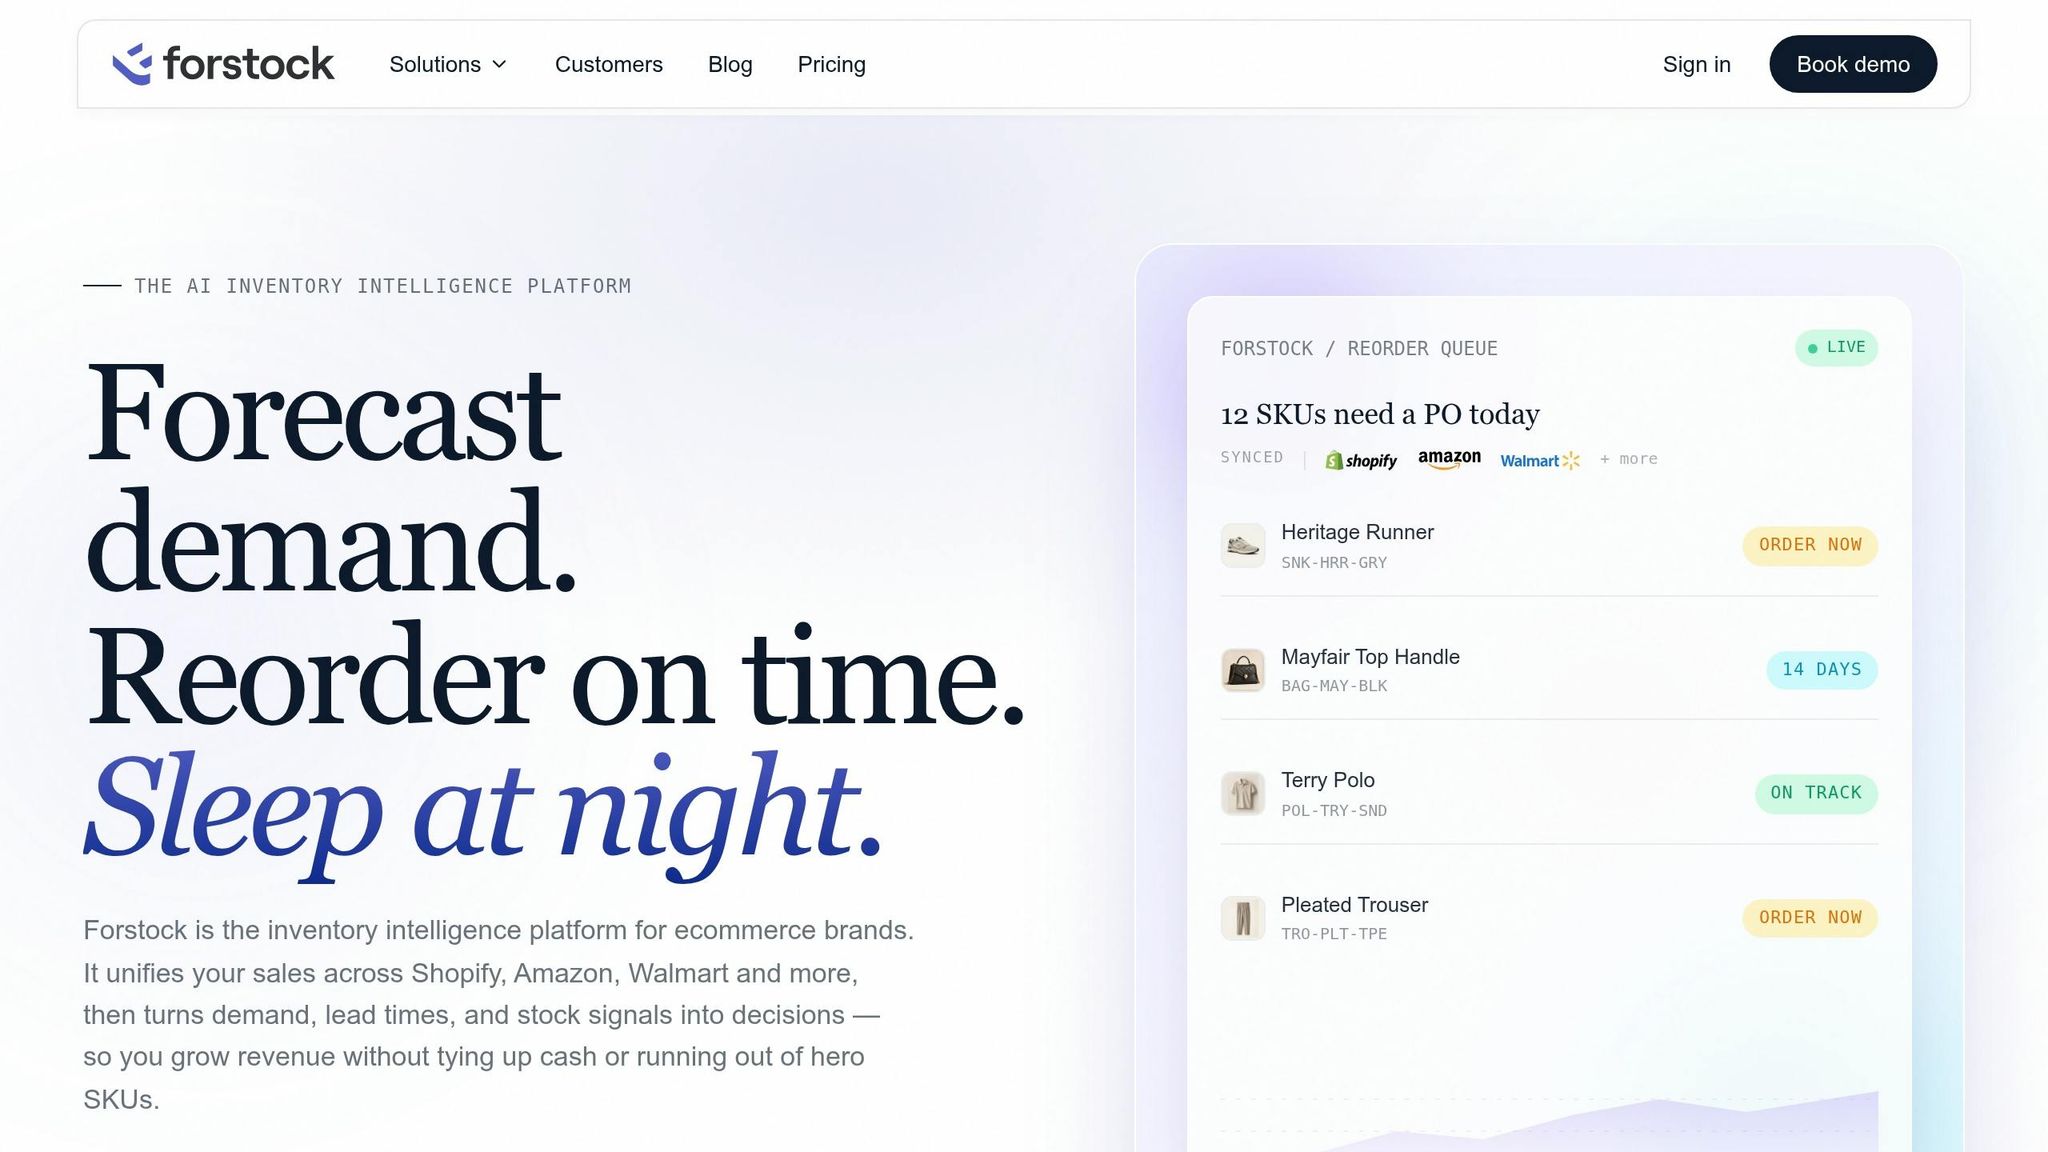
Once you have the baseline, put it into one operating view. Forstock brings product, sales, supplier, and channel data into one place, which makes it easier to line up top-down revenue assumptions with SKU-level unit forecasts. If your top-down plan says 2,000 units but your analog model points to 1,200, check whether marketing heat or wholesale commitments support the higher number before you lock the first-buy quantity.
Bring the baseline into one plan, then refine it with waitlists, preorders, traffic, and first-week sales.
Step 2: Sharpen the forecast with pre-launch and early-launch signals
Once you’ve built the analog baseline, add pre-launch signals to fine-tune it. This is where the forecast starts to feel less like a guess and more like a working plan. The goal is simple: tighten the baseline before you place the first order.
Convert waitlists, preorders, and site traffic into early unit demand
Not every pre-launch signal means the same thing. A paid preorder matters a lot more than an email signup. If you treat both as equal, your forecast can drift out of shape fast.
Two simple formulas help keep things in check:
- Preorder conversion rate = Preorders ÷ Pre-launch sessions
- Expected launch units = Expected launch sessions × expected conversion rate
These formulas turn traffic and interest into a unit estimate you can actually use in your inventory plan. Before you run the numbers, rank each signal by how much trust it deserves.
| Signal Type | Weight | Recommended Use |
|---|---|---|
| Preorders with deposit | High | Direct input for unit demand and first-buy quantity |
| Preorders without deposit | Medium | Directional input; apply a discount factor for conversion, often around 30% to 50% |
| Waitlists / email signups | Low | Top-of-funnel signal only |
| Early site traffic (sessions) | Medium | Pair with expected conversion rate to estimate launch-week units |
Use survey-based purchase intent as a directional input, not a standalone forecast
Survey intent can help, but it shouldn’t run the show. Use it to adjust the baseline, not replace it. Put less weight on survey responses than on deposits or traffic data, and only use it when the sample lines up with your target buyer.
If the survey reached the wrong crowd, the output can look clean on paper and still point you in the wrong direction.
Update the forecast quickly after the first week of sales
The first seven days of live sales give you your earliest demand read. In week one, track order volume, conversion rate, sell-through rate, and ROAS. Those numbers will tell you if your starting assumptions were too high, too low, or about right.
If stockouts distort week-one sales, rebuild the lost demand before you reforecast. Then update the forecast weekly during launch.
Use the revised unit forecast to allocate and optimize inventory by channel and set the first buy.
Step 3: Convert unit demand into a channel-level inventory and first-buy plan
With channel demand mapped out, the next job is simple in theory: split demand by channel, cover lead times, and decide how big the first buy should be.
Allocate total demand by sales channel before placing orders
Not every channel behaves the same way. Shopify DTC, wholesale, Amazon, and retail all move at different speeds. They also come with different fulfillment rules and service expectations. If you treat them all alike, you can end up with too much stock in slower channels and not enough in faster ones.
Start with a base mix from similar products already in your catalog. For example:
- 50% Shopify DTC
- 30% wholesale
- 15% marketplaces
- 5% retail
Then adjust that split to match the new product’s go-to-market plan. If the launch leans heavily on wholesale, move more units toward confirmed purchase orders. Once you have the percentage split, multiply total forecasted units by each channel’s share to get a channel-level unit plan.
After that, tighten the plan using pricing, conversion, and promo timing. If wholesale ASP is lower but volume is higher, it may make sense to move more units there to meet buyer commitments. If Amazon is tied to a Prime Day promo, that channel may need inventory earlier, before the event hits.
Fulfillment rules matter too. Amazon FBA inventory must be in fulfillment centers before launch. Wholesale often comes with minimum order quantities and fixed delivery windows tied to retailer resets or seasonal assortments. Retail chains usually expect 95% to 98% in-stock rates, so a demand-only plan often isn’t enough. You’ll need extra buffer to avoid empty shelves. Shopify DTC gives you more room to start lean and adjust fast, as long as you stay within warehouse capacity, pick/pack limits, and shipping SLAs.
Calculate lead-time demand, safety stock, and reorder points
Once you have channel-level unit plans, the next step is figuring out how much inventory each channel needs to stay in stock through the next replenishment cycle.
Use these two formulas:
- Lead-time demand (LTD) = Average weekly demand × Supplier lead time in weeks
- Reorder point (ROP) = Lead-time demand + Safety stock
For a new SKU, average weekly demand should come from your base-case forecast. If you expect 1,000 units in the first 8 weeks, that works out to 125 units per week. Use that number for LTD until actual sales data starts coming in.
Safety stock is your cushion against forecast misses and supplier variation. IBF benchmarking data shows that new products average 64% forecast error, which is much higher than product improvements or extensions. That alone is a strong reason to carry more safety stock early on.
A practical starting point is 1 to 2 weeks of forecasted demand as safety stock. Then adjust it up or down in the first 4 to 6 weeks as sales patterns become clearer. If supplier lead times swing a lot, size safety stock to cover the high end of that range. If cash is tight, cap safety stock at a dollar amount or weeks of coverage you can actually support.
If you sell across channels with different lead times, calculate ROP for each one on its own. Same math, different inputs.
An overseas manufacturer with an 8-week lead time and 200 units per week in wholesale demand produces an LTD of 1,600 units. Add 400 units of safety stock and your wholesale ROP is 2,000 units.
A domestic 3PL with a 3-week lead time and 100 units per week in DTC demand produces an LTD of 300 units. Add 100 units of safety stock and your DTC ROP is 400 units.
Pick an initial-buy quantity based on risk tolerance and cash exposure
The first purchase order for a new SKU always involves judgment. But it shouldn’t feel like a shot in the dark. There are three common buying paths, and each comes with a different balance of inventory risk, stockout risk, and working capital pressure.
| Buying Option | Inventory Risk | Stockout Risk | Working Capital Impact |
|---|---|---|---|
| Order to base case only | Low | High | Low |
| Order to base case + buffer | Moderate | Moderate | Moderate |
| Order to upside target | High | Low | High |
Ordering to the base case keeps cash exposure down, but it leaves you open if demand starts moving toward your upside scenario. Ordering to the upside target lowers stockout risk, but it can tie up a lot more working capital. If the product underperforms, that can hit cash flow hard.
For most new SKU launches, the middle path tends to make the most sense: order to the base case plus a 20% to 30% buffer.
To make that decision easier, calculate weeks of coverage for each option. That puts the trade-off in plain view so finance, sales, and operations can debate the same numbers instead of talking past each other.
Use Forstock to turn your selected buy quantity into replenishment recommendations and purchase orders by channel or location.
Next, pressure-test the plan with conservative, base, and upside scenarios, and keep promotional lift separate from baseline demand.
Step 4: Pressure-test the plan with scenarios, pricing, and promotions
Once you’ve sized the first buy, run it through three demand cases. This is your last check before you place the order. Think of it as a decision filter: does your first-buy quantity still make sense if demand comes in low, lands near plan, or runs hot?
Build conservative, base, and upside demand scenarios
Create three forecast versions by changing the inputs most likely to move: traffic, conversion rate, pricing, promo support, and lead-time risk. Your starting point should be the stockout-adjusted analog products. Then push that baseline down for the conservative case and up for the upside case by applying a percent below or above the base forecast.
A simple three-scenario table makes the trade-offs easy to see:
| Scenario | Key Assumptions | Adjustment | 90-Day Unit Demand | Coverage Target |
|---|---|---|---|---|
| Conservative | Low traffic; no promo lift; extra lead-time buffer | −10% to 0% | [Your base × adjustment] | 30 days |
| Base | Average traffic and conversion from look-alikes | 0% | [Your analog estimate] | 45–60 days |
| Upside | High traffic; aggressive promo lift; high conversion | +20% to +50% | [Your base × adjustment] | 90 days |
Keep the drivers for each scenario in plain view. If the outcome shifts, you want to know why. Was it traffic? Conversion? A promo? Longer lead times? That visibility helps you spot which assumption is doing the heavy lifting.
Build each case from its own traffic, conversion, pricing, and promo inputs.
Use weeks of coverage to compare downside exposure across all three cases. Coverage is a simple way to weigh cash risk against stockout risk.
Keep promotional demand separate from baseline demand
Once the base scenarios are done, split launch promo lift from run-rate demand.
Treat promo demand as incremental uplift above baseline, not as part of your normal run rate. Launch discounts, bundles, and limited-time offers almost always pull demand forward. If you bake that lift into the baseline, you can end up overbuying the minute the promo wraps up.
Set promo quantities manually in your planning tool for the promo window. That keeps the lift visible and time-bounded, instead of letting it quietly swell your baseline.
Conclusion: Build a usable first forecast, then improve it as data comes in
A new product launch will never come with perfect data. That’s not a reason to skip forecasting. It’s a reason to build a forecast that’s honest about uncertainty.
A structured first forecast gives you a defensible number to take to suppliers, a channel-level inventory split tied to your go-to-market plan, and a buying decision based on trade-offs you’ve already worked through.
"Forecasting new launches isn't about prediction, it's about reaction speed." - Rami Farah, Founder, Forstock
Your first forecast won’t be right. But it can be close enough to help you make a smarter first buy. It also gives you a baseline you can improve once real sales data starts coming in. Update it after week one, then reforecast weekly or even daily if the launch is moving fast. From there, let actual sales take over from the analogs as soon as possible.
FAQs
How do I choose the best analog products?
Choose analog products from your catalog that line up with the new item on three fronts:
- price point
- product category
- target audience
These proxy items give you a practical way to estimate early demand when a new SKU has no sales history.
Once the product launches, watch actual sales for 4 to 8 weeks. Then move toward forecasting based more on live data than on comparisons alone.
Using analogs alongside expert input makes early inventory calls more grounded in reality.
What if my pre-launch signals conflict?
If your pre-launch signals point in different directions, don’t lean on a single metric or a gut call. Pull in input from your sales and marketing teams so you can weigh each signal in context and make a better call.
If things still feel unclear, start with a conservative inventory plan. Then update your forecast fast - weekly or even daily - as soon as actual sales data starts to come in.
When should I replace analogs with real sales data?
Begin replacing proxy models or analogs with real sales data after 4 to 8 weeks of live performance history.
By then, your own sales data is usually a better base than your early estimates, so you can move to more precise forecasting.
Keep reading
Try Forstock free for 14 days.
AI-powered demand forecasting and reorder automation for Shopify brands. No credit card required.