How to Measure Forecast Accuracy for Shopify Stores
Measure Shopify forecast accuracy with MAPE, sMAPE, WMAPE and bias; segment SKUs, adjust for seasonality, and automate forecasting.
How to Measure Forecast Accuracy for Shopify Stores
Forecast accuracy is key to managing inventory effectively for Shopify stores. It helps you avoid overstock vs. stockouts issues, and unnecessary costs while maintaining customer satisfaction. Here's what you need to know:
- Why It Matters: Accurate forecasting prevents running out of stock (missed sales) or over-ordering (storage costs and markdowns).
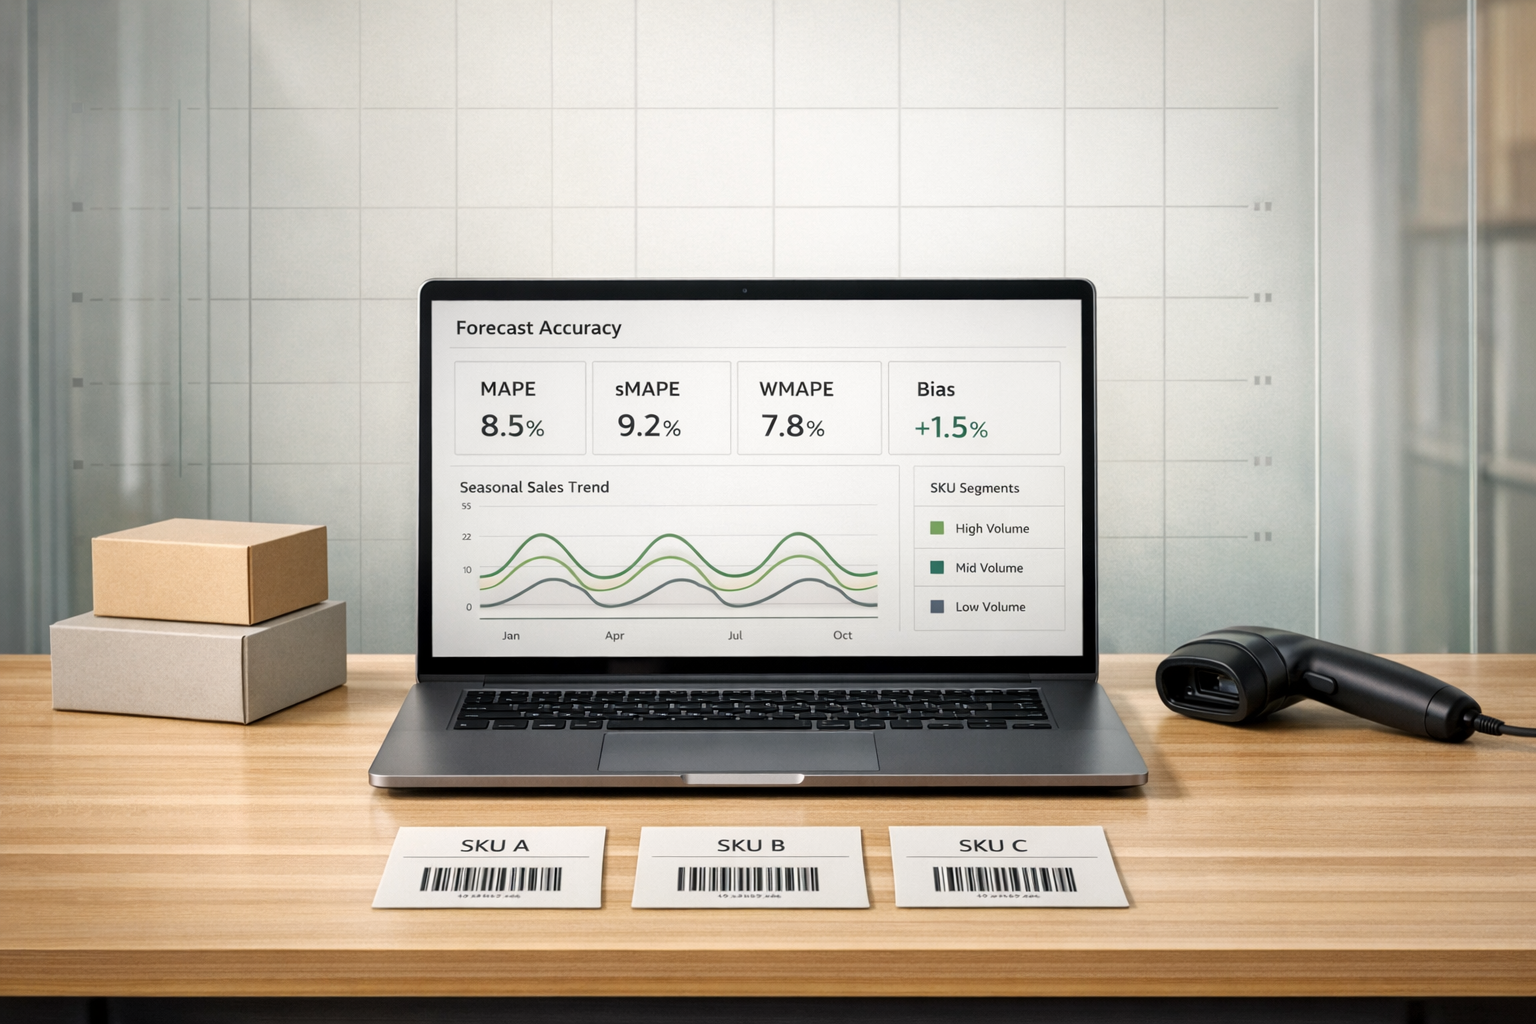
- Key Metrics: Use formulas like MAPE, sMAPE, Forecast Bias, and WMAPE to evaluate how close your predictions are to actual sales.
- Steps to Measure:
- Export Shopify sales data (SKU-level reports).
- Calculate forecast errors for each product.
- Analyze results using Pivot Tables and segment SKUs by importance.
- Benchmarks: Aim for 80–90% accuracy for top-selling products and adjust for seasonal trends.
- Automation Tools: Platforms like Forstock can simplify tracking, automate purchase orders, and optimize inventory management.
Accurate forecasting helps Shopify stores improve cash flow, reduce waste, and keep customers happy. Whether you’re using manual methods or automation tools, refining your approach can significantly impact your bottom line.
Why Forecast Accuracy Matters for Shopify Stores

Getting your forecasts right isn't just about crunching numbers - it’s about protecting your profits and keeping customers happy. When your demand predictions are on point, you avoid the pitfalls of overstocking and stockouts. This balance impacts every area of your business, from reducing warehouse expenses to building customer loyalty. Let’s dive into how accurate forecasting helps cut costs, improve satisfaction, and keep operations running smoothly.
Reducing Inventory Costs
Excess inventory isn’t just a storage problem - it’s a cash flow killer. Holding too much stock means paying for storage, insurance, and the eventual markdowns to clear unsold items. For instance, in 2025-2026, a retailer ordered 600 units of seasonal outdoor furniture based on an overestimated forecast of 180 units. By the end of the season, nearly half the inventory was unsold and liquidated at just 62% of its cost, resulting in a loss of over $4,100. Another case saw a retailer forecast $10 million in sales for a new outerwear line but only achieve $7.5 million, leaving $2.5 million in unsold inventory.
On the flip side, underestimating demand can lead to costly rush deliveries and expedited shipping when popular items run out. Accurate forecasts help maintain the right inventory levels, freeing up cash for essentials like marketing, payroll, or product development instead of tying it up in unsold stock.
Improving Customer Satisfaction
Forecast accuracy has a direct impact on order fulfillment. When you under-forecast, stockouts happen, leading to missed sales and frustrated customers. Research shows that many customers abandon their purchases when faced with "out of stock" messages rather than waiting for backorders.
For top-performing SKUs, the industry standard is a 95% service level, meaning you’re in stock 95% of the time. Achieving this requires a Z-score of 1.65 in your safety stock calculations. If you aim for a 98% service level, you’ll need 24% more safety stock, and bumping that to 99% requires 41% more. Most Shopify stores find 95% to be the sweet spot for balancing availability with costs for high-demand products.
High order fill rates - the percentage of orders fulfilled immediately from available stock - are closely tied to customer satisfaction. Poor forecasting can force you into split shipments or backorders, both of which increase shipping costs and the likelihood of cancellations.
Streamlining Operations
Accurate forecasting keeps your supply chain aligned by matching supplier orders with actual demand trends. This ensures that bulky, slow-moving products don’t clog up valuable warehouse space needed for fast-selling items. It also helps optimize staffing and automate resource allocation, improving efficiency.
By Q1 2025, 98% of companies reported using AI for inventory optimization and demand forecasting in their supply chains. Around 25% of companies now credit more than 5% of their EBIT to AI tools like demand planning. These tools can identify "tracking signals" that show when forecasts are drifting off course, allowing you to make adjustments before stockouts or overstocking become major issues.
Additionally, isolating promotional data is crucial. Promotions often pull future demand forward, so forecasts need to account for lower inventory needs immediately after a sale to avoid excess stock. This level of precision ensures your supply chain stays efficient and your capital remains productively invested.
sbb-itb-f0fc809
Common Formulas for Measuring Forecast Accuracy
Once you understand the importance of forecast accuracy, the next step is knowing how to measure it effectively. The right formula depends on your product mix and sales patterns. For context, the median monthly forecast accuracy for businesses is around 82%, meaning nearly one in five units is misforecast. In retail, a "strong" forecast typically ranges between 70% and 80%, while anything over 85% is considered outstanding.
Mean Absolute Percentage Error (MAPE)
MAPE is a commonly used metric that calculates forecast error as a percentage of actual sales. It does this by averaging the absolute differences between actual and forecasted values, divided by actual sales. In Excel, you can compute MAPE with this formula:
=AVERAGE(ABS((Actual_Range - Forecast_Range) / Actual_Range))
As Natasha from 42Signals explains:
"A MAPE of 5% means that, on average, your forecasts are off by 5%. This is a concept that is easily grasped by both data scientists and business stakeholders alike".
However, MAPE has a limitation - it becomes undefined when actual sales are zero. This issue frequently arises with new or slow-moving Shopify SKUs.
Symmetric Mean Absolute Percentage Error (sMAPE)
To address MAPE's limitations, sMAPE uses the average of actual and forecasted values in the denominator. This adjustment keeps the metric within a range of 0% to 200% and prevents distortions caused by low or zero sales. For products with seasonal demand or unpredictable sales, sMAPE offers a more reliable measurement.
Forecast Bias and Tracking Signal
Forecast Bias helps you understand whether you consistently over- or under-forecast. This metric is calculated by summing up your forecast errors (actual minus forecast) over a given period. A positive total suggests under-forecasting, while a negative total indicates over-forecasting.
To track this tendency further, use the Tracking Signal, which is calculated as the cumulative forecast error divided by the Mean Absolute Deviation (MAD). A tracking signal within the range of –4 to +4 is generally acceptable. Values outside this range signal a persistent bias that requires correction.
Forecast Accuracy Percentage and WMAPE
Forecast Accuracy Percentage is a straightforward metric defined as 1 - MAPE. For instance, a 15% MAPE corresponds to an 85% accuracy score.
For businesses with diverse product catalogs, Weighted Mean Absolute Percentage Error (WMAPE) can be more insightful. WMAPE assigns greater weight to errors on high-volume items, ensuring that a 10% miss on a best-seller impacts the overall score more than a 10% miss on a low-volume product. This approach aligns your accuracy metrics with the actual business impact.
These formulas provide a solid framework for evaluating and refining your demand forecasts, helping you make more informed inventory and sales decisions.
Step-by-Step Guide to Calculating Forecast Accuracy
How to Calculate Forecast Accuracy for Shopify Stores: 3-Step Process
This guide takes the forecasting formulas you've learned and turns them into actionable steps for managing inventory on Shopify. You'll extract your sales data, calculate forecast errors for each product, and then combine those results to evaluate your overall accuracy.
Exporting Sales Data from Shopify
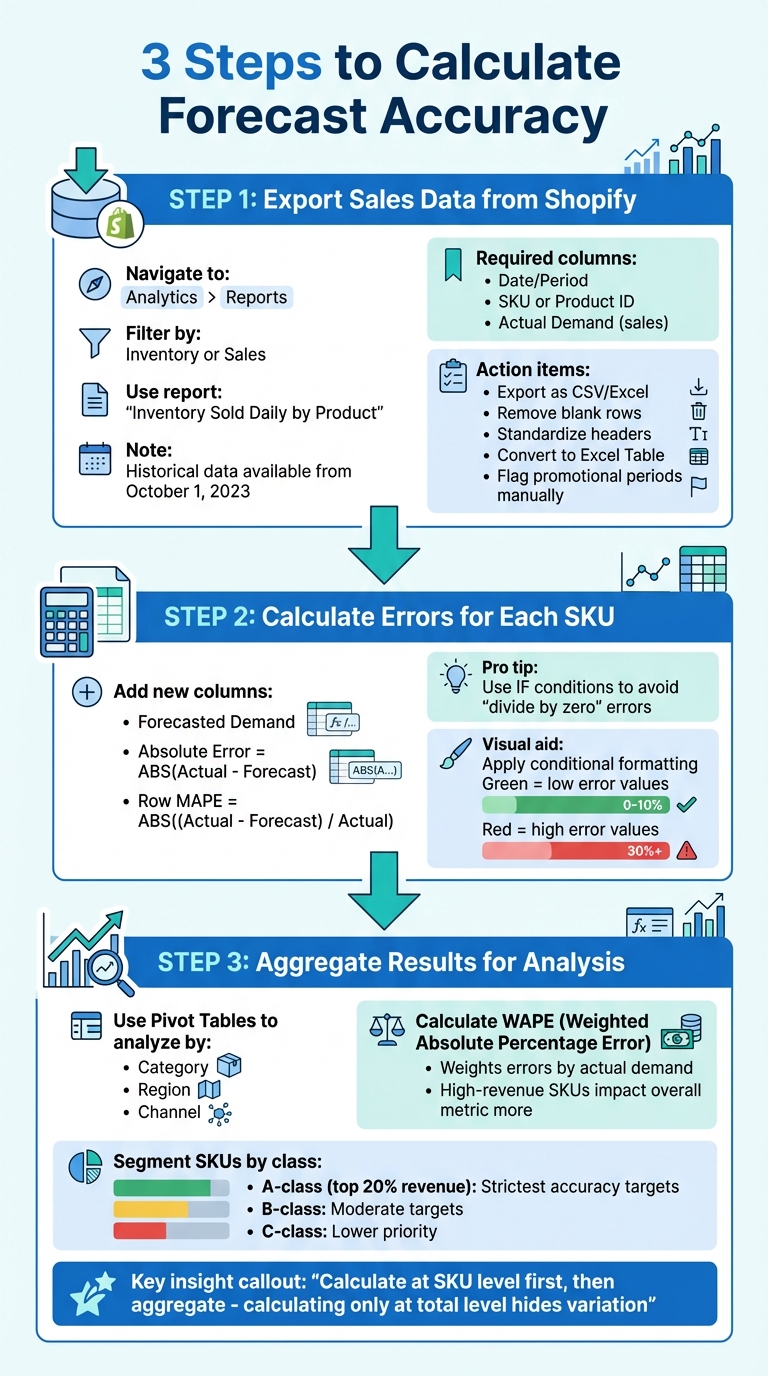
Start by heading to Analytics > Reports in your Shopify admin. From there, filter by Inventory or Sales. The Inventory Sold Daily by Product report is particularly useful - it breaks down SKU-level sales over your selected timeframe. Keep in mind that Shopify's historical inventory data only goes back to October 1, 2023.
When exporting, make sure your dataset includes these key columns: Date/Period, SKU or Product ID, and Actual Demand (your actual sales). Save the file as a CSV or Excel document, then clean it up. This means removing blank rows, standardizing column headers, and converting the data into an Excel Table. Doing this ensures that formulas will automatically adjust as you add new rows.
It’s also a good idea to manually flag promotional periods. These can distort your demand data and lead to inaccurate zero values. Once your dataset is cleaned and ready, you can move on to calculating forecast errors for each SKU.
Calculating Errors for Each SKU
Now, focus on capturing errors for each SKU and time period. Add new columns to your spreadsheet for Forecasted Demand, Absolute Error (using a formula like =ABS(Actual - Forecast)), and Row MAPE (calculated as =ABS((Actual - Forecast) / Actual)). To avoid "divide by zero" errors, use an IF condition in your formulas.
To make your analysis more visual, apply conditional formatting. For example, use green to highlight low error values and red for high ones. This will help you quickly spot SKUs that are underperforming.
Once you've calculated these individual errors, you're ready to combine the data for a broader analysis.
Aggregating Results for Analysis
With your SKU-level errors in hand, the next step is to aggregate the data to uncover larger trends. Pivot Tables are your best friend here - use them along with slicers to analyze performance by Category, Region, or Channel. For a store-wide view, calculate WAPE (Weighted Absolute Percentage Error). This method weights errors by actual demand, ensuring that high-revenue SKUs have a bigger impact on your overall metric, rather than letting low-volume items skew the results.
Bani Kaur from Prediko highlights the importance of this approach:
"Calculating only at the total level hides variation, so each SKU, period, or location needs its own error metrics [before aggregating]".
To deepen your analysis, segment your SKUs by class (A, B, C). For example, A-class items - your top 20% by revenue - typically demand stricter accuracy targets compared to C-class items. This segmentation ensures you're prioritizing the products that matter most to your bottom line.
Benchmarks and Targets for Forecast Accuracy
Understanding Accuracy Benchmarks
Forecast accuracy tends to drop as you move from broader company-level metrics to more granular SKU-level data. For example, accuracy at the company level often exceeds 90%, while it typically falls to around 70–85% for individual SKUs. This shift is expected when forecasting detailed sales figures.
Targets also vary by product category. Grocery and staples can often achieve accuracy rates between 80–95%, but categories like fashion and apparel, influenced by fast-changing trends, usually hover around 60–75%. For Hero SKUs - the top 20% that drive the majority of revenue - aim for 80–90% accuracy. Core SKUs should target 70–85%, while Long Tail items may be acceptable at 60–75%. New product launches are particularly challenging, with a realistic accuracy range of 50–70% during their first six months.
"The question isn't whether your forecasts are wrong - it's whether they're wrong in ways that hurt your business".
Improving accuracy from 60% to 80% can have a major operational impact. However, pushing accuracy beyond 85% - to 90% or higher - often involves disproportionate costs. In such cases, increasing safety stock or calculating reorder points might be a more practical and cost-effective solution.
Seasonal factors, which can further complicate accuracy, should also be taken into account.
Adjusting for Seasonality
Seasonal events like Black Friday Cyber Monday and the December holidays can significantly disrupt forecast accuracy. During these high-demand periods, it’s important to adjust your accuracy targets and proactively increase safety stock. A useful method is calculating a Seasonal Uplift Factor - this involves comparing sales during peak periods (e.g., November 1–December 24) against a baseline period just before the surge (e.g., September 15–October 31).
Promotions can drive demand spikes ranging from 40% to 250%, often followed by a post-promotion dip where sales drop to about 60% of baseline levels for up to four weeks. To manage these fluctuations, increasing safety stock by 50–100% during high-demand periods can help stabilize both inventory and supply chain performance. It’s also important to exclude stockout periods from historical data, as these "false zeros" can reduce forecast accuracy by 15–25%.
Tracking Performance at SKU and Channel Levels
Setting benchmarks and adjusting for seasonality is only part of the equation - tracking performance with precision is just as critical. Aggregate forecasts can sometimes hide significant errors at the SKU level, which makes individual tracking indispensable.
"Significant item-level over- and under-forecasting cancels out in aggregate, creating the illusion of an accurate forecast while hiding meaningful bias".
Since ordering decisions are made at the SKU level, even small forecasting errors on high-impact Hero SKUs can lead to major revenue losses or surplus inventory. Regular reviews and strict accuracy targets are essential for these key items.
Similarly, tracking performance across different sales channels is crucial. For instance, if one channel has excess inventory while another faces shortages, the solution isn’t to order more stock but to redistribute it effectively. This approach minimizes markdowns and ensures products are available where demand is highest. Persistent errors over several ordering cycles - typically two to four - may indicate deeper issues, such as overlooked promotions, changing customer preferences, or supplier problems, all of which need to be addressed. By aligning these adjustments with benchmarks, businesses can make smarter, data-driven inventory decisions.
Using Forstock for Automated Forecast Accuracy Measurement
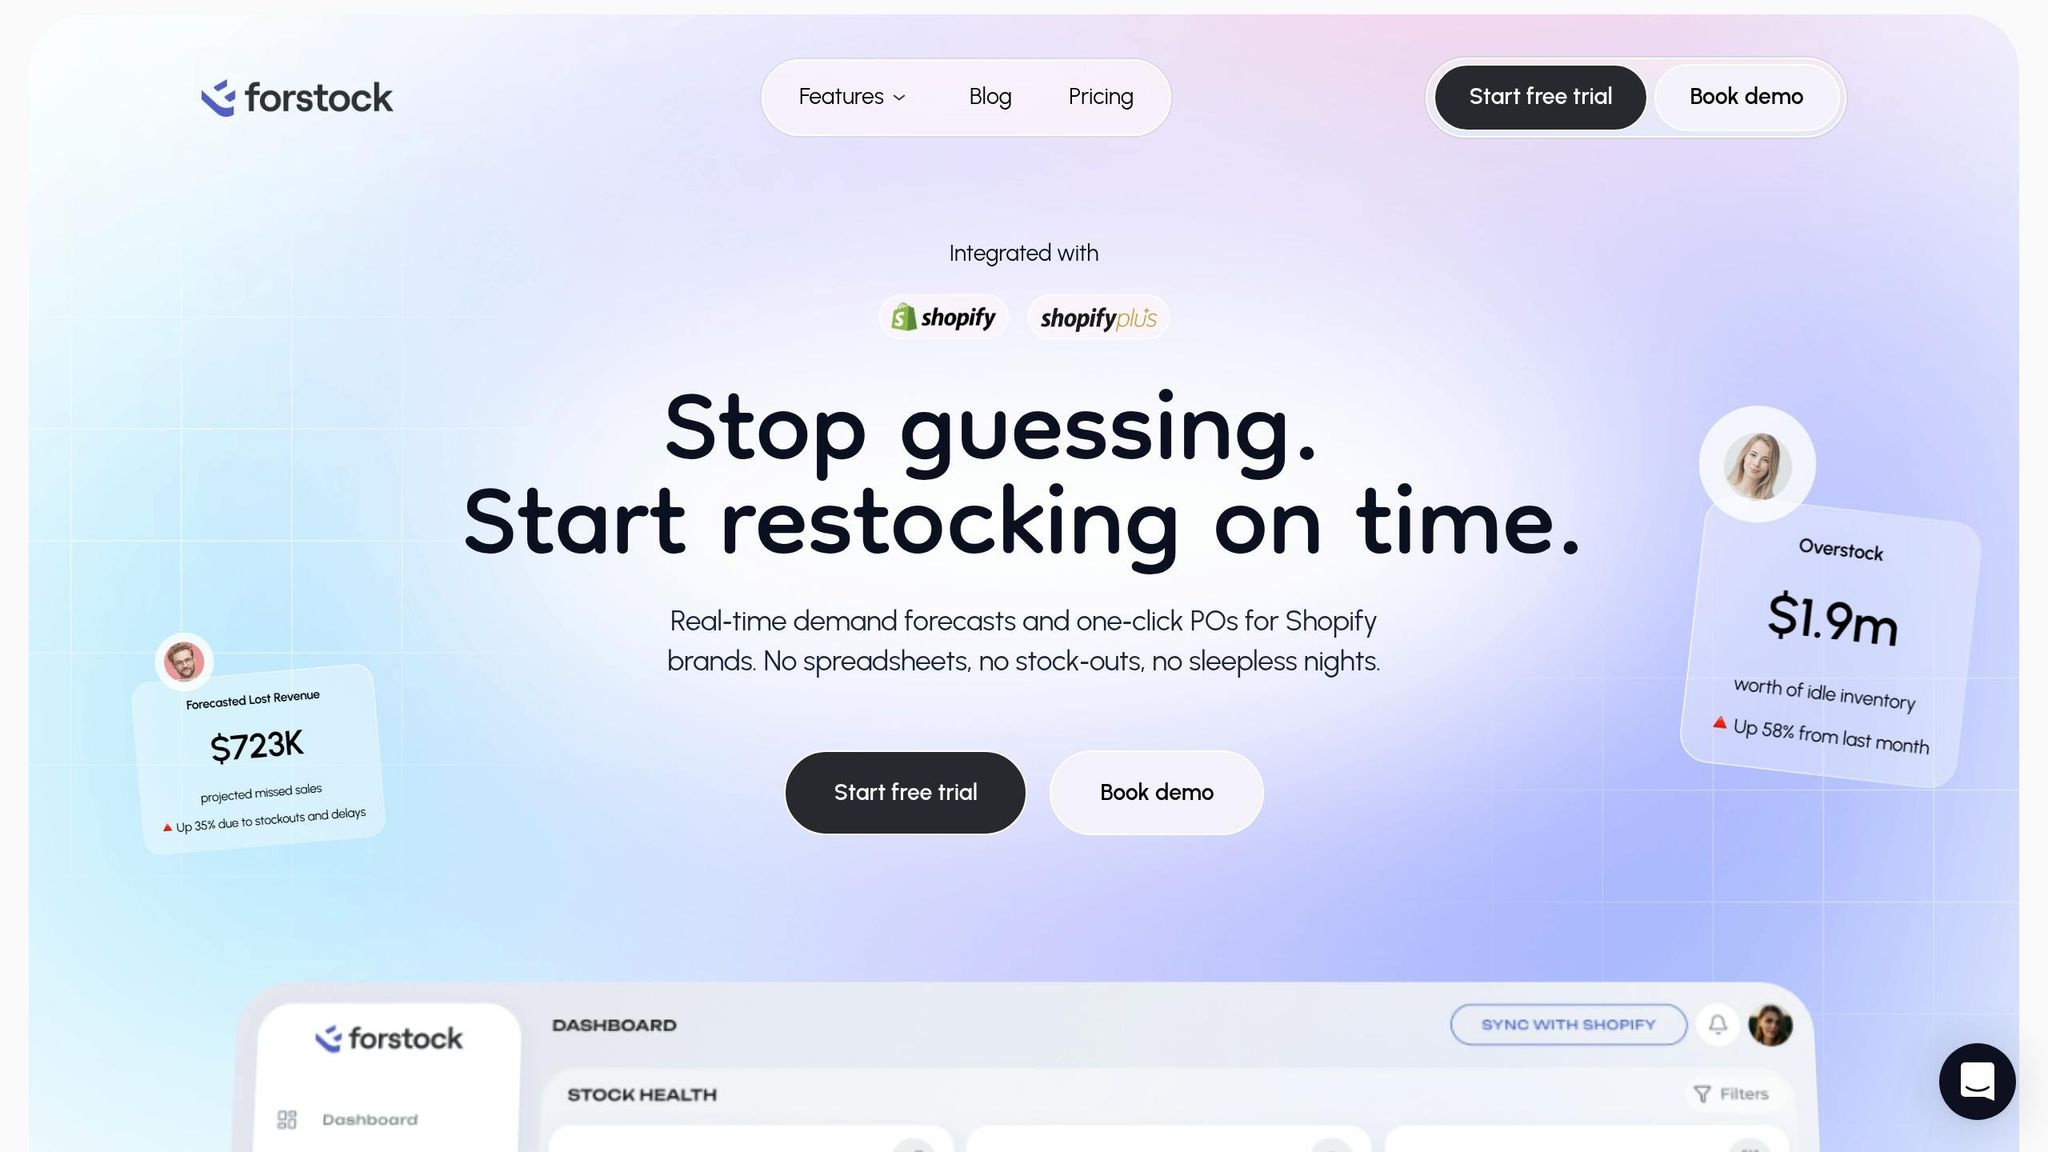
Once you've got the hang of manual forecasting, it's worth exploring how automation with Forstock can transform your workflow. Tracking forecast accuracy manually across multiple SKUs is not only time-consuming but also leaves room for mistakes. Forstock takes the hassle out of this process by integrating seamlessly with Shopify. It syncs your listings, orders, and inventory levels in real time, eliminating the need for clunky spreadsheets and outdated data exports. This means your accuracy calculations are always based on up-to-date activity.
Real-Time Forecast Dashboards
Forstock’s automation doesn’t just save time - it delivers insights you can act on. The platform features a centralized dashboard that serves as the hub for your inventory health. Instead of manually calculating metrics like MAPE or sMAPE, Forstock continuously tracks forecast performance across your entire product catalog. You get instant visibility into which SKUs are thriving and which ones need attention. The dashboard consolidates inventory turnover, stock value, and accuracy metrics into a single, easy-to-read view, helping you quickly identify trends and make informed decisions.
Automated Purchase Order Creation
Forstock goes a step further by automating purchase orders. Once its AI-driven forecasting pinpoints reorder points with AI, the platform generates purchase orders automatically, factoring in predicted demand, lead times, and safety stock levels. This eliminates manual calculations and reduces the risk of errors.
"The AI forecast actually makes sense for my business. It feels like having a supply chain manager on my team".
The system is flexible, adapting to shifts in sales patterns and aligning reorder points dynamically with current market trends. This automation doesn’t stop at order creation - it extends to optimizing your entire inventory strategy.
Data-Driven Inventory Optimization
Forstock’s AI learns from your Shopify data, analyzing everything from seasonality to growth trends to forecast demand with pinpoint accuracy. It generates a 12-month demand plan, giving you a clear picture of future inventory needs and helping you prepare for high-demand periods well in advance. The platform fine-tunes forecasts for each product variant - whether it’s size, color, or style - based on unique sales behaviors.
"We have cut manual inventory tasks by at least 60%".
Conclusion
Forecast accuracy plays a critical role in ensuring your purchase orders are sized correctly, helping you sidestep the pitfalls of stockouts and overstocking. Metrics like MAPE, sMAPE, Forecast Bias, and WAPE are essential for measuring both the scale and direction of forecasting errors, turning purchasing from a guessing game into a data-driven approach.
Refining your forecasts involves segmenting SKUs and accounting for anomalies like false zeros. For A-class items, aim for higher accuracy standards - keeping MAPE under 20% is a good benchmark. Using multiple metrics together can help identify patterns, such as whether you're consistently ordering too much or too little.
As your operations grow, manual tracking becomes less practical. This is where tools like Forstock come into play, offering automation through inventory analytics dashboards, AI-driven demand planning, and automated purchase orders. These features not only reduce human error but also align seamlessly with techniques like 12-month demand forecasts and variant-level analysis, significantly cutting down manual effort.
Even a modest improvement in MAPE - say, from 30% to 20% - can lead to a 20–35% reduction in stockouts. This has a ripple effect, boosting cash flow, cutting down on emergency orders, and improving customer satisfaction. By enhancing forecast accuracy, you can streamline your inventory management process and turn it into a competitive edge. Whether you're just starting to track these metrics or looking to automate, the strategies shared here provide a strong foundation for success.
FAQs
Which accuracy metric should I use for my Shopify SKUs?
To evaluate forecast accuracy for your Shopify SKUs, it’s important to use a variety of metrics instead of depending on just one. Relying on a single metric can mask problems like consistently overestimating or underestimating demand. One widely used metric is Mean Absolute Percentage Error (MAPE), which calculates the average forecast error as a percentage of the actual demand. For deeper insights, segment these metrics by SKU class and tie them to inventory results, such as stockouts or overstocking. This approach helps you spot patterns and make more informed decisions.
How do I handle zero sales and stockout days in accuracy calculations?
Zero sales and stockout days can throw off forecast accuracy if not managed correctly. One way to tackle this is by excluding zero-sales days from percentage error calculations. Alternatively, you can use metrics like Mean Absolute Error (MAE), which are less affected by periods of zero demand. Another approach is to segment metrics based on SKU classes and track trends over time. This can help uncover patterns and refine accuracy without distorting the results.
What forecast accuracy target should I set for my top products?
While there isn't a one-size-fits-all accuracy target for top products, many in the industry aim for 85-95% forecast accuracy. This range strikes a balance, helping businesses reduce the risks of stockouts and overstocking. To achieve this, consider using AI-driven tools like Forstock to enhance prediction accuracy. Additionally, keep a close eye on your key performance indicators (KPIs) and adjust your models regularly to ensure continuous improvement.
Keep reading
Try Forstock free for 14 days.
AI-powered demand forecasting and reorder automation for Shopify brands. No credit card required.