
Multi-Channel Demand Forecasting: Shopify Best Practices
Centralize multi-channel sales, track MAPE and lead times, and automate reorder points to reduce stockouts and excess inventory.
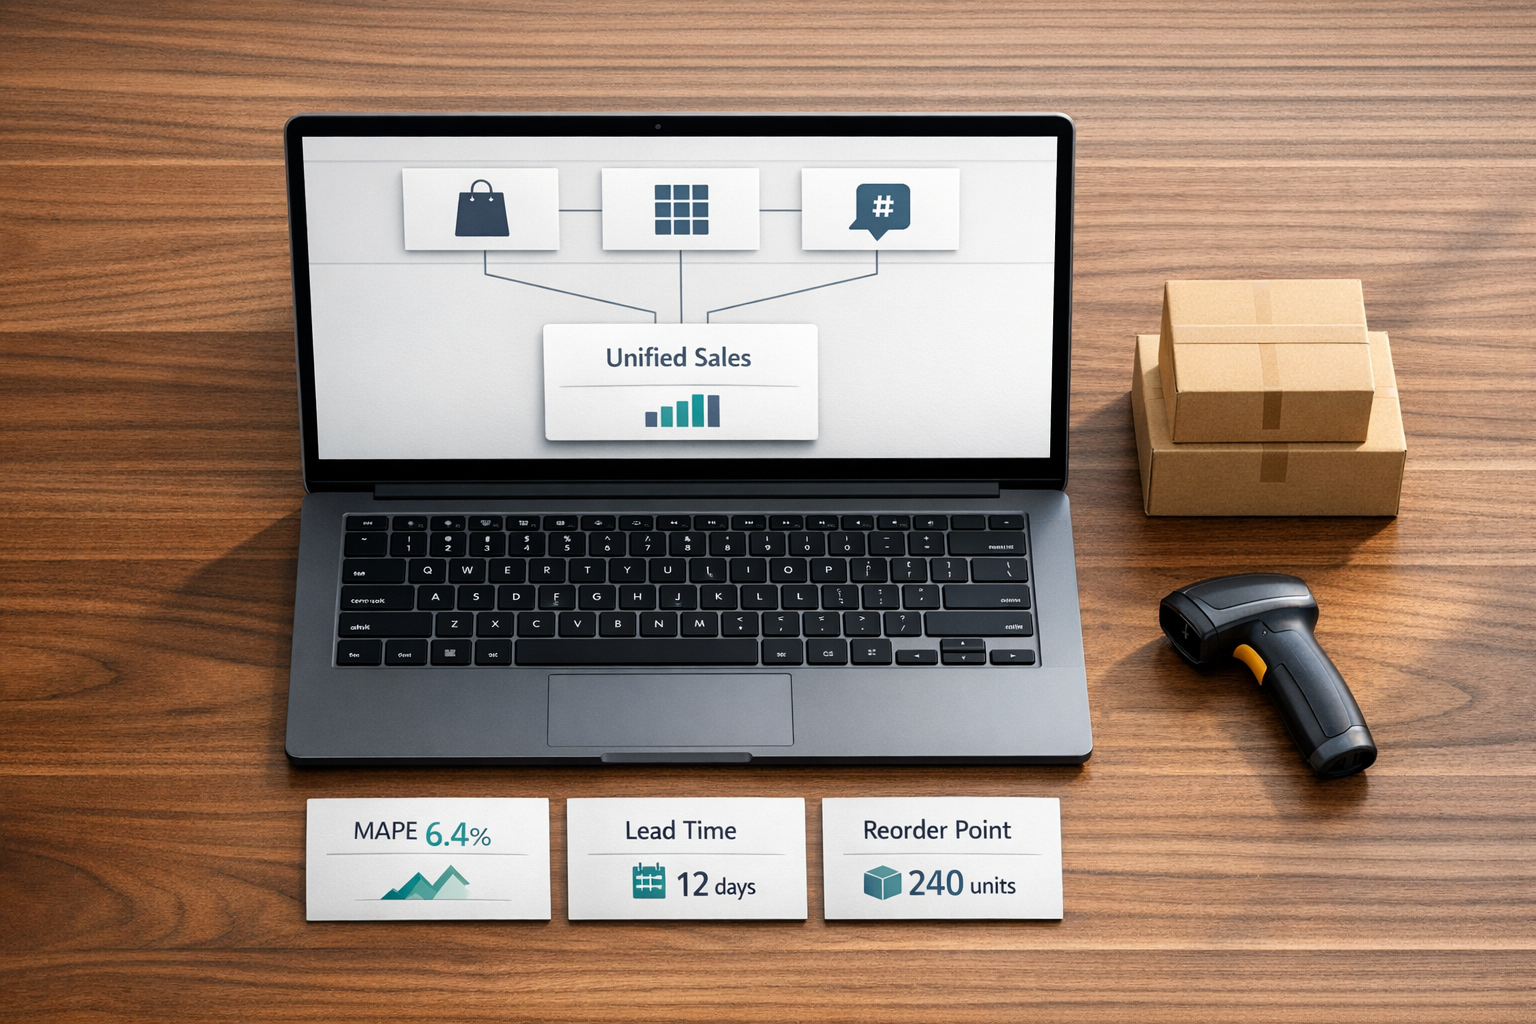
Multi-Channel Demand Forecasting: Shopify Best Practices
Forecasting inventory across multiple sales channels - like Shopify, Amazon, or TikTok Shop - can help you avoid stockouts and overstocking, which cost retailers $1.77 trillion annually. By consolidating data from all platforms, you gain a complete view of demand, enabling smarter inventory decisions. This approach can reduce stockouts by 30–50% and excess inventory costs by 20–40%.
Key takeaways for Shopify merchants:
- Centralize data: Combine sales, inventory, and supplier lead times from all channels to eliminate blind spots.
- Track critical metrics: Monitor MAPE, inventory turnover, and service levels to measure forecast accuracy.
- Use tailored methods: Different products (steady, seasonal, trending, or new) require specific forecasting techniques.
- Set reorder points: Base them on actual lead times and include safety stock to prevent disruptions.
- Automate workflows: Tools like Forstock integrate with Shopify, improving forecast accuracy by 28% and reducing stockouts by 75%.
Building a Data Foundation for Multi-Channel Forecasts
To create reliable forecasting models, you need clean and unified data. Without it, even the most advanced algorithms can produce inaccurate results.
Centralizing Inventory and Sales Data
One of the biggest hurdles for multi-channel Shopify merchants is fragmented data. Your Shopify admin shows one view, Amazon Seller Central another, and your 3PL warehouse system yet another. These systems often don't communicate seamlessly, which makes it harder to track true demand. For instance, if the same SKU is sold across multiple platforms, a sudden spike on one channel could drain inventory for others. A centralized system for multi-supplier data brings together sales velocity, inventory levels, and supplier lead times across all channels, helping you identify potential stockouts before they happen.
Leveraging native API integrations ensures your data stays up-to-date and accurate.
Key Data Points Needed for Forecasting
To forecast effectively, you need to focus on specific data points:
| Data Point | Why It Matters |
|---|---|
| Daily sales by channel | Highlights which platforms are gaining or losing momentum. |
| SKU-level stock levels | Prevents overselling by syncing inventory in real time. |
| Supplier lead times | Helps set accurate reorder points by comparing actual vs. promised delivery. |
| Promotional history | Filters out event-driven spikes to reveal true demand trends. |
| Returns and cancellations | Excluding these avoids overestimating future sales. |
For example, while a supplier may promise a 30-day lead time, the actual time from order placement to 3PL receipt might average 42 days. That 12-day gap can lead to repeated late reorders if left unaccounted for.
Rectifying Data Issues
Even with a centralized system, data must be cleaned to ensure accurate forecasts. Common issues include stockout periods, promotional spikes, and duplicate or missing SKUs.
Stockouts, for instance, show zero sales - not because demand dropped, but because inventory was unavailable. This often leads to under-ordering. Similarly, promotional events, like flash sales or viral campaigns, can inflate sales figures for a short time. Without adjustments, these temporary spikes could be misinterpreted as sustained demand.
A good starting point is to analyze at least 24 months of sales data. Remove one-time outliers, exclude returns and cancellations, and adjust for periods of stockouts. Additionally, using an ABC analysis - focusing on the top 20% of SKUs that drive around 80% of revenue - can make these cleaning efforts more efficient.
"High-quality data is essential for accurate forecasting. Preprocessing steps include handling missing values, removing duplicates, identifying outliers, and normalizing data." - Youri Moskovic, CEO & Co-Founder, Prediko
With clean, consolidated data, you can better track key metrics and refine your forecasting methods for more reliable demand predictions.
Core Forecasting Concepts and Metrics for Shopify Merchants

Once your data is unified, the next step is to focus on the forecasting metrics that guide smart inventory decisions. These metrics are the backbone of determining the right order quantities.
Forecasting Metrics You Need to Track
Mean Absolute Percentage Error (MAPE) is key for measuring how accurate your forecasts are. It’s calculated as:
MAPE = (Σ|Actual – Forecast| / Actual ÷ Number of SKUs) × 100.
For stable products, a MAPE of 20–30% is considered reasonable, while seasonal items typically fall in the 30–50% range.
Forecast bias happens when predictions are consistently too high or too low - often due to overly conservative estimates. If unchecked, this can result in inventory mismatches.
You’ll also want to monitor service level (the percentage of days a SKU remains in stock) and inventory turnover (calculated as COGS ÷ average inventory value). For your best-performing SKUs - those driving the most revenue - a service level above 95% is ideal. On the flip side, products with fewer than three inventory turns per year may struggle to stay profitable once warehouse and capital costs are factored in.
| Metric | Formula | What It Tells You |
|---|---|---|
| MAPE | (Σ|Actual – Forecast| / Actual ÷ Number of SKUs) × 100 | How accurate your forecast is, as a percentage |
| Inventory Turnover | COGS ÷ Average Inventory Value | How fast you’re selling through inventory |
| Days Inventory Outstanding (DIO) | (Avg. Inventory Value ÷ COGS) × Days in Period | How many days of stock you have on hand |
| Service Level | % of days a SKU is available for purchase | How reliably a SKU is kept in stock |
Mastering these metrics sets the stage for understanding demand patterns and planning for seasonal trends.
Demand Patterns and Seasonality
With the right metrics in place, the next step is to categorize your demand trends for more tailored forecasting. Demand typically falls into four categories: steady-state (consistent year-round), seasonal (predictable peaks and dips), trending (sales accelerating or slowing), and erratic (unpredictable or new products).
For U.S. merchants, the seasonal calendar plays a huge role. For instance, Black Friday/Cyber Monday demand can spike to 300% of a store's monthly average, while January sales might drop to just 40%. Other key periods include the Fourth of July, Back-to-School season in August, and Thanksgiving.
To account for these fluctuations, use a seasonal index. This involves dividing the average sales for a specific month by the overall monthly average, then applying that multiplier to your baseline forecast. Just make sure to exclude any stockout periods from your historical data when calculating the index.
"The goal of forecasting is not perfection. It is being less wrong than you were when you were guessing." - Stockful Blog
Lead Times, Safety Stock, and Reorder Points
Once you’ve nailed down your metrics and seasonal insights, it’s time to set precise inventory triggers to keep your supply chain running smoothly.
Your reorder point (ROP) tells you when to place a new order. The formula is:
(Average Daily Sales × Actual Lead Time in Days) + Safety Stock.
It’s critical to base this on actual lead times, which include production, transit, customs, and 3PL processing - not just supplier estimates.
Safety stock acts as a buffer against demand surges or supply chain hiccups. The number of days you set aside depends on the product:
- 7–14 days for steady sellers
- 14–21 days for seasonal or promotional items
- 21–30 days for products with unreliable suppliers
During peak seasons like Q4, you might want to increase safety stock by 25–50% to handle longer lead times.
For multi-channel setups, consolidate demand across all platforms using your centralized data. For example, if a product sells 10 units daily on Shopify and 5 units on another channel, calculate reorder points based on a combined volume of 15 units per day. Ignoring this can lead to unexpected stockouts.
Forecasting Methods for Different Product Types
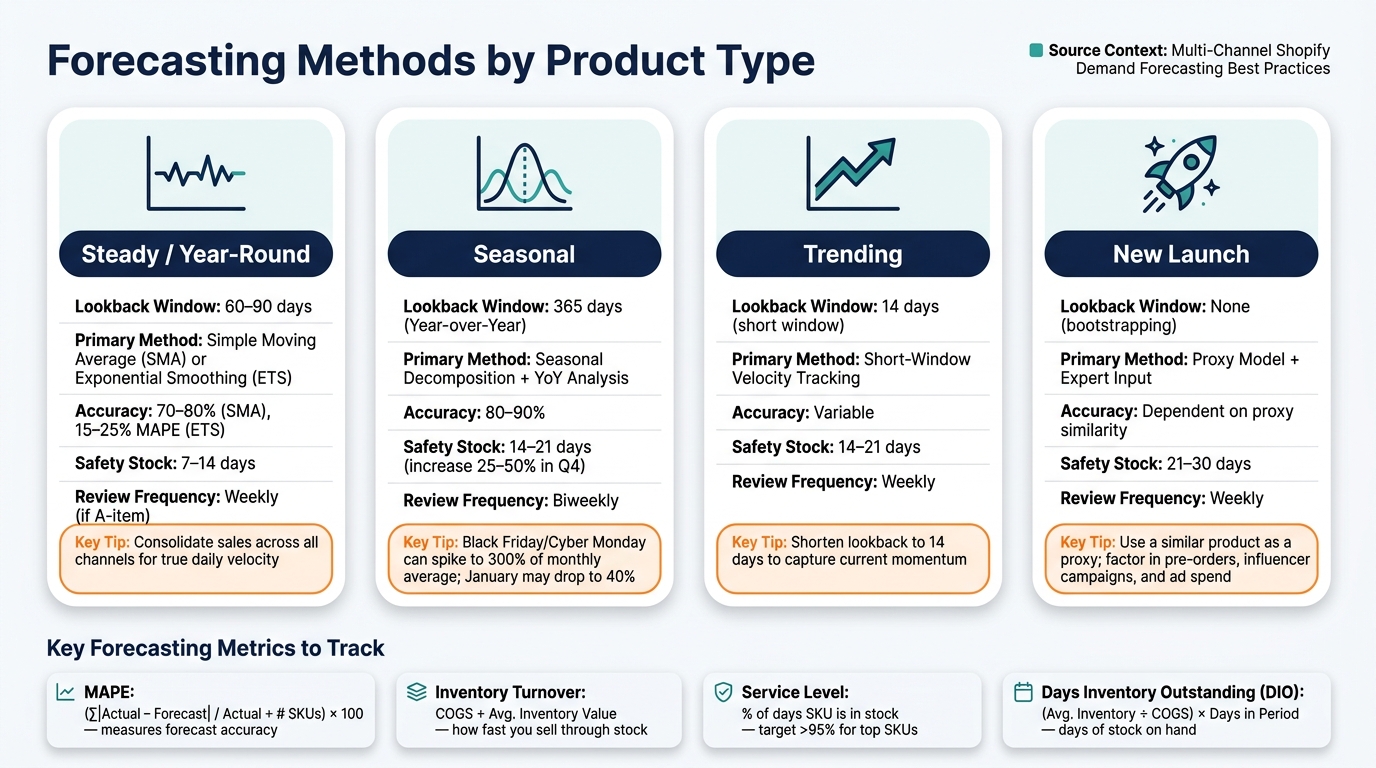
Forecasting Methods by Product Type: Shopify Multi-Channel Guide
Not all products in your catalog behave the same way, and relying on a single forecasting method for everything can lead to mistakes. By integrating sales trends from all your channels, you can fine-tune your approach. The right method depends on whether a product has stable demand, is seasonal, promotional, or brand new.
Forecasting Steady, Year-Round Products
Products with consistent demand - like everyday consumables or basic apparel - are well-suited for Simple Moving Average (SMA). Here's how it works: calculate the average daily sales over a set period, such as 30, 60, or 90 days. For instance, if 300 units are sold over 90 days, the daily average is 3.3 units. Use this figure in your reorder point formula.
SMA typically achieves 70–80% accuracy for stable SKUs. If a gradual trend starts to appear, switching to Exponential Smoothing (ETS) can improve accuracy even further. ETS places more emphasis on recent sales, reducing Mean Absolute Percentage Error (MAPE) from over 40% to 15–25%.
A critical step is consolidating sales data across all channels. For example, if a product sells 8 units per day on Shopify and 4 units through a wholesale portal, its actual velocity is 12 units per day. Your reorder point should reflect this combined figure.
"If your product has steady demand and years of sales, trust the model. An algorithm can handle baseline forecasts with low errors." Modern systems even use AI to improve reorder point accuracy by adapting to real-time shifts. - Shopify Staff
For products with more variable demand, you'll need a different strategy.
Forecasting Seasonal and Promotional Products
Seasonal and promotional products require approaches beyond simple averages. For these items, Year-over-Year (YoY) analysis is essential. Instead of comparing March to February, compare this March to last March. Rolling averages can blur the peaks and valleys that are critical for accurate planning.
A more advanced method is seasonal decomposition, which separates sales history into three components: the underlying trend, seasonal patterns, and random noise. These components are then recombined to create a forecast. This method can achieve 80–90% accuracy for categories like fashion or holiday items, where demand spikes are common.
Promotional forecasting requires isolating the promotional lift from baseline demand. For example, if a BOGO sale increases sales by 60%, apply that multiplier only to the campaign period. Letting this spike affect your baseline could lead to over-ordering after the promotion ends. Similarly, flag anomalies like viral social media posts or clearance events to exclude them from future projections.
Forecasting New and Trend-Driven Products
Forecasting for new products is tricky due to the lack of sales history. A practical solution is using a proxy model. This involves identifying a similar product in your catalog - one with a comparable price, category, and target audience - and using its early sales data as a template. Make sure to aggregate demand signals across all channels, like Shopify and others, for a consistent starting point.
Once a new product gains traction, shorten your lookback window to 14 days. This captures current momentum more effectively than the standard 60–90 days, which might dilute the signal with older data.
"A trending item might need a shorter window (14 days) to catch current momentum, while a stable SKU might use 60 or 90 days for steadier forecasts." - Sensible Tools Blog
The table below outlines the best methods for each product type:
| Product Type | Recommended Lookback | Primary Method |
|---|---|---|
| Steady/Stable | 60–90 days | Simple Moving Average or ETS |
| Seasonal | 365 days (YoY) | Seasonal Decomposition |
| Trending | 14 days | Short-Window Velocity Tracking |
| New Launch | None (bootstrapping) | Proxy Model + Expert Input |
For new launches, automated models often fall short. This is where human expertise comes in - consider factors like pre-order volume, influencer campaigns, or planned ad spend to manually adjust your forecast before placing a purchase order.
sbb-itb-f0fc809
Building a Repeatable Multi-Channel Demand Planning Process
Creating a reliable demand forecasting process is all about consistency - turning predictions into actionable steps that drive results.
Setting Up a Forecasting Workflow
To stay on top of inventory needs, establish planning horizons: short-term (4–8 weeks), mid-term (2–4 months), and long-term (6–12 months). These timelines help you manage tactical adjustments, plan reorders, and prepare for seasonal shifts.
Not all SKUs need equal attention, though. ABC segmentation is a simple way to focus where it counts. Here's how it works:
- "A" items: Your top 20% of SKUs by revenue. Review these weekly and aim for 30–45 days of safety stock.
- "B" items: The middle 30%. A biweekly review with 14–21 days of safety stock is sufficient.
- "C" items: The bottom 50%. Check in monthly and maintain 7–10 days of safety stock.
| SKU Category | Revenue Contribution | Review Frequency | Safety Stock Target |
|---|---|---|---|
| A Items | Top 20% | Weekly | 30–45 days |
| B Items | Middle 30% | Biweekly | 14–21 days |
| C Items | Bottom 50% | Monthly | 7–10 days |
Make it a habit to conduct a Monday morning review. Compare last week’s sales to your forecast and dig into any differences. Was there a sudden spike due to a social media post? Did a price adjustment impact demand? Or were there stockouts? This regular review keeps your forecasts aligned with reality.
By following this structured approach, you’ll be ready to move seamlessly from predictions to purchase orders.
Turning Forecasts into Purchase Orders
Once your forecast is finalized, the next step is converting it into purchase orders. Use your reorder point formula and adjust for supplier requirements like minimum order quantities (MOQs) or case pack sizes. For example, if you need 340 units but your supplier’s case pack is 50 units, round up to 350 to avoid fulfillment issues.
It’s also crucial to base reorder points on actual lead times, not just supplier estimates. For instance, if a supplier promises 30 days but past performance shows an average of 42 days, plan accordingly. Keeping a supplier scorecard that tracks PO-to-receipt times and delivery reliability can help you create realistic buffers. During busy periods like Q4, sharing a 90-day demand forecast with your suppliers ensures they’re prepared with raw materials and production slots.
To save time and reduce manual work, automation can streamline this entire process.
Using Forstock to Automate Demand Planning
Once you’ve built a solid process, automation tools like Forstock can take things to the next level. For businesses managing 50–100+ SKUs across multiple channels, automation isn’t just helpful - it’s essential.
Forstock integrates directly with Shopify, syncing your orders, SKUs, and inventory history without needing cumbersome CSV uploads. Its AI-powered forecasting engine factors in seasonality, lead times, and growth trends at the SKU level, keeping your data unified and actionable. Users have seen impressive results, including a 28% boost in forecast accuracy and a 75% drop in stockouts.
"Forstock has been great. We're preventing stockouts that were costing us $50K monthly. The AI predictions are incredibly accurate." - Matt, Operations Lead, TechGear
But Forstock doesn’t stop at forecasting. It also automates reorder recommendations and converts them into purchase orders, factoring in MOQs and lead times. Alexander, a Supply Chain Manager at FashionCo, shared his experience:
"The automated PO creation saves us 10+ hours weekly. Setup was seamless – just 2 minutes!"
At just $79/month, Forstock offers a practical solution for Shopify brands looking to simplify demand planning without adding extra staff.
Conclusion: Key Takeaways for Shopify Demand Forecasting
For Shopify brands, multi-channel demand forecasting isn't just a helpful tool - it's a game-changer. By adopting the strategies detailed earlier, businesses can shift to data-driven forecasting that transforms inventory management. The results? Fewer stockouts, less overstock, better cash flow, and a noticeable boost in sales recovery.
This guide emphasizes moving from reactive choices to precise, SKU-level planning. That means centralizing sales data from all channels, calculating reorder points and lead times accurately, using the right forecasting methods for each product type, and regularly reviewing forecasts. These steps don't just streamline operations - they directly impact cash flow and reduce excess inventory.
For teams managing 50+ SKUs, automation becomes the backbone of sustainability. As Jason, Co-founder at HomeGoods, shared:
"We reduced excess inventory by 45% and freed up $150K in working capital."
With tools like Forstock, outcomes like these are within reach for just $79/month. Features like AI-powered forecasting, automated purchase order creation, and seamless Shopify integration make it possible. On average, forecasting accuracy improves by 28%, and decision-making becomes 40% faster. For many brands, this is the difference between scrambling to manage stockouts and confidently planning for growth.
FAQs
How do I combine demand from Shopify and other channels into one forecast?
To bring together demand from Shopify and other sales channels, combine the sales velocity of each SKU into one unified demand signal. This approach helps ensure your forecast accounts for total demand, reducing the risk of under-ordering.
Leverage a platform that consolidates sales data in real time, offering a single, clear view across all channels. For example, tools like Forstock can sync your data, analyze combined demand, and create precise forecasts, making inventory management more efficient.
Should I use supplier promises or actual history for lead times when setting reorder points?
When it comes to inventory planning, historical lead times are your best friend. Unlike supplier promises, which can sometimes be overly optimistic, historical data shows you the real delivery performance over time. This approach helps you sidestep issues like stockouts or overstocking by relying on trends that have already proven themselves. By focusing on actual performance, you can make smarter, more reliable decisions for your inventory needs.
How do I forecast new or trending products with little sales data?
When you're working with limited sales data, forecasting trends or predicting the success of new products can feel like a guessing game. But combining human insights with AI tools can make the process much more reliable.
Start by gathering whatever sales data you have, even if it’s minimal. Then, look beyond your internal numbers - tap into external signals like social media trends, search patterns, or upcoming marketing campaigns. These can provide valuable clues about where demand might be heading.
AI models are particularly useful here. They can analyze real-time data and market signals to identify patterns you might miss. To make these predictions even sharper, involve your sales and marketing teams. Their on-the-ground knowledge can add context and nuance that algorithms alone can’t provide.
Finally, remember to revisit and update your forecasts regularly. As fresh data rolls in, refining your predictions ensures they stay relevant and accurate.
Keep reading
Try Forstock free for 14 days.
AI-powered demand forecasting and reorder automation for Shopify brands. No credit card required.