How to Forecast Demand for a Shopify Store: A Practical Guide for Inventory Teams
Turn Shopify sales history into actionable weekly SKU forecasts: clean data, set safety stock, reorder points, and buy quantities.
How to Forecast Demand for a Shopify Store: A Practical Guide for Inventory Teams
If I had to boil this down to one point, it’s this: demand forecasting turns Shopify sales history into clear buying rules. I use it to decide what to reorder, when to reorder it, and how much to buy by SKU, channel, and location.
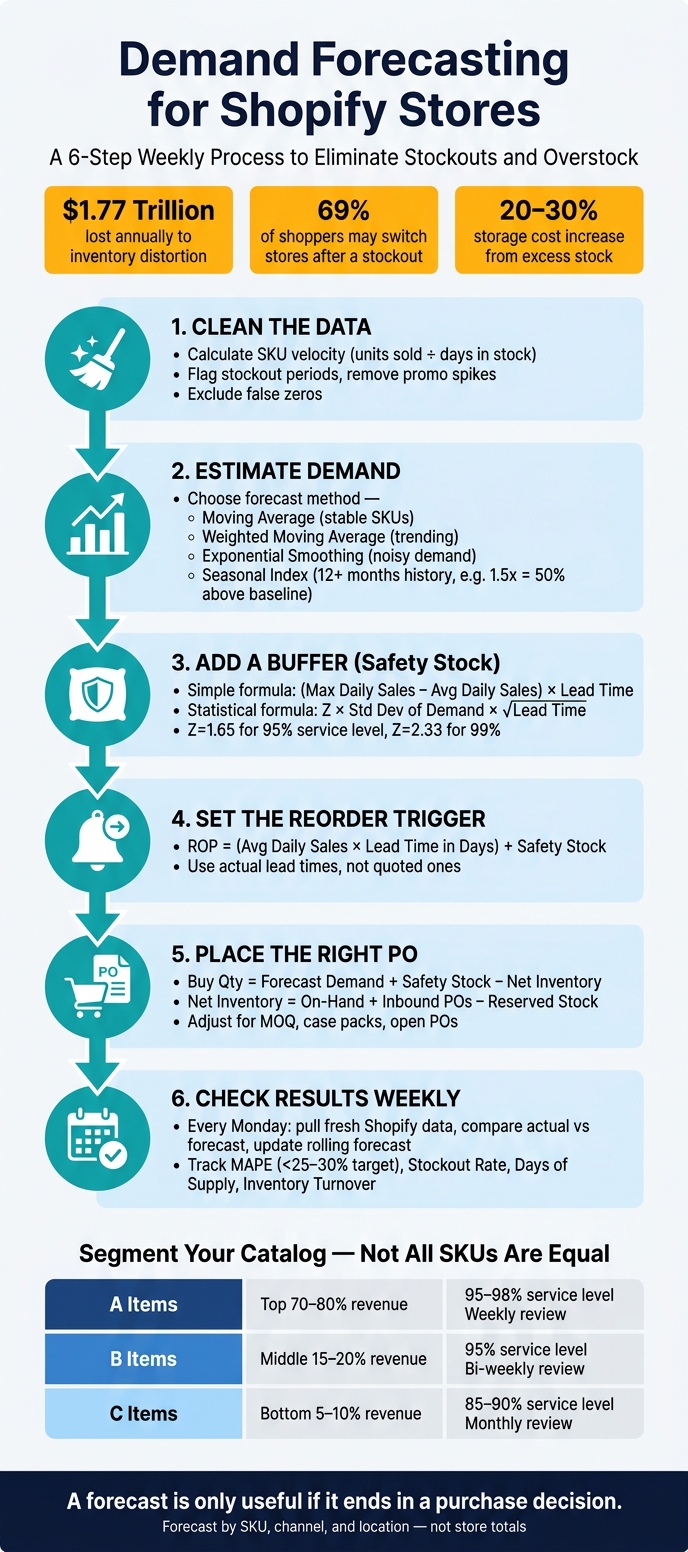
Poor inventory calls are expensive. The article points out that inventory distortion costs retailers about $1.77 trillion each year, 69% of online shoppers may switch stores after a stockout, and excess stock can push storage costs up by 20% to 30%. So the fix is not guesswork. It’s a simple weekly process built on clean data.
Here’s the full idea in plain English:
- I start with SKU-level data, not store totals
- I calculate sales velocity only for days the item was in stock
- I remove false zeros from stockouts
- I flag and exclude promo spikes from the baseline
- I split demand by channel and location when sales patterns differ
- I use actual lead times, not supplier promises
- I build a baseline forecast with a moving average, weighted average, smoothing, or seasonal index
- I turn that forecast into safety stock, reorder points, and buy quantities
- I adjust for MOQ, case packs, inbound POs, and reserved stock
- I review the numbers every week and track forecast error, stockouts, and days of supply
A simple way to think about it:
- Clean the data
- Estimate demand
- Add a buffer
- Set the reorder trigger
- Place the right PO
- Check results weekly
One point I like in this guide: a forecast is only useful if it ends in a purchase decision. So instead of stopping at “expected sales,” the process moves straight to the numbers inventory teams need to act on.
This article walks through that process from start to finish in a way you can run in a spreadsheet or a Shopify-connected tool.
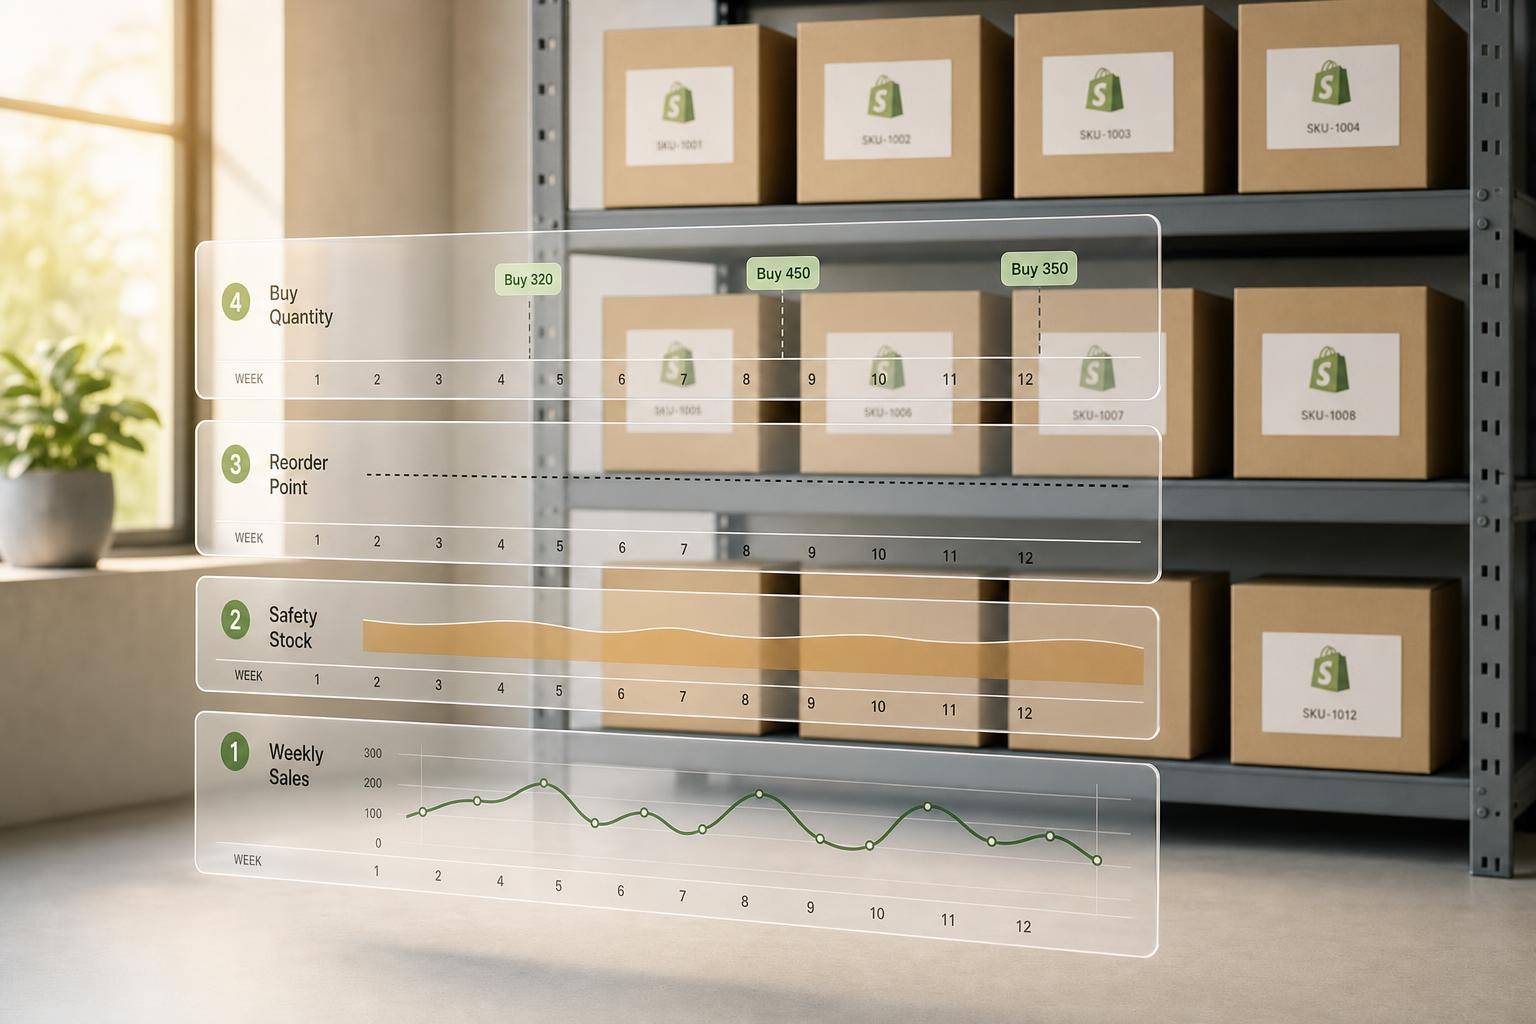
Demand Forecasting for Shopify: 6-Step Weekly Process
Forthcast Inventory Management for Shopify merchants short demo
sbb-itb-f0fc809
Collect the Shopify data you need before you forecast
Start with clean SKU-level inputs before you forecast. Build your forecast from a SKU table, not a storewide total.
Key inputs: velocity, stockouts, promotions, seasonality, and lead times
Start with SKU velocity: units sold divided by days in stock. If a product was out of stock for 10 days in a 30-day window, calculate velocity over 20 days, not 30. Using the full period makes demand look lower than it was and often leads to under-buying.
Stockout history helps remove false zeros. When a product is unavailable, Shopify records no sales. But that doesn’t mean demand disappeared. People may still have wanted to buy. Those false zeros drag the forecast down and can set you up for the same stockout again. Flag any period where inventory hit zero so you can adjust the baseline upward to better reflect actual demand.
Promotions do the opposite. Flash sales and one-off campaigns, like influencer posts, can cause short-term spikes in unit sales. If you leave those spikes in the baseline, the forecast treats them like normal demand and pushes future buy quantities too high. Flag promo periods and leave them out of the baseline velocity calculation.
Seasonality changes demand by week, month, and holiday period. Don’t treat peak periods as business as usual. Apply a seasonal multiplier to baseline demand based on year-over-year patterns.
Use actual historical lead times, not quoted lead times. Suppliers don’t always deliver on the timeline they promise, and that gap affects when you need to place an order. These inputs shape both the baseline forecast and the reorder rules that come next.
Organize data by SKU, channel, and location
The same SKU can behave in very different ways depending on where it sells. A product in your DTC store may move one way, while that same SKU in wholesale or retail follows a different pattern. If you mix those channels into one number, you end up with a forecast that misses the mark for both. Forecast each channel separately when DTC, wholesale, and store demand don’t move together.
Build a SKU-level planning table with the fields you need to forecast and buy. Beyond weekly units sold, each row should include:
- SKU / variant
- Stockout flag
- Promo flag
- Channel (DTC, wholesale, retail)
- Location (warehouse, 3PL, retail store)
- Lead time in days
- MOQ
- Unit cost
Your inventory position should live in this table too. On-hand is what’s physically in the warehouse. Committed is units sold but not yet shipped. Incoming is stock already tied to open purchase orders. Use net inventory:
on-hand + incoming - committed
Table: how each input maps to a planning output
Use this mapping to separate forecast inputs from order inputs.
| Input | Baseline Forecast | Safety Stock | Reorder Point | Order Quantity |
|---|---|---|---|---|
| SKU Velocity | ✓ | |||
| Seasonality | ✓ | |||
| Promotions | ✓ | |||
| Stockouts | ✓ | ✓ | ||
| Lead Time | ✓ | ✓ | ||
| Channel & Location | ✓ | |||
| Committed & Incoming Stock | ✓ |
Velocity and seasonality shape what you expect to sell. Stockout history and lead time variation shape how much buffer to hold. Channel, location, committed stock, and incoming POs help you decide how many units to order and where those units should go.
Build a baseline demand forecast from Shopify sales history
Pick a time bucket and clean your sales history
With clean SKU-level inputs ready, the next step is to turn that history into a baseline forecast.
For most Shopify SKUs, weekly buckets are the best place to start. They show shifts in demand without all the day-to-day static. Use daily buckets only when daily sales volume is high enough to change purchasing decisions in a meaningful way.
After you pick a time bucket, clean the history before you run any calculations. Remove periods affected by stockouts, promos, and one-off bulk orders. What’s left is your baseline demand.
Once the data is clean, use the simplest forecasting method that fits the SKU.
Start with simple methods: moving average, smoothing, and seasonal indexes
Start with a moving average for stable, mature SKUs. Use 14, 30, 60, or 90 days of clean unit sales to estimate average daily velocity. A shorter 14-day window works well for items that are starting to move in a new direction. A longer 60- to 90-day window fits steadier SKUs better.
For trending products, a weighted moving average or exponential smoothing tends to react faster than a plain average. Why? Because both methods put more weight on recent periods. That makes them useful when sales are moving up or down week over week.
If you have at least 12 months of history, add a seasonal index. Divide average sales in a given month by average sales across all months. If the index is 1.5, that month runs 50% above baseline. So you’d multiply your base forecast by 1.5 for that period.
For new products or launches with no history, use a judgmental override. Base it on market research, expert opinion, or marketing plans, not gut feel alone.
Table: forecast method comparison
| Method | Purpose | Data Needed | Strengths | Limits | Best Use Case |
|---|---|---|---|---|---|
| Moving Average | Stable demand | 3-6 months of clean sales data | Simple to calculate; smooths random noise | Lags behind rapid trend shifts | Mature, non-seasonal products with low volatility |
| Weighted Moving Average | Recent performance matters more | 3+ periods of sales data | More responsive to emerging trends | Can be skewed by one-off anomalous orders | Products with accelerating demand or recent marketing shifts |
| Exponential Smoothing | Trend-sensitive items | 12-24 months to detect patterns | Adapts to trend changes faster than SMA | Requires setting a smoothing constant (alpha) | Products with noisy but stable demand patterns |
| Seasonal Index | Cyclical demand | 12-24 months of historical data | Accounts for predictable annual peaks and valleys | Fails if seasonal timing shifts | Holiday-sensitive items or seasonal apparel |
| Judgmental Override | New or unpredictable events | Market research and expert opinion | Incorporates info data can't see | High risk of human bias | New product launches or influencer campaigns |
Use this baseline next to set reorder points, safety stock, and buy quantities.
Turn your forecast into reorder points, safety stock, and buy quantities
Your baseline forecast needs to turn into three things: safety stock, a reorder point, and a buy quantity.
That’s the bridge between “what demand may look like” and “what you should actually purchase.”
Calculate safety stock based on demand and lead-time variability
Safety stock gives you a cushion when two things drift off plan: how fast a SKU sells and how long the supplier takes to deliver.
A simple place to start is:
Safety Stock = (Max Daily Sales − Average Daily Sales) × Lead Time in Days
If you want a tighter method tied to a service level target, use:
Safety Stock = Z × Standard Deviation of Demand × √Lead Time
Use Z = 1.65 for 95% service and 2.33 for 99%.
Not every SKU needs the same cushion. Your top A items usually need a higher service level than slow-moving accessory SKUs. That’s just common sense: running out of a best seller hurts a lot more.
One more thing here: use actual lead time, not the lead time quoted on the PO. This is especially critical when managing seasonal demand and lead time adjustments during peak periods. That means transit time and receiving time count too.
Set reorder points and order quantities that match real constraints
Once you have baseline demand, turn it into an order trigger and a purchase amount.
The reorder point (ROP) is the inventory level that tells you it’s time to place a new purchase order:
ROP = (Average Daily Sales × Lead Time in Days) + Safety Stock
When inventory hits that point, calculate the buy quantity with:
Buy Quantity = Forecast Demand for the Planning Period + Safety Stock − Net Inventory
Where:
Net Inventory = On-Hand + Inbound POs − Reserved Stock
That last part matters more than many teams think. If stock is already sold but hasn’t shipped yet, it is not free stock. Subtracting reserved stock helps you avoid kidding yourself about what’s on the shelf.
After you set the base quantity, adjust it for the limits you deal with in day-to-day purchasing, like:
- MOQ
- Case pack sizes
- Open POs already in transit
Table: SKU segmentation by service level and stock buffer
Giving every SKU the same rule is a classic way to end up with too much stock on slow movers and not enough on your best sellers. Segment your catalog instead.
| SKU Class | Revenue Contribution | Target Service Level | Safety Stock Approach | Review Cadence |
|---|---|---|---|---|
| A Items | Top 70–80% | 95–98% | Statistical formula (Z = 1.65 to 2.05) | Weekly |
| B Items | Middle 15–20% | 95% | 14–21 days of demand | Bi-weekly |
| C Items | Bottom 5–10% | 85–90% | 7–10 days or simple % buffer | Monthly |
Use these service levels in the weekly planning cadence that follows.
Run the process every week and improve forecast accuracy over time
Set a repeatable planning cadence with clear owners
Once reorder points and buy quantities are set, forecasting shifts from a one-time task into a weekly operating habit. Build the forecast, then run it on the same schedule every week.
Every Monday, pull fresh sales, on-hand inventory, and lead-time data from Shopify. Compare actual sales against the forecast. Then update the rolling forecast for promotions, launches, and seasonality. If inventory hits the reorder point, release the purchase order. Using AI to improve reorder point accuracy can further reduce the risk of stockouts during this phase.
Ownership should stay simple and clear:
- Inventory planners handle the data refresh, baseline updates, and accuracy metrics.
- Buyers handle supplier communication, MOQ talks, and purchase order approval.
- Operations or warehouse teams handle incoming shipment tracking, lead time monitoring, and receiving accuracy.
Review A items weekly, B items every two weeks, and C items monthly.
Track accuracy and inventory health with a small set of KPIs
Use a short list of metrics to tell whether the process is getting better.
The table below shows the six KPIs to watch each cycle, what each one means, and when to step in.
| KPI | Definition | Interpretation | Action Trigger |
|---|---|---|---|
| MAPE | Mean Absolute Percentage Error | Average forecast error size | If >25–30%, review model assumptions or data quality |
| Forecast Bias | Directional error (over vs. under) | Positive = under-forecasting; negative = over-forecasting | If consistent for 2–4 cycles, adjust your baseline demand model |
| Stockout Rate | % of demand unfulfilled | Lost revenue and customer trust | If rising, increase safety stock for A-tier SKUs |
| Days of Supply | On-hand inventory ÷ avg. daily sales | Days until stockout | If < lead time + safety buffer, trigger an immediate reorder |
| Inventory Turnover | COGS ÷ avg. inventory value | Efficiency of capital usage | If <3, review pricing, carrying costs, and replenishment |
| Stock-to-Sales Ratio | Ending inventory ÷ sales for the period | Whether stock is balanced with velocity | If consistently high (e.g., >3.0), pause reorders and clear excess |
One habit pays off fast: write down why the forecast missed. Keep a simple log of what threw things off, like an Instagram post that drove 3x sales or a supplier delay. After 8–12 weeks, those notes stop feeling random and start becoming inputs you can use in the next forecast.
Conclusion: the forecasting framework to put into practice
That weekly loop is what connects the forecast to day-to-day purchasing decisions.
The full process comes down to five steps: collect the right Shopify data, build a simple baseline forecast, correct for stockouts and promotions, turn demand into safety stock and reorder points, and review results on a fixed cadence.
FAQs
How much sales history do I need to forecast demand accurately?
In most cases, 12 to 18 months of sales history is enough to forecast demand with a solid level of accuracy. That time span usually gives you enough information to spot trends, seasonality, and shifts in demand.
For highly seasonal or volatile products, using up to 24 months of data can help improve accuracy. If you only have 6 months or less, work with what you have and add qualitative insights to fill the gaps, especially for new products.
What should I do when a SKU has very low or irregular sales?
Use safety stock and adjust your forecasting method. A 7–14 day buffer can help prevent stockouts when demand jumps or sales get uneven.
Historical averages alone won’t cut it. Review sales data often to spot trends, seasonality, and anomalies. Then update reorder points based on actual supplier lead times and sales variability.
For these SKUs, shorter review cycles give you a closer read on what’s happening without piling up too much inventory.
How often should I update reorder points and safety stock?
Update them on a regular schedule: weekly for most SKUs, especially fast-moving or seasonal products. For slower-moving items or products with steady demand, monthly reviews may be enough.
If you use automation, reforecast daily or weekly so your data stays current and you can help prevent stockouts or overstocking.
Keep reading
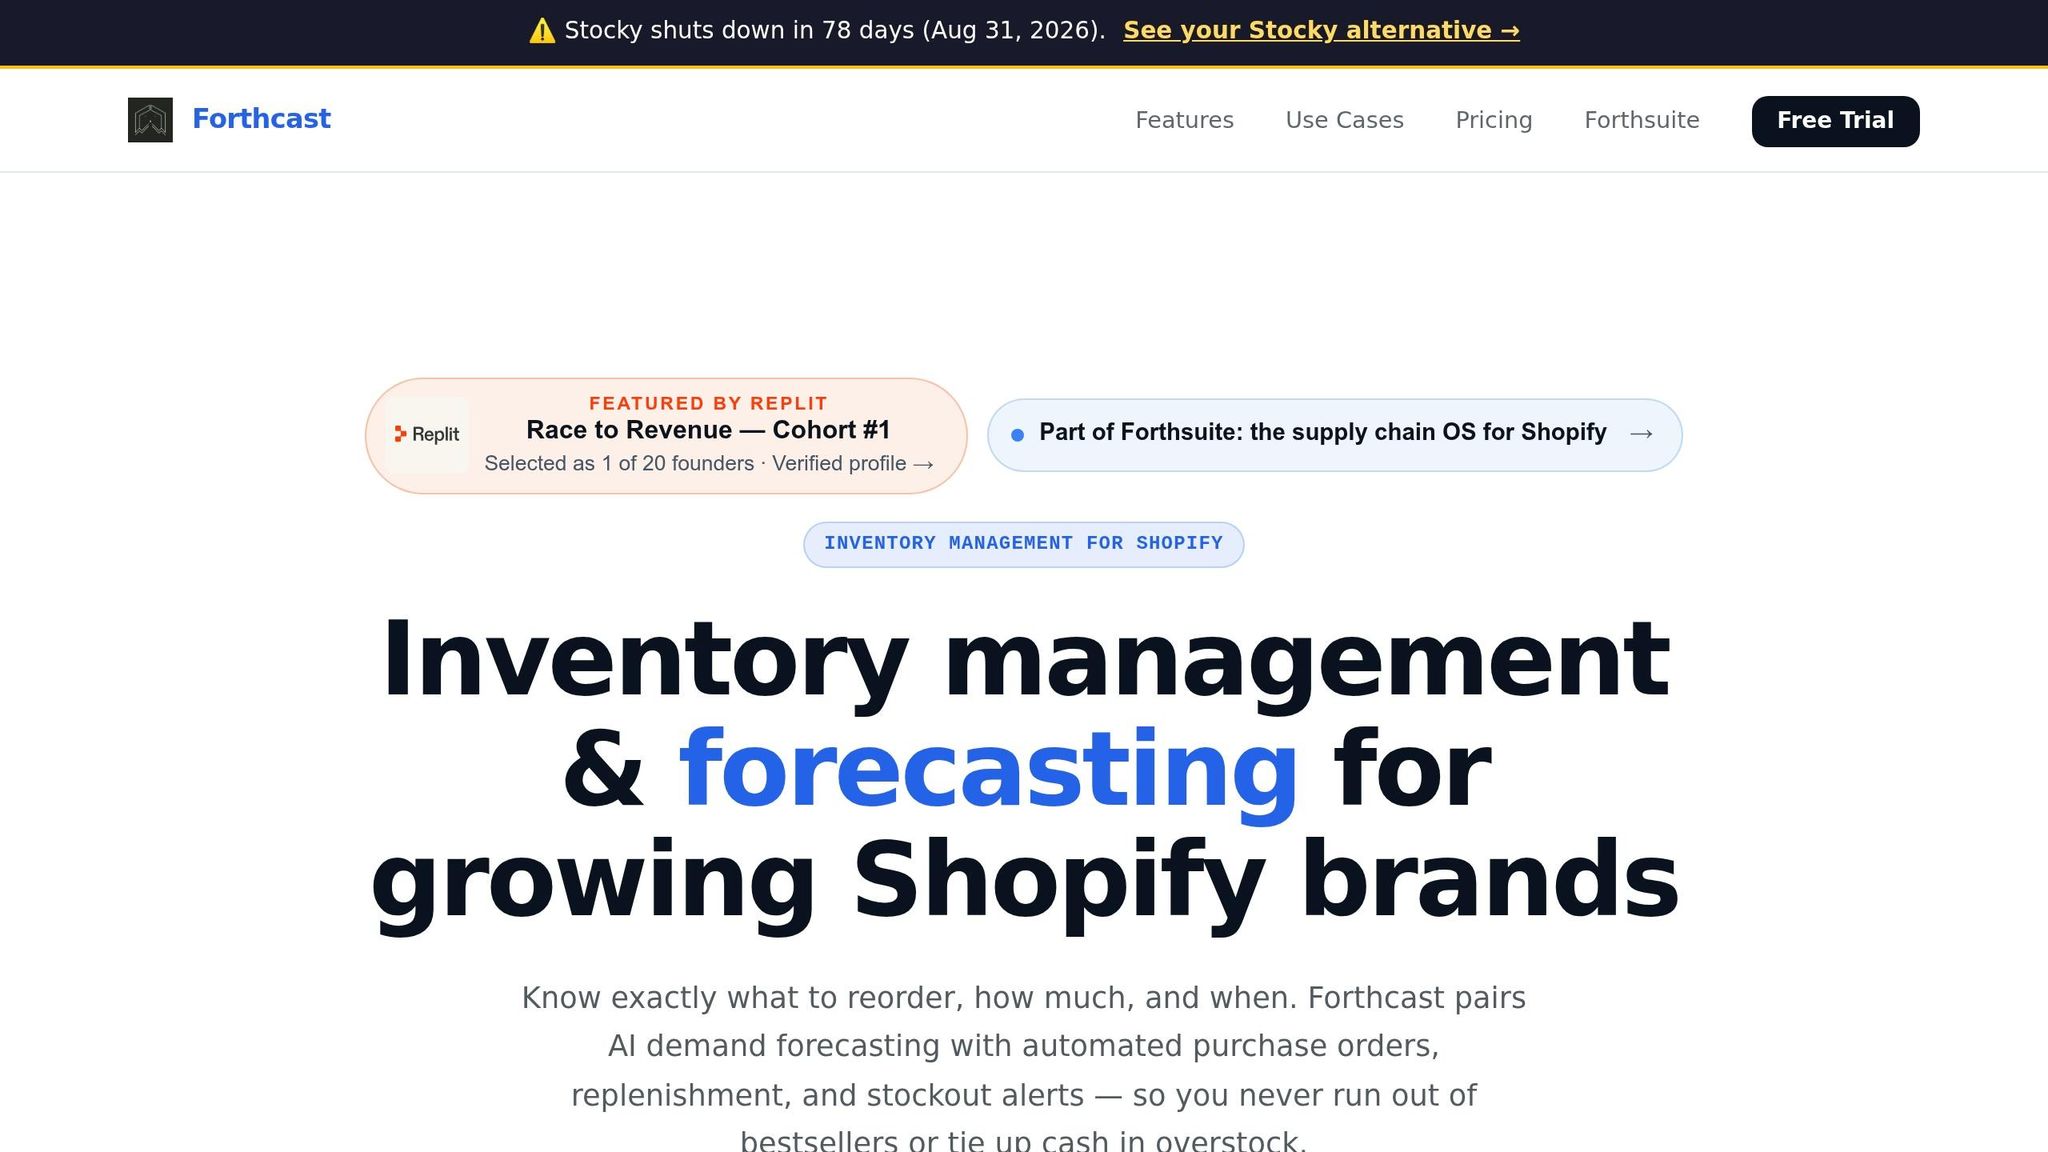
Try Forstock free for 14 days.
AI-powered demand forecasting and reorder automation for Shopify brands. No credit card required.