
Why Your Forecast Is Always Wrong (And Why That's Fine If You Do This)
Measure SKU forecast error, turn it into safety stock and reorder points, and buy from best/base/worst scenarios.
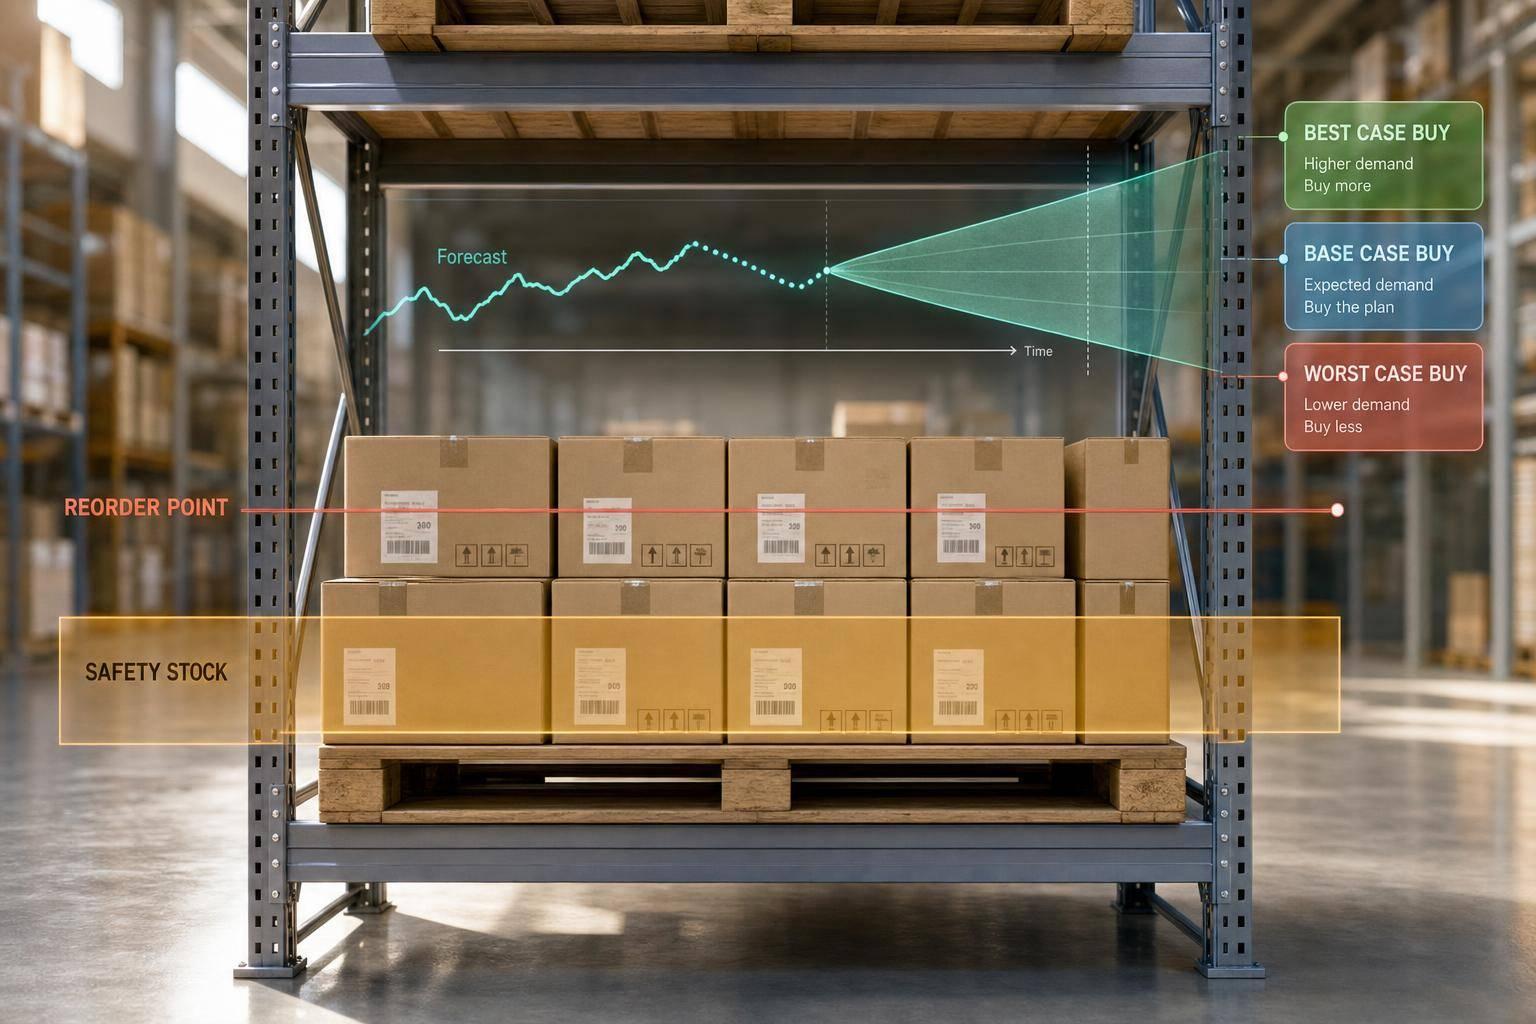
Why Your Forecast Is Always Wrong (And Why That's Fine If You Do This)
Your forecast will miss. The fix is to build your buying plan around that miss.
If I run a Shopify brand, I do not need a perfect forecast to make better inventory calls. I need to:
- measure forecast error by SKU and channel
- track bias, MAPE, and unit misses
- turn that error into safety stock and reorder points
- manage inventory by days of coverage
- plan buys across best-case, base-case, and worst-case demand
At the SKU level, misses of 20% to 50% are common, especially for promo-heavy products. Even a forecast that looks fine at a high level can still lead to bad orders if one channel runs hot and another slows down. That is why I focus less on being “right” and more on making sure each reorder has enough buffer, fits lead times, and does not tie up more cash than needed.
A simple example: if a SKU sells 20 units per day, lead time is 14 days, and safety stock is 140 units, the reorder point is 420 units. That turns forecast error into a clear buying rule instead of a guess.
Bottom line: I treat forecasting as a starting point, not the final answer. The better move is to measure the miss, set coverage targets, and buy from scenarios before I commit cash.
How to Setup Inventory Forecasting in Shopify using SKUSavvy

sbb-itb-f0fc809
Why Shopify forecasts break down at the SKU level
SKU-level forecasting gets messy fast. Each SKU has less history, more swings, and a lot less room for error. And that doesn’t just hurt forecast accuracy on paper. It changes what buyers reorder, when they reorder it, and how much cash gets tied up in inventory. Once you know where forecasts start to fail, the next move is to measure how far off they are.
Granular forecasts carry more error than category-level planning
When you zoom out to a full product category or an entire quarter, the highs and lows tend to smooth each other out. At the SKU level, that cushion disappears.
A low-volume SKU gives you very little signal. There just isn’t much data to lean on. Then one paid social campaign or one wholesale order hits, and demand can jump or drop in a way that throws the whole forecast off. A single influencer post changes the forecast, not the base demand.
Channel-level forecasting adds even more noise. Shopify, Amazon, and wholesale may pull from the same inventory pool, but they don’t move the same way. So if you look at Shopify in isolation, you miss part of the demand picture.
New launches make this even harder. If a SKU has only been live for a few weeks, there’s not enough history to separate launch-driven sales from normal demand. Early sales often run hot because of launch activity, which makes them a shaky baseline for what steady demand will look like later.
Bias and outdated spreadsheets make forecast error worse
Some forecast noise is built into the job. Process mistakes make it worse.
A lot of Shopify brands stack extra error on top by adding systematic bias. That usually shows up as growth assumptions that are too aggressive, or buying plans that get changed to avoid overstock. On top of that, manual edits and unsynced spreadsheets leave different teams working from different numbers.
That’s how you end up with a forecast that is roughly right but still leads to poor inventory calls. By the time the number gets to the buyer, it may already have been changed, trimmed, or overridden.
A forecast with 25% MAPE and +15% bias will systematically over-order. If you can see the bias clearly, you can start adjusting the buying plan around it.
Measure forecast error before you adjust inventory
Measure the miss before you touch inventory. First, confirm the gap is real. Then look at how large it is and which direction it leans.
Forecast accuracy tells you how close your forecast came to actual sales. Volatility shows how much forecasts move around over time. Bias tells you whether you tend to forecast too high or too low. If you forecast 1,000 units and sell 850, you’re overforecasting by about 18%. Put together, these metrics help you decide whether you need more buffer, a better baseline, or a different reorder point.
Track MAPE, bias, and unit error by SKU and channel
Three metrics do most of the work here. Used together, they show the size of the miss, the direction of the miss, and what that miss means in units.
| Metric | What it measures | Best use | Risk if ignored |
|---|---|---|---|
| MAPE | Average percentage miss across periods | Comparing forecast quality across SKUs with different sales volumes | Percentages can hide large unit gaps on top sellers |
| Bias | Consistent over- or under-forecasting direction | Detecting chronic overstock or stockout risk | You keep adding buffers to a broken forecast baseline |
| Absolute unit error | The unit difference between forecast and actual | Connecting forecast error directly to replenishment quantities | Percentage metrics look fine while key SKUs miss by hundreds of units |
Track these by SKU, variant, and channel. A product may look accurate at the total level while still being badly overforecast on paid social and underforecast on organic demand. That’s where teams get tripped up.
Use weekly tracking for fast movers and monthly tracking for slower SKUs. This gives you the error profile you need to set buffers, coverage, and reorder points with more confidence.
Use Forstock reporting to find where forecasts are consistently off
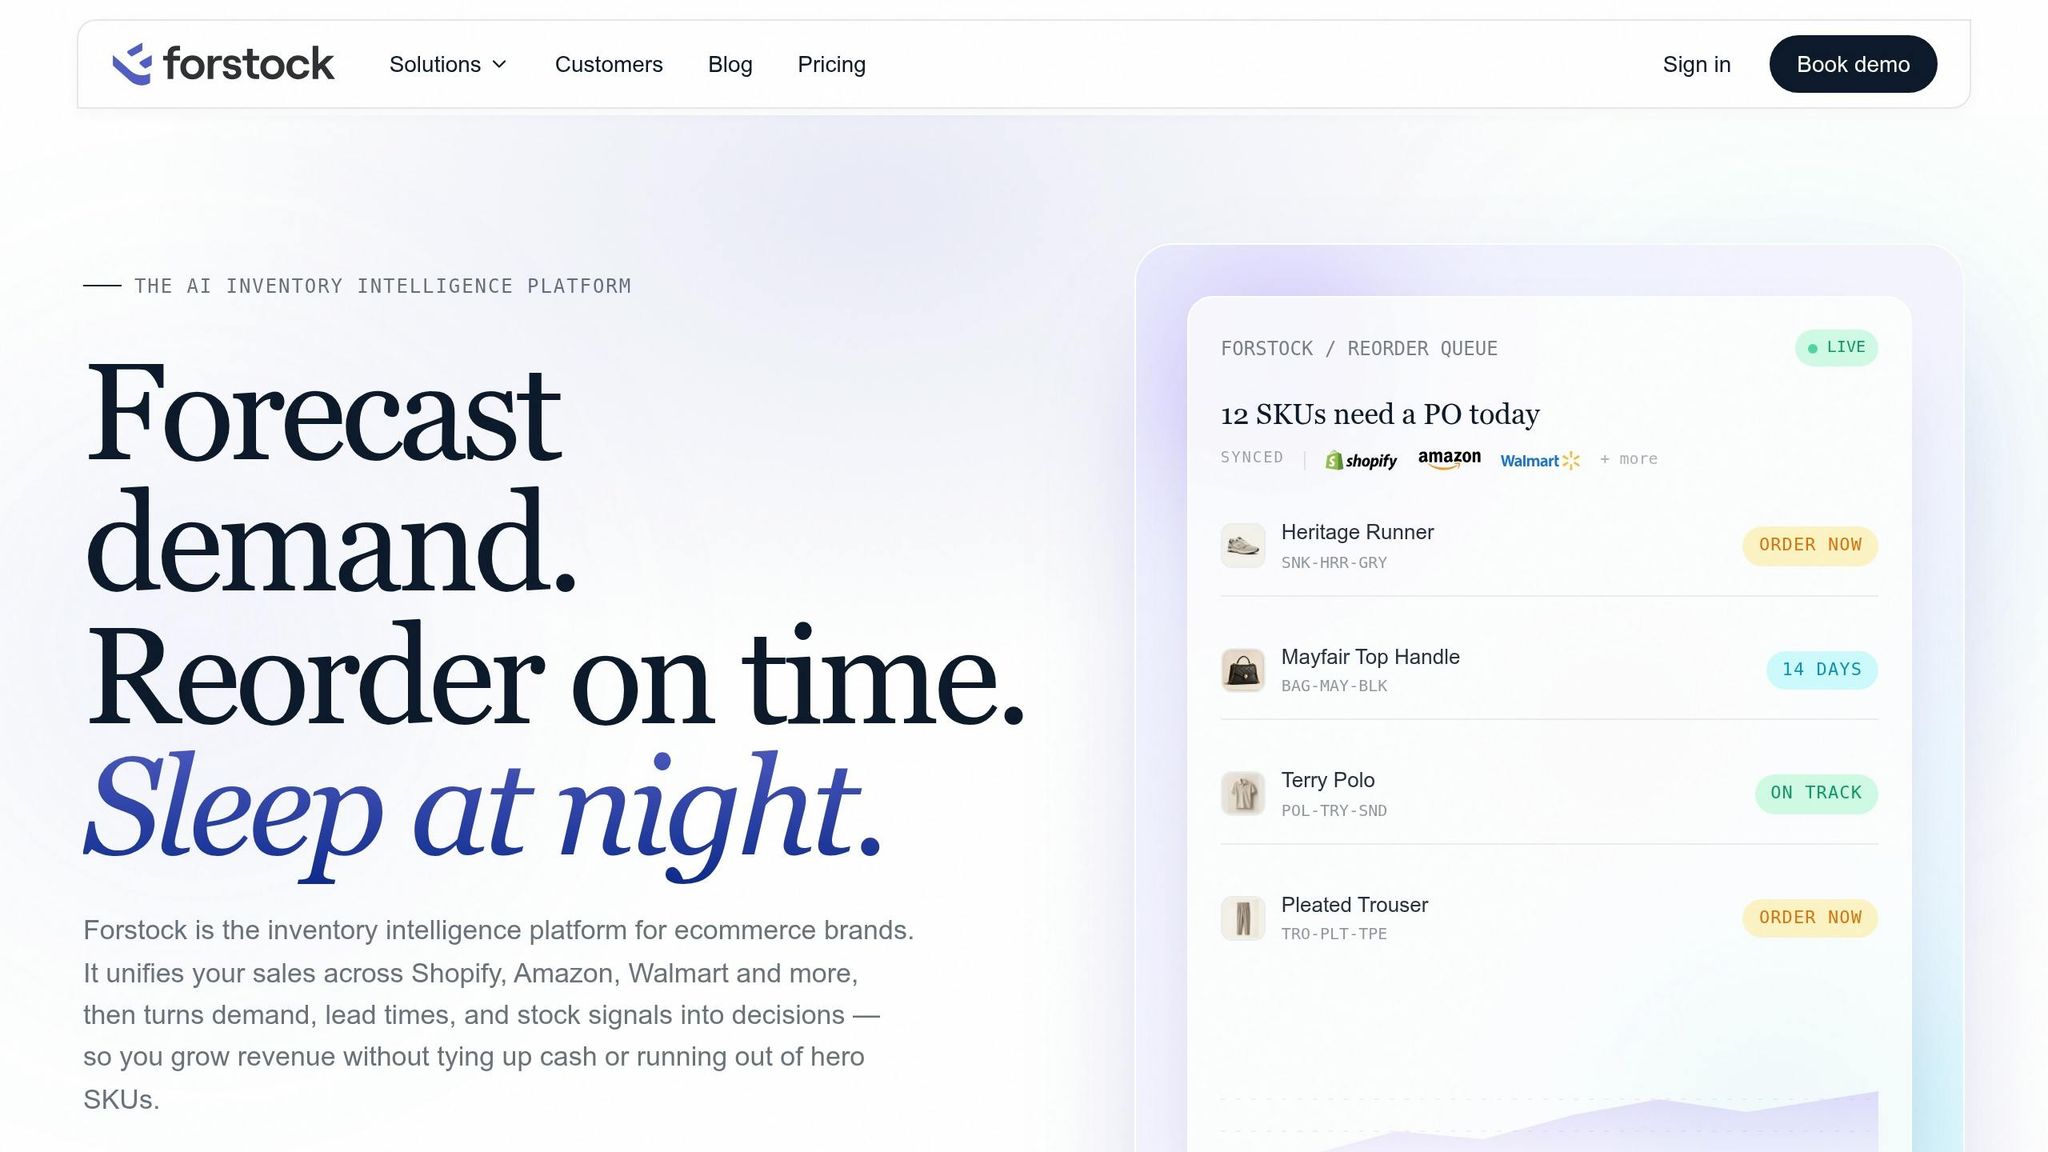
Forstock puts forecast accuracy reporting in one place, so you can see which SKUs, variants, and channels miss target most often. Planners can spot repeat misses week after week without digging through scattered reports.
Forstock also includes reporting that points to likely causes. If a SKU keeps missing, it can help show whether the issue comes from:
- a seasonality pattern the model isn’t picking up
- a channel mix shift
- a promo spike that inflated the baseline
- a weak starting forecast
That difference matters because the fix changes with the cause. A volatile SKU may need a larger buffer. A biased forecast may need a corrected baseline. Once you’ve measured the error, you can use it to set safety stock and reorder triggers.
Convert forecast error into safety stock, coverage targets, and reorder points
Once you've measured forecast error, the next step is to put it to work. That means turning it into safety stock, coverage targets, and reorder points. Those thresholds should then flow straight into your buy plan.
Safety stock is your buffer inventory. reorder point is the level that tells you when to buy, and improving reorder point accuracy is key to preventing stockouts. Coverage shows how long your inventory will last.
Set buffers based on measured variability, not gut feel
Not every SKU needs the same cushion. Volatile, seasonal, launch, and long-lead items usually need more buffer than stable, high-volume products.
If you want a more exact buffer, use a demand-and-lead-time formula: SS = Z × √(LT × σ_d² + D² × σ_LT²). You don't need to calculate this by hand for every SKU. But it helps to know what moves the number, because that makes the trade-off between cash and in-stock rates a lot clearer.
Manage inventory by days of coverage and reorder triggers
Raw unit counts don't mean much on their own. Coverage, or days of supply, fixes that. It's calculated as on-hand units divided by average daily demand, which gives you a time-based view of inventory across your catalog.
Set minimum coverage thresholds by SKU tier. If coverage is set to drop below that threshold before the next shipment arrives, that's your reorder trigger. Say a SKU sells 20 units a day, lead time is 14 days, and safety stock is 140 units. The reorder point is (20 × 14) + 140 = 420 units - about 21 days of coverage. That takes forecast error and turns it into a repeatable reorder rule. And that rule becomes the starting point for next week's purchasing calls.
Use Forstock to turn forecasts into replenishment actions
Manual planning often breaks down in the gap between setting a reorder point and placing the order. Forstock links forecasts, safety stock settings, coverage targets, lead times, and ordering constraints into replenishment recommendations, so the math updates on its own as demand data changes.
When a SKU's projected coverage drops below its minimum threshold, Forstock flags it and creates a recommended order quantity. Planners can then approve those suggested orders instead of rebuilding the calculations every week. From there, you can use those triggers to test best-case, base-case, and worst-case purchase plans.
Build buying plans that hold up when demand shifts
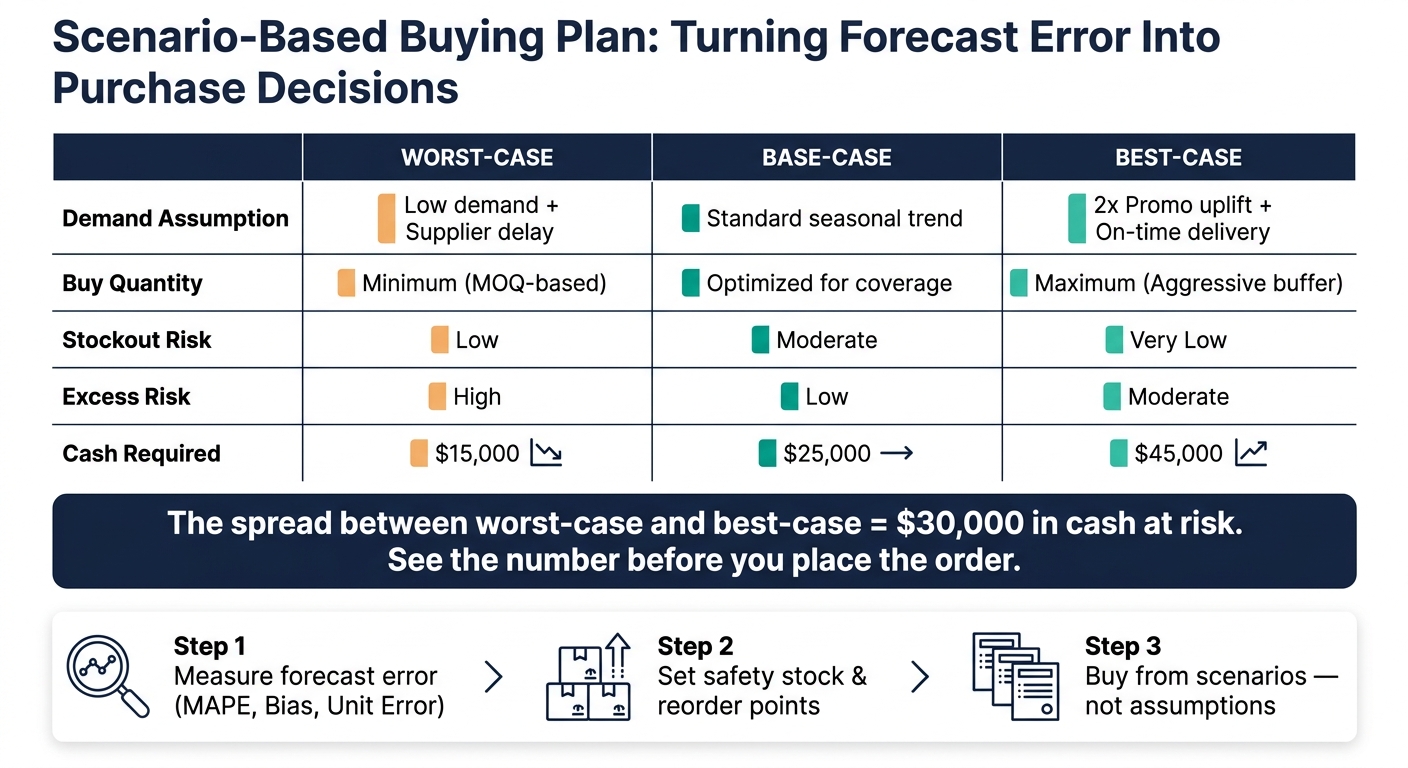
Forecast Error to Inventory Action: Best, Base & Worst-Case Buying Plan
Once you know your error, use it to shape purchase scenarios. A forecast is just the starting point. The smarter move is to buy from a range instead of betting on one number.
Plan best-case, base-case, and worst-case purchase outcomes
Orders often drift from plan because the buy changes in the real world. Shipping slows down, suppliers run late, and MOQ limits can force your hand. Scenario planning works when you adjust the assumptions that change buy quantity the most: promo demand lift, lead-time slips, and MOQ limits.
For each scenario, look at three things side by side: how much you’d need to buy, your overstock and stockout risks, and how much cash the order would tie up.
| Scenario | Demand assumption | Buy quantity | Expected stockout risk | Expected excess risk | Cash required |
|---|---|---|---|---|---|
| Worst-case | Low demand + Supplier delay | Minimum (MOQ-based) | Low | High | $15,000 |
| Base-case | Standard seasonal trend | Optimized for coverage | Moderate | Low | $25,000 |
| Best-case | 2x Promo uplift + On-time delivery | Maximum (Aggressive buffer) | Very low | Moderate | $45,000 |
That spread between the worst-case and best-case plans is $30,000 in cash. Seeing that number before you place an order changes the conversation. It stops being a gut call and becomes a clear risk choice.
Then you need to revisit those scenarios on a set schedule so they don’t go stale.
Run a weekly and monthly planning cadence in Forstock
Scenarios only matter if you come back to them often. The goal is a simple rhythm you can repeat without rebuilding the whole plan every week.
Weekly, review forecast misses from the prior week, flag any SKUs where coverage has dropped below threshold, and check anomaly alerts, especially sudden lead-time drift from suppliers. This is also the time to sync your marketing calendar into the planning layer, so upcoming promotions are buffered before demand spikes.
Monthly, step back and look at the bigger picture. Reconcile top-down revenue goals with bottom-up SKU demand, update your scenarios based on recent supplier performance, and run a PO risk snapshot to catch orders that may miss their delivery window before they hit cash flow or availability. Approved plans move straight to automated purchase orders in Forstock.
Review the scenarios weekly and monthly so each buy reflects current demand, lead times, and cash limits.
Conclusion: Better inventory decisions matter more than perfect forecasts
No U.S. Shopify brand gets SKU-level forecasts right all the time. That isn’t a knock on your team or your tools. Even strong models miss at the SKU level. What matters is simpler than that: does the forecast help you place a better buy?
So the goal isn’t prediction accuracy by itself. The goal is a repeatable buying process you can trust. In this article, that process comes down to a simple loop: measure where forecasts miss, add buffer based on that error, and test purchase orders against best-, base-, and worst-case demand before you commit cash. Track MAPE, bias, and unit error by SKU and channel. Turn that measured variation into safety stock and reorder points instead of relying on gut feel. Manage inventory by days of coverage so you know how long stock will last, not just how many units are sitting on the shelf.
Once that process is in place, the next move is discipline: buy from scenarios, not assumptions.
Forstock turns forecast error into safety stock, coverage targets, reorder triggers, and scenario-based purchase plans.
Then keep it simple. Start with your top 10 to 20 SKUs. Measure the last 8 to 12 weeks of forecast error. Set 21 to 35 days of coverage for high-volume SKUs, and define reorder triggers in Forstock. That’s enough to start turning imperfect forecasts into better inventory results: fewer stockouts, less excess stock, and more confidence each time you place an order.
FAQs
How much forecast error is normal by SKU?
Forecast error is normal at the SKU level. In most cases, accuracy lands somewhere between 70% and 85%.
Some product types do better than others:
- Stable products often see MAPE in the 20%–30% range
- Seasonal items often land closer to 30%–50%
That’s why it helps to set targets by SKU type instead of using one number for everything.
A solid benchmark is:
- 80%–90% for high-revenue Hero SKUs
- 70%–85% for core SKUs
- 50%–70% for new products
The big idea is simple: don’t chase perfect accuracy. That’s usually a losing game. Focus on variance, then use tools like safety stock or reorder triggers to deal with the gap between forecast and actual demand.
How do I set safety stock from forecast misses?
Set safety stock from what your demand and lead time actually look like, not from a fixed cushion that never changes.
A common formula is Safety Stock = Z × standard deviation of demand × √lead time.
Your Z-score depends on the service level you want:
- 1.65 for a 95% service level
- 2.33 for a 99% service level
This gives you a buffer tied to volatility. If demand jumps around or lead times stretch, safety stock goes up. If things stay steady, it stays lower. That’s a much better way to think about it than saying, “Let’s just keep an extra box or two on hand.”
If your data is thin, keep it simple. You can use the Max-Max method, or set a buffer based on average sales:
- 7–14 days of average sales in normal cases
- 21–30 days if suppliers are unreliable
Review safety stock at least every 90 days so it stays in line with current demand and supplier performance.
How often should I update reorder points and scenarios?
Update on a regular schedule: weekly for most SKUs, especially fast-moving or seasonal products, and monthly for slower-moving items with steadier demand.
Recalculate at least every 90 days using the latest 90 days of data. If anything material changes - supplier, lead times, major campaigns or promotions, stockouts or overstocks, or new SKUs - update right away. If you use automation, reforecast daily or weekly.
Keep reading
Try Forstock free for 14 days.
AI-powered demand forecasting and reorder automation for Shopify brands. No credit card required.