
Demand Forecasting for Shopify Brands: Methods Ranked From Spreadsheet to AI
Match forecasting method to SKU volatility — from spreadsheets and moving averages to seasonality models and AI.
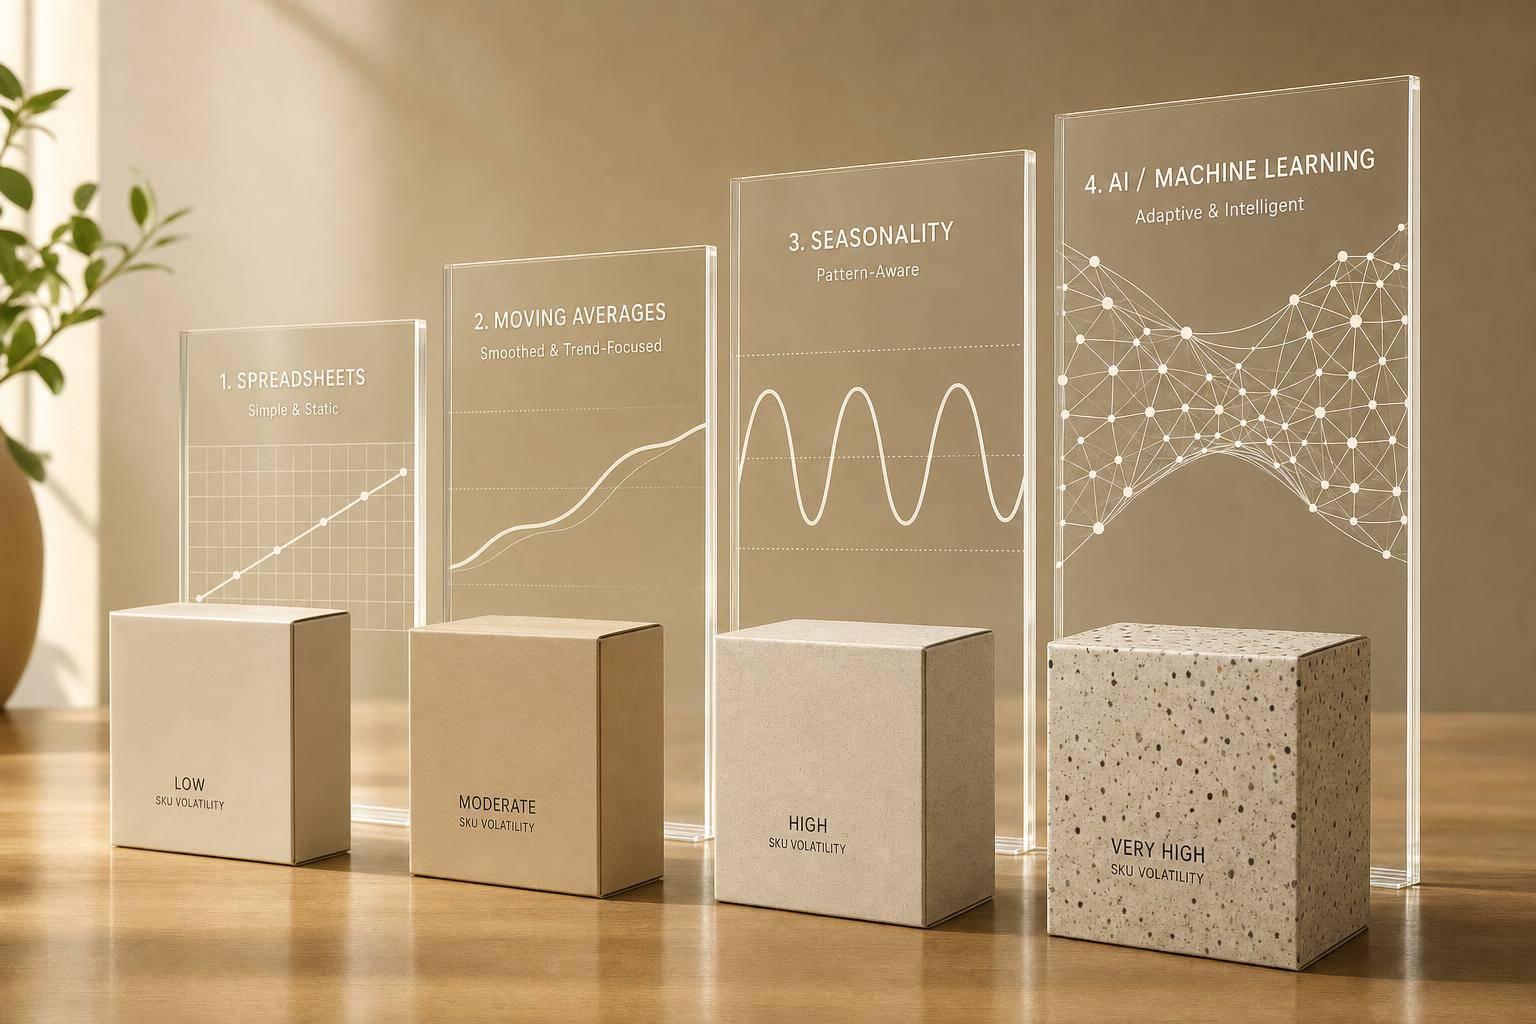
Demand Forecasting for Shopify Brands: Methods Ranked From Spreadsheet to AI
If your team is still checking forecasts by hand every day, your forecasting setup is probably too basic for your current demand. This article ranks 4 forecasting methods - manual spreadsheets, run-rate/moving averages, seasonality-adjusted models, and AI platforms - based on accuracy, scale, planning time, and day-to-day inventory use.
Here’s the short version: spreadsheets work for small, steady catalogs, moving averages help with simple repeat demand, seasonal models fit brands with clear peaks and promo calendars, and AI tools fit brands with lots of SKUs, more than one location, or sharp demand swings. That matters because stockouts cost retailers almost $1 trillion a year, and 63% of U.S. retail teams still struggle with inventory accuracy.
If I had to boil the whole article down, it would be this:
- Use spreadsheets when demand is stable and your catalog is small.
- Use run-rate or moving averages when you want a simple step up from manual planning.
- Use seasonality-adjusted models when holiday peaks and promo lift drive sales.
- Use AI forecasting when manual planning starts missing stockouts, launch demand, and multi-location complexity.
- Switch methods when planner time, stock errors, and forecast misses start piling up.
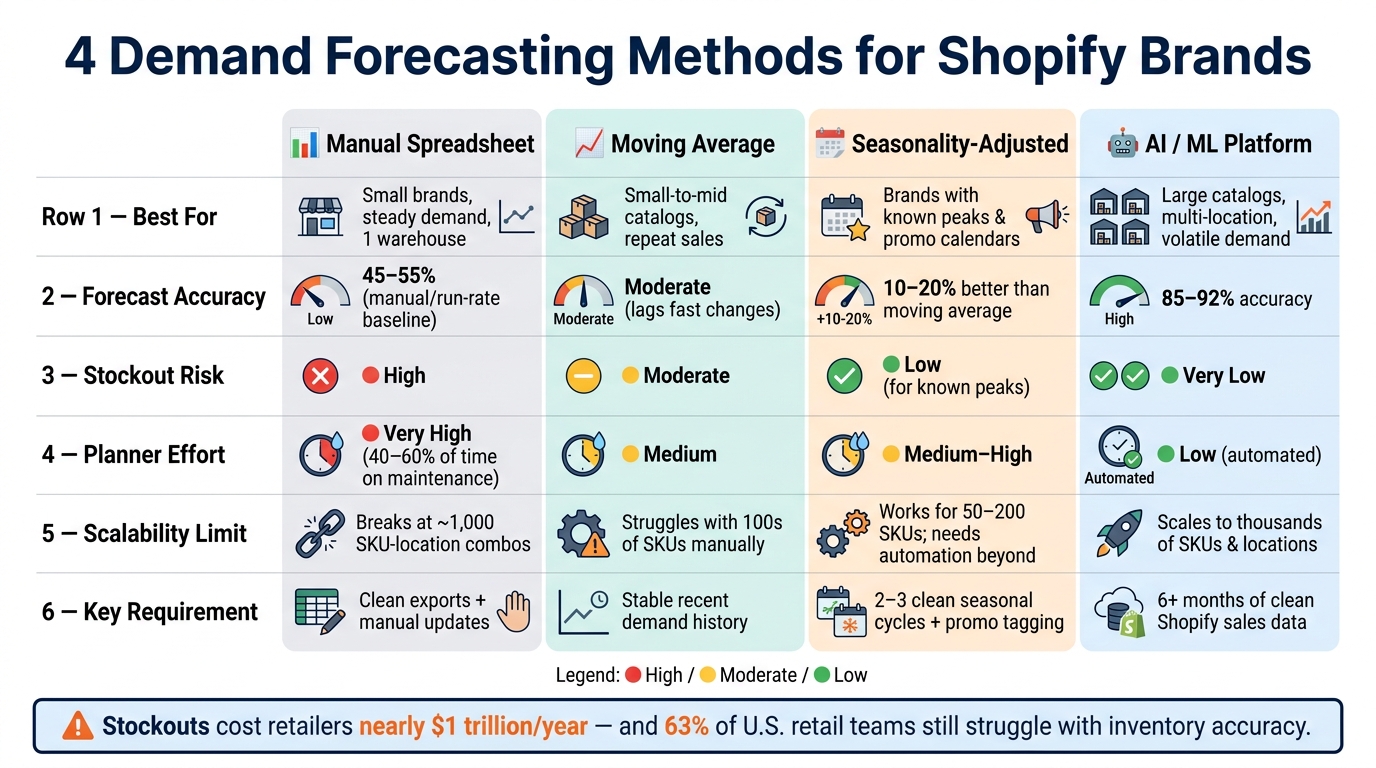
4 Demand Forecasting Methods for Shopify Brands: Ranked by Accuracy, Effort & Scale
Quick Comparison
| Method | Best for | Main strength | Main limit |
|---|---|---|---|
| Manual spreadsheet | Small Shopify brands with steady demand | Full control and low setup | Breaks down as SKU count and channel count grow |
| Run-rate / moving average | Small-to-mid catalogs with repeat sales | Simple math and steady routine planning | Lags when demand changes fast |
| Seasonality-adjusted statistical | Brands with known peaks and promo calendars | Better prep for seasonal demand | Needs clean history and promo tagging |
| AI forecasting platform | Large catalogs, more locations, volatile demand | Better forecast quality and automated planning | Needs at least 6 months of clean sales data |
Bottom line: the right method depends less on company size and more on how unstable your SKU demand is. The rest of the article shows where each option fits, where it starts to fail, and when it makes sense to move up.
sbb-itb-f0fc809
1. Manual Spreadsheet Forecasting
Manual spreadsheet forecasting takes Shopify order history from Excel or Google Sheets, groups sales by SKU or variant, and projects demand with formulas or simple month-to-month comparisons. The planner sets the assumptions, product priorities, and safety stock. That gives you control, but it also brings in subjectivity.
If you run a small catalog with one warehouse, one main sales channel, and fairly steady demand, a well-kept spreadsheet can handle basic replenishment. It doesn't scale well, and it isn't fast once things get messy, but it still works for very small catalogs. A structured workbook with tabs for historical sales, forecast formulas, reorder points, and purchase order planning can give a small team enough visibility to make replenishment calls before peak demand hits.
Accuracy
Spreadsheet accuracy is usually fine when demand stays steady. But it drops fast during promotions, launches, or seasonal swings because most manual models lean on 30- or 60-day averages that miss seasonality and product life-cycle shifts.
They also don't update or compare models on their own, so a single stockout or promo spike can throw off the next forecast.
Scalability
Scalability is the big weak spot. As SKUs, channels, and what-if scenarios pile up, the manual work grows with them. At that point, spreadsheets start to break down beyond roughly 1,000 active SKU-location combinations.
Multi-channel brands can hit data reconciliation issues too. Shopify, Amazon, wholesale, and retail orders often need to be merged before planning. Then file versions start multiplying, and the single source of truth disappears. In mid-market operations, planners may spend 40% to 60% of their time maintaining spreadsheets instead of analyzing the business.
That same simplicity that makes spreadsheets easy at the start can make them less dependable as the business gets bigger.
Planning Speed and Operational Usefulness
For a small catalog, a monthly update may take less than an hour. But that speed fades once you're cleaning data, reconciling channels, or rebuilding formulas after an assortment change. The deeper issue is that spreadsheets sit apart from live Shopify data, so every update starts with a manual export.
Because spreadsheets rely on manual exports instead of live Shopify data, inventory records can drift 15% to 25% from actual stock. That increases the risk of stockouts and overstock.
Once demand gets steady enough for averages to hold up, the next step is a historical run-rate model.
2. Historical Run-Rate and Moving-Average Models
Run-rate and moving-average models are the next step once spreadsheets start to feel too manual. They’re simple to set up, easy to follow, and they cut down on month-to-month guesswork. Think of them as the first lightweight step up from manual spreadsheet forecasting. Planning stays simple, but the forecast becomes more consistent.
A run-rate model takes recent sales, turns them into a daily or weekly pace, and projects that pace forward. If a SKU sold 300 units in the last 30 days, the run rate is 10 units per day. Over a 45-day replenishment window, that points to 450 units of demand before any safety stock is added.
A moving-average model works in much the same way, but it smooths demand over a set window, such as 7, 14, or 30 days. That way, one sharp spike or one slow week doesn’t throw off the full forecast. Run rate is the faster option. Moving averages are steadier because they smooth short-term noise.
Accuracy
These methods tend to work best when demand is stable and the recent past looks a lot like the near future. That’s the catch: in ecommerce, that doesn’t always hold up.
Stockouts can create zero-sales days, which pull the average down and make demand look weaker than it was. Promotions, influencer drops, and seasonal surges do the opposite. They push the average up and can lead to over-ordering after the spike fades. Once the average is off, reorder points and manual and automated purchase orders drift off too.
A practical way to handle this is to build the baseline from normal weeks only, then add a separate estimate for known demand events.
Scalability and Planning Speed
For growing Shopify brands with a small catalog and short lead times, these models can handle weekly or monthly purchase planning without much friction. Setup is quick, the math is easy to explain, and the output is simple to check.
The trouble starts when the catalog gets larger. Different SKUs often need different lookback windows. Fast movers may need 2 to 4 weeks, while stable replenishment SKUs may need 3 to 6 months. Doing that by hand across hundreds of SKUs gets old fast.
Where These Models Fall Short
The main weakness is lag. These models react to demand after it happens.
If demand is climbing fast, a moving average will trail actual sales. If demand drops after a promotion ends, the model may keep pushing reorders that no longer make sense. And on their own, these methods don’t account for seasonality. A brand with a holiday spike can end up underforecasting right before the busy season unless someone steps in and adjusts the numbers by hand.
For brands that are still figuring out which SKUs are steady and which ones swing around, run-rate and moving-average models can serve as a useful operational bridge. Brands dealing with holiday peaks, promo surges, or longer lead times usually need a forecast that adjusts the baseline, not one that simply extends it.
3. Seasonality and Promotion-Adjusted Statistical Forecasts
These models tend to fit ecommerce better because they split demand into three parts: baseline demand, seasonality, and promo lift. The basic formula is simple: base demand × seasonal factor × promo uplift = forecast.
That matters because this is the first approach that handles known spikes without jumping straight into full automation. Unlike run-rate models, it fixes for predictable peaks instead of treating every week like it's the same.
Accuracy
With two to three clean seasonal cycles and a stable promo calendar, this model will usually beat run-rate forecasting. Seasonal indexing plus promo drivers can improve accuracy by about 10% to 20% compared with simpler benchmarks.
But the model is only as good as the data behind it. You need stockout-free sales history before calculating seasonal indices. If not, the model can understate true demand. Promo periods also need to be separated from baseline weeks. Otherwise, discount-driven spikes can inflate the seasonal curve and throw off later forecasts.
That edge can vanish fast when demand stops following the old pattern. New product launches, sudden TikTok virality, or a move from DTC to wholesale can all make past seasonality a poor guide. Research also notes that forecast errors during promotions can get very large. One study reported errors ranging from 30% to 140% of total sales for specific products during campaigns. So even a well-built model comes with a lot of uncertainty during heavy promo periods.
Scalability and Planning Speed
For catalogs in the 50- to 200-SKU range, an analyst can usually manage these models in Python or R and refresh them each month. Past that point, manual workflows start to break down.
Scaling to thousands of SKUs across many channels calls for:
- Automated data pipelines
- Batch forecasting processes
- Tools that can generate forecasts by SKU, category, and region without manual reconfiguration each cycle
Operational Usefulness
When connected to purchasing, these forecasts can produce SKU-level buy lists with timing and quantities using Shopify purchase order apps. That helps teams order seasonal inventory and lead time adjustments earlier and set aside extra stock for planned promotions.
Once demand starts shifting faster than rule-based adjustments can keep up with, the next step is AI-powered forecasting. At that stage, the main limit is speed. If inputs change every day, forecasting needs automation, not manual adjustment.
4. AI-Powered Forecasting and Inventory Planning Platforms
When rule-based adjustments stop keeping pace with daily demand swings, AI-powered platforms can do a lot more of the heavy lifting. They split demand into baseline, trend, seasonality, and promo lift, then choose the right model for each SKU automatically. That becomes far more useful when SKU count, channel count, and demand volatility all climb at once.
Accuracy
The biggest gains in accuracy usually come from fixing two pain points that older methods often mishandle: stockouts and new product launches.
When a SKU sells zero units because it was out of stock, simpler models may treat that as weak demand. Forstock spots those gaps and rebuilds the lost demand, so future plans reflect actual demand instead of the limit imposed by inventory.
New SKUs bring a different problem. With no sales history, there’s not much for a forecast to lean on. Forstock handles this with similar-item modeling, matching the new product to comparable items by category, price, and seasonality to estimate the first order from similar products.
AI-powered forecasting can reach 85–92% accuracy, compared with 45–55% for manual or run-rate approaches.
Scalability and Planning Speed
Forstock supports variant- and location-level forecasting across catalogs that would otherwise take a lot of manual work. Every new order, refund, and exchange syncs automatically from Shopify, which keeps forecasts up to date without messy exports. The platform also keeps a rolling 12-month forecast horizon, which helps a lot before major purchase orders.
For brands with a long tail of low-volume SKUs, a hybrid setup tends to work well:
- Use the AI model for core products with 6+ months of sales history
- Use simple moving averages for newer or slower-moving items
That makes AI most helpful when forecasts need to stay current across a large number of SKUs and locations.
Operational Usefulness
Forecasts don’t just sit in a dashboard. They feed straight into replenishment work. Forstock generates SKU-level reorder recommendations with timing and quantities, flags stockout and overstock risk, and includes ABC prioritization so teams can spend more time on the inventory that matters most. Operators can also make manual overrides for known events, like an upcoming wholesale order or a planned marketing push, that the historical model can’t see yet.
There’s one catch: clean data matters. Untagged promotions, merged SKUs, or missing sales weeks can cause ML to amplify noise instead of filtering it out. In plain terms, bad inputs lead to shaky forecasts.
Make sure your Shopify data is connected, your product catalog is standardized, and you have at least six months of reasonably clean sales history before relying on these models. Those trade-offs stand out even more when you compare forecasting methods side by side.
Pros and Cons by Forecasting Method
No single forecasting method fits every Shopify brand. The best pick comes down to a few practical things: how many SKUs you manage, how much demand swings around, and how much time your team can spend planning.
That choice has a direct effect on day-to-day operations. It shapes your stockout risk, how much extra inventory you carry, and how fast you can react when demand shifts.
Use the table below to compare methods based on operational impact, not just forecast theory:
| Forecasting Method | Stockout Risk | Excess Inventory | Planner Effort | Replenishment Speed | Best Fit | Typical Breaking Point |
|---|---|---|---|---|---|---|
| Manual Spreadsheet | High | High (over-ordering to be safe) | Very High | Low - reactive only | Early-stage / startup | When manual updates stop keeping pace |
| Moving Average | Moderate | Moderate | Medium | Moderate | Growth stage with steady demand | When demand becomes volatile or promotions aren't tagged |
| Seasonality-Adjusted / Statistical | Low for known peaks | Low | Medium–High (requires tagging) | High - anticipatory | Established brands with clear seasonality | When promo data is missing or patterns become irregular |
| AI / ML Platforms | Very Low | Very Low | Low | Very High | Scaling or multi-location brands (often requiring multi-warehouse optimization) | Dirty or incomplete historical data |
The big takeaway is simple: your forecasting method should match SKU volatility, not just brand size. A smaller brand with fast-changing demand may need a more advanced setup than a larger brand with stable sales.
Conclusion
The right forecasting method isn't about using the most advanced tool on the market. It's about picking the approach that fits your current sales complexity.
If your current setup still gives you enough accuracy, can scale with your workload, moves fast enough, and doesn't take too much planning effort, a spreadsheet can still do the job for a small, stable catalog. But that tends to change once manual checks turn into daily work, stockouts keep showing up, promotions throw off the numbers, or you're juggling multiple locations and a large long-tail catalog. At that point, spreadsheets usually hit their limit.
Use these signals to decide when it's time to move on:
| Signal | What It Means |
|---|---|
| Team is manually verifying forecast numbers daily | Planning process is fragile and error-prone |
| Stockouts keep happening despite reordering | Demand signals aren't being captured accurately |
| New SKUs are planned without a structured launch model | Future demand lacks a structured model |
| You manage multiple locations or channels | Spreadsheets struggle to keep one view of demand and inventory |
| Promotions regularly distort forecasts | Promo lift isn't being separated from base demand |
These are the signs that manual forecasting no longer fits the shape of your business. When they start piling up, an AI platform like Forstock becomes the better option. It can handle stockout-recovered demand, per-SKU model selection, and automatic flagging of dirty data in cases where low accuracy, poor scalability, slow planning, and weak operational usefulness turn manual methods into a liability.
There is one catch: AI works best when you have at least 6 months of clean sales history. Without that, the model can amplify bad data.
Move past spreadsheets when manual forecasting slows replenishment, leads to more stockouts, or skews purchase planning. Keep human oversight in place. AI should handle the math, and your team should approve the plan.
FAQs
How do I know when spreadsheets are no longer enough?
You’ve outgrown spreadsheets when they stop keeping up with change and small errors start turning into inventory problems.
A few signs tend to show up fast. Watch for forecast error above about 25% to 30% MAPE, repeated forecast bias, more stockouts, or days of supply dropping below lead time plus your safety buffer.
Spreadsheets also start to crack when demand is volatile or seasonal, when you’re dealing with a lot of SKUs or sales channels, or when updates happen only once a quarter and the forecast goes stale.
Which forecasting method fits a brand with seasonal promotions?
Use a seasonal forecast that separates promo lift from baseline demand and adjusts for predictable seasonality.
Here’s the idea: mark promo periods so they don’t inflate your normal sales velocity. If you skip that step, a short sales spike can make everyday demand look higher than it is.
Then apply a seasonal factor or seasonal decomposition to account for patterns you expect, like holiday peaks, back-to-school bumps, or slower off-season weeks. Keep the promo lift tied to the campaign window ONLY, so you don’t over-order once the promotion ends.
How much clean sales data do AI forecasts need?
For reliable AI-driven demand forecasting, at least 12 months of clean historical sales data is usually the right starting point. That gives the system enough time to spot seasonal patterns, recurring shifts, and longer-term trends.
That said, not every model needs a full year to be helpful. Some AI models can still produce useful insights with as little as 6 months of data. If you want better accuracy, 12 to 24 months is the sweet spot in most cases.
For new products, the bar is lower. Useful insights may begin to show up with just 4 to 8 weeks of data.
Keep reading
Try Forstock free for 14 days.
AI-powered demand forecasting and reorder automation for Shopify brands. No credit card required.