
How Far Ahead Should a CPG Brand Forecast? Horizons by Channel and Lead Time
Set channel-specific forecast horizons—DTC, marketplaces, wholesale, and retail—based on lead time, buffer, and order cadence to avoid stockouts.

How Far Ahead Should a CPG Brand Forecast? Horizons by Channel and Lead Time
Most CPG brands do not need one forecast horizon. They need different horizons by channel, based on lead time, order cycle, and risk. If I use the same 60-day view for Shopify, Amazon, wholesale, and retail, I can end up with stockouts in slower channels and too much inventory in faster ones.
Here’s the short answer:
- Shopify DTC: often 8–16 weeks
- Amazon FBA: often about 13 weeks to 4 months
- Wholesale: often 12–20 weeks for core items
- Retail: often 16–24 weeks for base replenishment and 26–52 weeks for seasonal sets
The rule is simple: forecast far enough ahead to cover total lead time, buffer, and time until the next order point. In other words:
- Minimum horizon = lead time + buffer + time to next order
- Review cadence is separate from horizon
- Shared inventory should be planned from total demand across channels
- Imported and seasonal SKUs usually need a longer view than domestic core items
A few numbers stand out:
- Imported SKUs can see end-to-end lead times of 42–100 days before extra buffer
- Q4 can add 1–2 more weeks from congestion and receiving delays
- New SKUs can run below 40% forecast accuracy in their first 12–18 months
- High-velocity SKUs moving 100+ units per week should often be replenished at least every 3 weeks
| Channel | Typical Horizon | Main Reason |
|---|---|---|
| Shopify DTC | 8–16 weeks | Fast demand shifts, but lead time still matters |
| Amazon FBA | 13 weeks to 4 months | FBA receiving delays and replenishment cycle |
| Wholesale | 12–20 weeks | Bigger orders and earlier account commitments |
| Retail | 16–24 weeks; 26–52 weeks seasonal | Fixed ship windows, MABD dates, and penalties |
If I had to boil the article down to one point, it would be this: set the shortest safe horizon per channel, then stretch it only for long lead times, seasonality, promotions, or shaky supply.
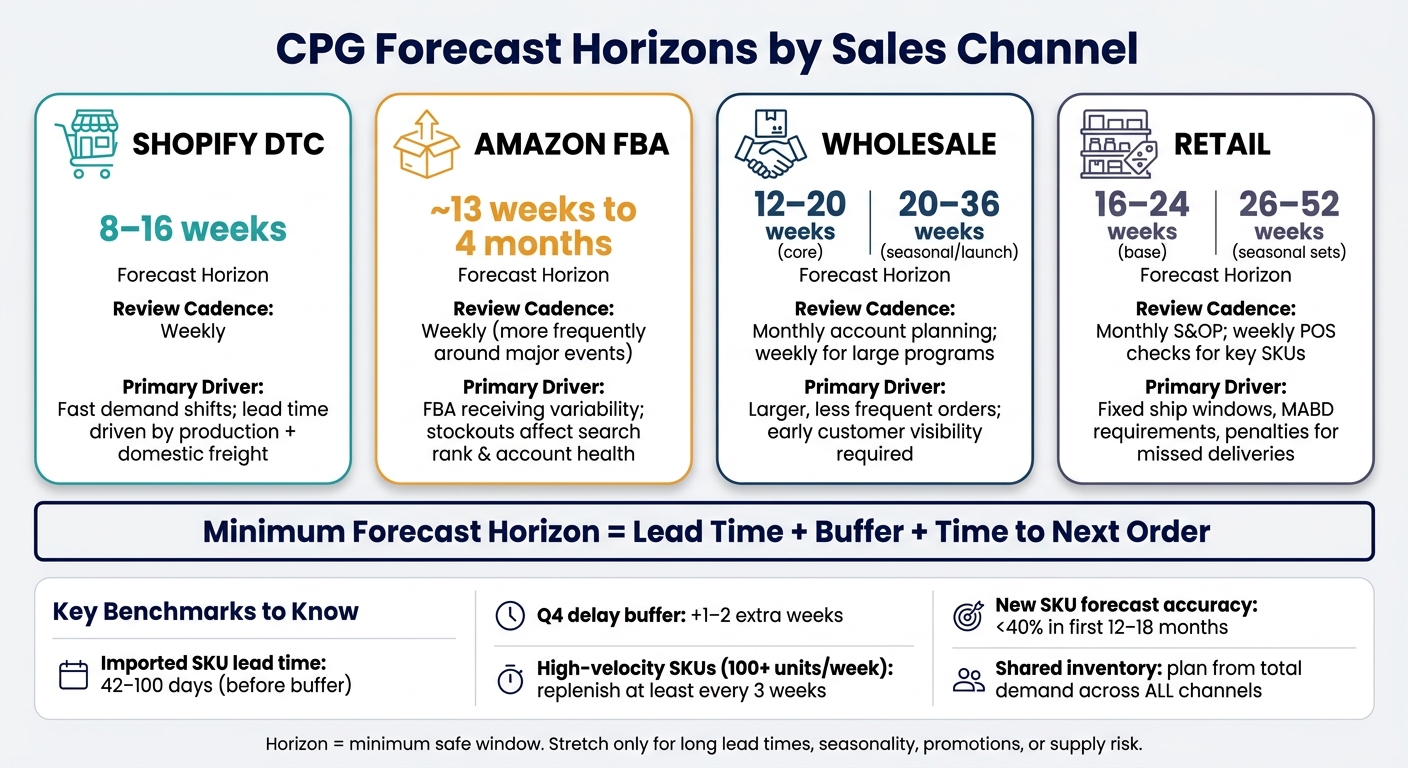
CPG Forecast Horizons by Sales Channel
The Art & Science of Inventory Forecasting for CPG Founders | Webinar
sbb-itb-f0fc809
Calculate your minimum horizon from end-to-end replenishment lead time
Start with the lead-time floor from the last section. Then add a buffer and enough coverage to reach the next order point.
Minimum forecast horizon = end-to-end lead time + buffer + time to the next order. Total lead time means the full span from PO placement to the moment inventory is received, processed, and ready to sell across your channels.
Break lead time into the steps that affect reorder timing
Production is only the first leg of the trip. After that, factor in supplier prep and packing, quality inspection, export paperwork and freight forwarder handoff, international freight, customs clearance, domestic transit, warehouse or 3PL receiving, and any last-mile prep before the item is sellable.
For an imported SKU, end-to-end lead time can easily land in the 42–100 day range before buffer, based on the supplier, shipping lane, and channel.
And here’s the part teams often miss: delays near the finish line can tack on another week or more.
Add buffer for variability and peak-season delays
Use PO history to compare average lead time with the 80th or 90th percentile for each supplier. The difference between those numbers is your buffer. So if your imported beverage SKU averages 50 days end-to-end but hits 63 days at the 80th percentile, your minimum forecast horizon should be closer to 9 weeks, not 7.
Give your fastest-moving SKUs a bigger buffer. A stockout on a top seller usually hurts more than carrying a few extra weeks of safety stock for Shopify stores.
In Q4, add 1–2 extra weeks for congestion and receiving delays. It also helps to set a separate peak-season lead time parameter for any supplier shipping into that period.
Lead-time components table by step and supplier
Fill each row with actual shipment history for the SKU and supplier.
| Lead-Time Step | Typical Range | Main Driver | What to Track |
|---|---|---|---|
| Supplier production | 15–45 days | Raw material availability, co-man scheduling | Actual days from PO sent to ready for pickup |
| Quality inspection | 1–3 days | Third-party vs. in-house, volume | Inspection failure rate and reschedule frequency |
| Supplier prep/packing | 2–5 days | Labeling, cartonization complexity | Days from production complete to shipped |
| Export paperwork and freight forwarder handoff | 2–5 days | Documentation accuracy, routing changes | Days from ready to ship to cargo departure |
| Ocean freight | 20–35 days | Port pair, congestion, carrier reliability | Actual port-to-port transit per shipment |
| Customs clearance | 1–5 days | Product category, documentation accuracy | Days held, escalation rate |
| Domestic transit to 3PL or fulfillment center | 1–5 days (parcel/FTL); 5–10 days (LTL/rail) | Distance, carrier, mode | Actual delivery days vs. carrier estimate |
| 3PL receiving and putaway | 1–3 days (normal); 5–10+ days (Q4) | 3PL capacity, appointment availability | Dock-to-stock days per inbound shipment |
| Final prep (kitting, labeling, stickering) | 1–5 days | Labor capacity, volume, SKU complexity | Days from received to available-to-sell in WMS |
A domestic supplement SKU may need a 10-week minimum horizon: 5 weeks of lead time, 1 week of buffer, and 4 weeks until the next order. An imported RTD beverage may need about 18 weeks: 10 weeks of lead time plus an 8-week order cycle.
Tie those numbers to each channel. Those 10 and 18 weeks shape when you need to place POs to stay in stock on Shopify DTC or Amazon, versus a wholesale or retail account.
This sets the minimum horizon. Next, adjust it by channel.
Set forecast horizons by channel: Shopify DTC, Amazon, wholesale, and retail

Once you’ve set the lead-time floor, the next step is to adjust the horizon by channel.
Some channels move fast. Others lock you into longer buying cycles. So the horizon shouldn’t be one-size-fits-all.
Shopify DTC and Amazon: tighter cycles and faster updates
Shopify DTC and Amazon can change in a hurry. A promo, paid campaign, or marketplace event can push demand up fast. That’s why weekly monitoring helps. But it doesn’t mean you can plan on a shorter window.
Your forecast still needs to cover lead time plus buffer.
For Shopify DTC, that often means an 8–16 week horizon. For Amazon FBA, it’s often about 13 weeks for weekly or biweekly replenishment, or about 4 months for monthly replenishment. And there’s a catch: inbound checks and receiving delays can push out when inventory becomes sellable. So even if stock is on the way, it may not be ready to sell right away.
High-velocity SKUs - those moving 100+ units per week - should be replenished at least every three weeks. That means your forward view has to stay well ahead of that rhythm.
A simple way to handle this:
- Update the next 4–6 weeks every week
- Keep the full horizon in place for production and PO decisions
The same lead-time logic still applies here. The difference is that wholesale and retail need earlier commitments.
Wholesale and retail: longer commitments and earlier visibility
Wholesale and retail work on longer buying cycles. Orders tend to be bigger, less frequent, and tied to fixed ship windows. That changes the planning game.
If you miss a ship window or an MABD date, the fallout can be expensive: chargebacks, lost shelf space, and scorecard damage.
Wholesale usually needs 12–20 weeks for core items, with longer windows for launches. Retail usually needs 16–24 weeks for base replenishment and 26–52 weeks for seasonal sets.
Channel comparison table: horizon, review cadence, and key driver
| Channel | Typical Forecast Horizon | Review Cadence | Primary Driver |
|---|---|---|---|
| Shopify DTC | 8–16 weeks | Weekly | Fast demand shifts; visible stockouts; lead time driven by production plus domestic freight |
| Amazon FBA | About 13 weeks to 4 months, depending on replenishment cycle | Weekly, more frequently around major events | FBA receiving variability; stockouts affect search rank and account health |
| Wholesale | 12–20 weeks for core items; 20–36 weeks for seasonal/launch programs | Monthly account planning; weekly for large programs | Larger, less frequent orders; customer order cycles require early visibility |
| Retail | 16–24 weeks for base replenishment; 26–52 weeks for seasonal sets | Monthly S&OP / joint business planning; weekly POS checks for key SKUs | Fixed ship windows, MABD requirements, and penalties for missed deliveries |
These channel horizons then become the starting point for SKU-level coverage and reorder timing.
Convert the horizon into SKU-level order timing and coverage
Turn the channel horizon into three working numbers at the SKU level: days of cover, reorder point, and PO date. The horizon tells you how far out to look. Coverage tells you when it’s time to place the next order.
Set coverage targets by SKU and channel mix
Start with total demand across all channels, not one channel at a time. If inventory is shared, the math has to follow shared demand. So if a SKU sells 40 units/day on Shopify, 60 on Amazon, and 100 through wholesale, plan around the combined 200 units/day, not three separate demand streams.
Days of cover is straightforward: divide on-hand inventory by average daily demand across all channels. If you have 6,000 units on hand and demand is 200 units/day, that gives you 30 days of cover.
Coverage targets should change by SKU type. Fast-moving A-items, including top sellers and products that get promoted often, usually need 6–8 weeks of cover. Their safety stock often lands in the 14–28 day range, with top sellers usually closer to 21–28 days.
Core replenishment products with steady demand and long overseas lead times often need 8–12 weeks of cover. Launch SKUs need a different playbook. Start with 3–4 weeks of cover and review them weekly. Then add more coverage only after early sell-through data shows the demand signal is real.
A simple decision rule for shared inventory
When one SKU supports more than one channel, use a plain rule: plan to the longest end-to-end lead time, protect the most time-sensitive commitments first, and update weekly.
When coverage drops below target, the reorder point tells you when to act. Set that reorder point to cover the longest exposure, which is often wholesale or retail commitments. If a SKU has average daily demand of 200 units, a 45-day lead time, and safety stock of 4,500 units, the reorder point is 13,500 units.
Project inventory by week using this formula:
- On-hand + inbound - forecast sales
Place the order when that projected inventory hits the reorder point. The PO release date is the date of that hit, minus the supplier lead time.
Adjust the horizon when demand or supply is less predictable
When demand gets choppy or supply starts to look shaky, the forecast horizon needs more room. Start with a base horizon for each channel, then stretch it only when the SKU needs extra runway.
Match planning window length to demand stability and supply source
Stable, domestically sourced SKUs can often run on a forecast horizon that’s just a little longer than lead time. Say you have a snack made in the Midwest with a 3–4 week lead time. In many cases, an 8–10 week forecast horizon is enough, with a weekly review.
Volatile or imported SKUs are a different story. A beauty product made in South Korea and shipped by ocean freight to the West Coast can have a true end-to-end lead time of 10–12 weeks. For that kind of SKU, planners often look 6–9 months out to cover key retail commitments and promo windows.
Seasonal items, heavily promoted SKUs, and new launches also need more forward visibility. New SKUs often post forecast accuracy below 40% in their first 12–18 months after launch. That’s a tough start, but not an unusual one. The safer move is to plan them conservatively and review them more often until sell-through settles down.
Promotions need extra padding too. A good rule is to extend the forecast horizon by one full lead-time cycle on both sides of the event window.
Horizon decision table and key takeaways
Use the table below to adjust forecast horizon length based on lead time and demand variability.
| Lead Time | Demand Variability | Suggested Forecast Horizon | Review Cadence |
|---|---|---|---|
| Short (≤4 weeks) | Stable | 8–10 weeks | Weekly |
| Short (≤4 weeks) | High | 12–16 weeks | Weekly |
| Medium (5–8 weeks) | Stable | 12–16 weeks | Weekly or biweekly |
| Medium (5–8 weeks) | High / seasonal | 16–24 weeks | Weekly, with promo planning |
| Long (≥9 weeks, imports) | Stable | 24 weeks (6 months) | Monthly for wholesale/retail; weekly for DTC |
| Long (≥9 weeks, imports) | High / strategic | 24–36 weeks | Quarterly scenario planning |
One thing to keep in mind: a longer forecast horizon does not mean the forecast is locked. A 6-month view still needs weekly or monthly updates as fresh data comes in. Use these ranges to set SKU-level coverage targets and reorder timing.
FAQs
How do I choose a forecast horizon for a new SKU?
For a new SKU, use a proxy-based approach because there’s no sales history yet. Start with a similar product in your catalog - one with a close price point, category, and target buyer - and use its early sales data as your starting point.
Then adjust that forecast by hand based on things like planned ad spend, influencer campaigns, and pre-order volume. After 60 to 90 days, when the SKU has built up its own sales history, switch to standard quantitative forecasting.
What if the same SKU sells across multiple channels?
Bring demand data from every channel into one demand signal. If you only track one channel, like Shopify, and ignore Amazon or wholesale, you can under-order and end up with stockouts.
Use the combined daily sales velocity to set reorder points for purchasing. At the same time, review each channel’s patterns and lead times on their own, because replenishment needs can change by channel or location.
How often should I update a long-range forecast?
Update long-range forecasts on a set schedule, and adjust them as new data comes in. That keeps them useful instead of letting them go stale.
For most items, a monthly or quarterly review is enough. But during peak seasons, promotions, or when you're dealing with fast-moving goods, it's smart to check forecasts weekly or even more often.
It also helps to compare actual sales with your projected numbers on a regular basis. That simple habit can sharpen your forecast over time and help you spot misses before they turn into bigger problems.
Keep reading
Try Forstock free for 14 days.
AI-powered demand forecasting and reorder automation for Shopify brands. No credit card required.