Carrying Costs vs. Profit Margins
Excess inventory drains e‑commerce profits—cut carrying costs with forecasting, precise reorder points, and liquidation.

Carrying Costs vs. Profit Margins
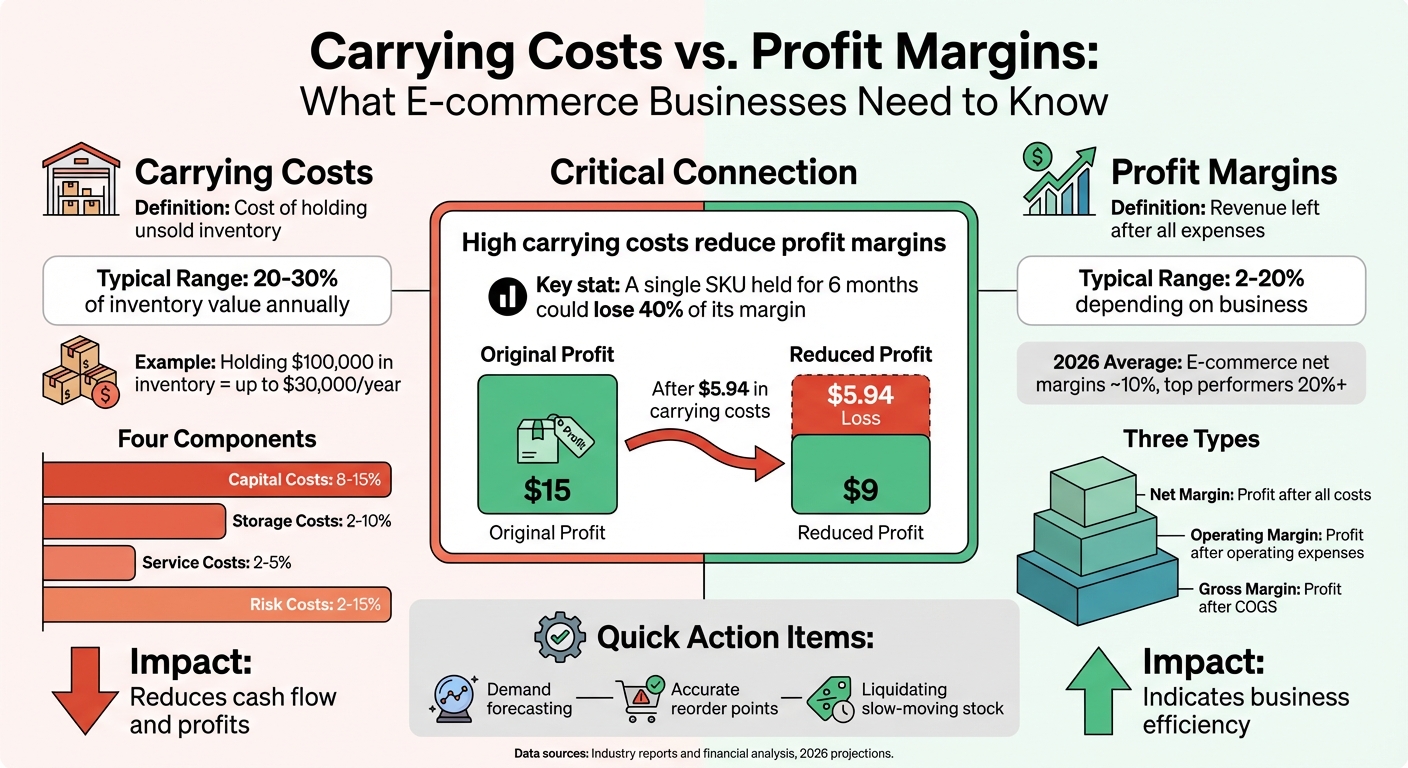
Carrying costs and profit margins are two critical factors that directly impact the financial health of any e-commerce business. Here’s what you need to know:
- Carrying Costs: These are the expenses of holding unsold inventory, including storage, labor, insurance, and risks like obsolescence. They typically range from 20% to 30% of total inventory value annually. For example, holding $100,000 in inventory could cost up to $30,000 per year.
-
Profit Margins: This measures how much profit remains after all expenses. Common types include:
- Gross Margin: Profit after deducting COGS.
- Operating Margin: Profit after operating expenses.
- Net Margin: Profit after all costs, taxes, and interest.
In 2026, average e-commerce net margins hover around 10%, with top performers reaching 20% or more.
Key Insight:
High carrying costs reduce profit margins by adding non-revenue-generating expenses. For instance, a single SKU held for six months could lose 40% of its margin due to carrying costs alone.
Solution: Managing inventory efficiently - using tools like demand forecasting, setting accurate reorder points, and liquidating slow-moving stock - can cut carrying costs and protect profitability.
Quick Comparison:
| Feature | Carrying Costs | Profit Margins |
|---|---|---|
| Definition | Cost of holding unsold inventory | Revenue left after all expenses |
| Typical Range | 20%–30% of inventory value annually | 2%–20%, depending on the business |
| Impact of Increase | Reduces cash flow and profits | Indicates business efficiency |
Balancing these two metrics is key to maintaining profitability while meeting customer demand.
Carrying Costs vs Profit Margins: Key Differences and Impact on E-commerce Profitability
That Inventory Sitting on Your Shelf is Costing You Thousands #ProfitTips #Operations
sbb-itb-f0fc809
What Are Carrying Costs?
Understanding carrying costs is key to managing inventory expenses while protecting profit margins. Also known as holding costs, these are the expenses tied to storing unsold inventory. They encompass a range of costs, such as interest on inventory loans, insurance premiums, labor, and losses from product damage or obsolescence.
For e-commerce businesses, high carrying costs can eat directly into profits. These costs often point to inefficiencies like underused warehouse space or slow-moving "dead stock". As the Nventory Team puts it:
Every dollar sitting on your warehouse shelf is a dollar that isn't working for you. It's not funding your next product launch, not paying for ads that drive revenue, and not earning interest.
- Nventory Team
Data reveals that roughly 25% to 30% of inventory in an average warehouse falls into the "dead stock" or slow-moving category. That's nearly a third of inventory investment that could be draining resources instead of fueling growth.
Components of Carrying Costs
Carrying costs are generally divided into four main categories:
- Capital Costs: These are often the largest portion, representing about 8% to 15% of inventory value. They include interest on loans used to buy inventory and the opportunity cost of money that could have been invested elsewhere, like in marketing or new product development.
- Storage Costs: These cover the physical costs of storing inventory. Think warehouse rent, utilities (especially for climate-controlled spaces), labor, and equipment. Storage costs usually fall between 2% and 10% of inventory value.
- Service Costs: This category includes insurance premiums, property taxes, and fees for inventory management tools. These typically account for 2% to 5% of inventory value.
- Risk Costs: These capture the financial risks of holding inventory, such as shrinkage (from theft or errors), obsolescence of outdated items, and damage during storage. For example, the National Retail Federation estimates shrinkage costs U.S. retailers over $100 billion annually. Risk costs can range from 2% to 15%, with industries like fashion facing higher rates due to fast-changing trends.
| Component | Typical Range (% of Inventory Value) | E-Commerce Examples |
|---|---|---|
| Capital Costs | 8% – 15% | Interest on loans; missed returns from unused funds |
| Storage Costs | 2% – 10% | Warehousing fees; labor; climate-controlled utilities |
| Service Costs | 2% – 5% | Insurance; property taxes; software fees |
| Risk Costs | 2% – 15% | Seasonal obsolescence; shrinkage; product damage |
With these categories in mind, the next step is calculating your carrying costs.
How to Calculate Carrying Costs
The formula for carrying costs is simple:
(Total Annual Carrying Costs / Average Inventory Value) × 100
Start by finding your average inventory value. Add the beginning and ending inventory values for the year and divide by two. For instance, if you started with $450,000 in inventory and ended with $550,000, your average inventory value would be $500,000.
Next, total the four cost components. For example, if capital costs are $50,000, storage costs $66,000, service costs $10,250, and risk costs $22,500, your total annual carrying costs would be $148,750. Divide this total by the $500,000 average inventory value and multiply by 100. The result - 29.8% - means the business spends nearly 30 cents for every dollar of inventory held annually.
Another useful metric is the per-unit carrying cost, calculated by dividing total annual carrying costs by the average number of units in stock. This helps pinpoint which items may be dragging down profitability.
What Are Profit Margins?
Profit margins are a way to measure how much profit a business keeps from its revenue after covering expenses. For e-commerce businesses, understanding profit margins helps determine exactly how much of every sales dollar is left after costs.
There are three main types of profit margins:
-
Gross Profit Margin: This looks at profitability at the product level, before factoring in operating costs. It's calculated as:
((Revenue - COGS) / Revenue) × 100. -
Operating Profit Margin: This reflects how efficiently a business runs after covering operating expenses like marketing, software, and salaries. The formula is:
(Operating Income / Revenue) × 100. -
Net Profit Margin: Often referred to as the "bottom line", this shows what's left after deducting all expenses, including COGS, operating costs, interest, and taxes. It's calculated as:
((Revenue - Total Expenses) / Revenue) × 100.
For context, in 2026, the average Shopify store had a net profit margin of 10%, with top-performing stores reaching 20% or more. However, even with a gross margin of 45%, a business can still end up with no net profit after factoring in fees, advertising, returns, and storage costs. In retail, the average gross margin is around 30.57%, but net profit margins shrink to just 6.05% after operating costs.
How Inventory Costs Affect Profit Margins
Inventory costs play a major role in shaping profit margins. These carrying costs, which are part of COGS, can significantly impact a business's profitability. For instance, each SKU might incur around $1 per month in carrying costs, meaning a product held for six months could lose up to 40% of its margin.
Carrying costs include storage fees, insurance, and risks like obsolescence. These not only inflate COGS but also reduce net margins by creating inefficiencies. On top of that, overselling can lead to cancellation fees and added customer service costs, which range from $15 to $40 per incident. As Sarah Jenkins aptly stated:
"Every dollar locked up in excess inventory is a dollar that cannot be spent on marketing, product development, or channel expansion."
In 2026, rising costs put even more pressure on margins. Advertising consumed 15% to 30% of revenue, shipping and fulfillment accounted for another 8% to 15%, and return rates climbed to 18% - with apparel returns often exceeding 30%. Additionally, cost-per-click rates on major platforms rose by 18% to 22% year-over-year. Combined with high carrying costs, these challenges make inventory optimization essential for protecting profit margins.
Profit Margin Benchmarks for E-Commerce
Knowing where your profit margins stand compared to industry benchmarks can help identify whether inventory costs are eating into profitability. Here's a snapshot of healthy e-commerce margins in 2026:
| Level | Gross Margin | Net Margin | Status |
|---|---|---|---|
| Low End | ~30% | 5% or less | Danger Zone |
| Average | ~37% | 10% | Industry Standard |
| Optimal | 40%+ | 15% | Sustainable Growth |
| Top Performers | 50%+ | 20%+ | Excellent Unit Economics |
Margins vary widely by industry. Luxury and beauty brands often achieve gross margins of 50% to 70%, thanks to strong brand loyalty and low price sensitivity. Fashion and apparel typically range from 40% to 60%, though high return rates can hurt net margins. Home and garden products usually fall between 35% and 50%, while electronics face tighter margins of 15% to 30% due to intense competition.
Improving inventory management can directly boost these benchmarks. For instance, reducing average inventory by 15% can save thousands in carrying costs annually, which directly improves net margins. Strategies like using ABC analysis to focus on high-value stock, automating reorder points to avoid surplus, and liquidating dead stock within 60 to 90 days are effective ways to counteract the impact of carrying costs. Next, we'll explore how comparing carrying costs with profit margins can reveal areas for financial improvement.
Carrying Costs vs. Profit Margins: Direct Comparison
Grasping the relationship between carrying costs and profit margins can lead to smarter inventory decisions. Profit margins tell you how much of each sale you actually keep, while carrying costs reveal the price you pay just to hold onto unsold inventory. These two metrics are closely connected - when carrying costs rise, profit margins shrink. Understanding this dynamic highlights how even small improvements in managing inventory can have a big impact on profitability.
How High Carrying Costs Reduce Profit Margins
High carrying costs chip away at your profit margins by adding expenses that don’t generate any revenue. Unlike the Cost of Goods Sold (COGS), which is tied to sales, carrying costs are ongoing fixed expenses that accumulate every day your inventory sits unsold.
One of the biggest contributors is capital cost - the money locked up in inventory that could otherwise fund growth or earn interest. This cost typically ranges from 8% to 15% of your inventory’s value annually. Since 2021, rising interest rates have made this even more burdensome, with the cost of holding inventory increasing by 40%.
Here’s an example: holding $100,000 in inventory could generate up to $30,000 in annual carrying costs. For a business with $500,000 in revenue and a 10% net profit margin, that $30,000 represents a staggering 60% of total profits. The longer inventory sits, the worse it gets. A single SKU held for six months might rack up $5.94 in carrying costs, eating into 40% of a $15 profit. And when you finally discount the item to clear it out, you’re often selling at a loss after factoring in those accumulated costs.
Beyond the direct financial hit, excess inventory ties up capital, limiting your ability to invest in growth opportunities. Whether it’s launching a new product, funding a marketing campaign, or taking advantage of bulk discounts from suppliers, these missed chances are real costs - even if they don’t show up on your profit-and-loss statement. Tools like Forstock can help streamline inventory management, reducing these costs and protecting your profit margins.
Comparison Table: Carrying Costs vs. Profit Margins
Here’s a quick breakdown of how these two metrics differ:
| Feature | Carrying Costs | Profit Margins |
|---|---|---|
| Definition | Total cost of storing and maintaining unsold inventory | Percentage of revenue left after all expenses are deducted |
| Calculation | (Total Holding Expenses ÷ Average Inventory Value) × 100 | (Net Income ÷ Total Revenue) × 100 |
| Typical Range | 20% to 30% of inventory value annually | 2% to 8% net margin, depending on the industry |
| Financial Role | Operating expense that reduces cash flow and profits | Indicator of business efficiency and financial health |
| Impact of Increase | Higher costs directly lower net profit margins | Higher margins provide resilience and growth capital |
The numbers tell a clear story. Cutting carrying costs from 30% to 20% on $100,000 of inventory saves $10,000 a year. For a business generating $500,000 in revenue with a 10% net profit margin, that savings boosts total profit by 20%. Similarly, improving price realization by just 1% can lead to an 8% jump in operating profit. These examples show how fine-tuning inventory management can drive significant financial gains.
How to Balance Carrying Costs and Profit Margins
Finding the right balance between carrying costs and profit margins is crucial for any e-commerce business aiming to stay profitable. The goal is to maintain enough inventory to meet demand without tying up too much capital or risking costly stockouts. Achieving this requires a shift from guesswork to data-driven decision-making, factoring in lead times, demand trends, and supplier reliability. Let’s dive into how Forstock’s AI tools and practical inventory strategies can help fine-tune this balance.
Using Forstock for Inventory Optimization

Forstock offers Shopify brands a way to tackle the key challenges that inflate carrying costs and shrink profit margins. Its AI-powered demand forecasting accounts for variables like lead time fluctuations and demand spikes across Shopify POS, online stores, and social platforms. This minimizes the need for excessive safety stock while reducing the risk of stockouts.
Another standout feature is Forstock’s automated purchase order system, which ensures you’re ordering the right quantities at the right time. With real-time inventory tracking and a unified dashboard, you can monitor stock levels across multiple locations and make informed purchasing decisions based on hard data - not intuition. For most e-commerce businesses, aiming for a service level between 95% and 97.5% strikes a good balance between holding costs and avoiding missed sales. These insights pave the way for operational strategies that further reduce carrying costs.
Practical Inventory Management Tips
Beyond leveraging advanced tools like Forstock, adopting these proven inventory strategies can help keep carrying costs in check:
-
Set precise reorder points: Use this formula to calculate when to reorder:
(Average Daily Unit Sales × Average Lead Time in Days) + Safety Stock.
This method helps avoid both overstocking and last-minute panic orders. -
Calculate safety stock accurately: Ditch vague rules like "days of supply" and instead use:
Z-score × Standard Deviation of Lead Time × Average Daily Demand.
For a 95% service level, use a Z-score of 1.65, meaning you’d face a stockout roughly once every 20 replenishment cycles. - Negotiate better supplier terms: Instead of negotiating order by order, commit to 4–6 orders over a year. This approach can lower Minimum Order Quantities (MOQs) and secure better payment terms, improving cash flow without straining supplier relationships.
- Filter demand signals: Separate organic sales trends from temporary spikes caused by flash sales or promotions. This ensures forecasting models don’t overestimate future demand based on short-term anomalies.
Conclusion
Grasping the connection between carrying costs and profit margins is more than a numbers game - it’s a key factor in driving growth and making smart use of capital. As Matt Putra, Managing Partner at Eightx, explains:
Inventory is the single largest cash trap in ecommerce. Every dollar of excess stock is a dollar you can't spend on marketing, can't use to negotiate better supplier terms, and can't keep in the bank as a safety net. - Matt Putra
The numbers back this up. Carrying costs typically eat up 20% to 30% of inventory value annually, while excess inventory poses a $250+ billion problem across the U.S.. What’s more, many e-commerce businesses underestimate these costs by at least 30%, often ignoring capital and risk-related expenses. This miscalculation can have serious consequences.
To tackle this, brands need to shift from gut-based decisions to data-driven inventory management. This involves pinpointing reorder points and fine-tuning safety stock levels based on actual demand patterns. Tools like Forstock simplify this process by offering AI-powered demand forecasting and real-time inventory insights across all sales channels.
The fastest-growing brands aren’t the ones hoarding inventory - they’re the ones keeping just enough stock to meet demand while freeing up cash for growth-focused initiatives like marketing, product innovation, and supplier negotiations. By using precise forecasting, automated reordering, and smart inventory strategies, businesses can strike the right balance between carrying costs and profit margins. This approach not only improves cash flow but also protects profitability, addressing the challenges of excess inventory head-on.
FAQs
Which carrying cost component is hurting my margins the most?
The costs associated with inventory capital - like the purchase price, loan interest, and missed opportunities - tend to hit profit margins the hardest. These costs can eat up 6% to 12% of the inventory's value every year, significantly limiting cash flow that could otherwise fuel growth. While expenses like storage, insurance, and the risk of goods becoming outdated also play a role, capital costs are usually the biggest drain because they lock up essential funds.
What inventory turnover rate prevents carrying costs from reducing net profit?
An inventory turnover rate of 8 to 12 times per year hits the sweet spot between keeping carrying costs low and boosting net profit. This range supports steady sales while managing inventory holding expenses effectively.
How do I choose the right service level and safety stock for my store?
To find the right balance between stockouts and overstocking costs, you need to determine the appropriate service level and safety stock. Start by setting your target service level - say, 95%. Then, analyze both demand and lead time variability. Applying the safety stock formula will help you account for these fluctuations. Tools like Forstock can simplify this process by using real-time data to automate calculations. This approach helps you maintain optimal stock levels, avoiding unnecessary inventory while reducing the risk of missed sales.
Keep reading
Try Forstock free for 14 days.
AI-powered demand forecasting and reorder automation for Shopify brands. No credit card required.