5 Metrics to Monitor in Shopify Inventory Analytics
Track five essential Shopify inventory metrics—turnover, sell-through, days on hand, accuracy, and inventory-to-sales—to optimize stock levels and cash flow.
5 Metrics to Monitor in Shopify Inventory Analytics
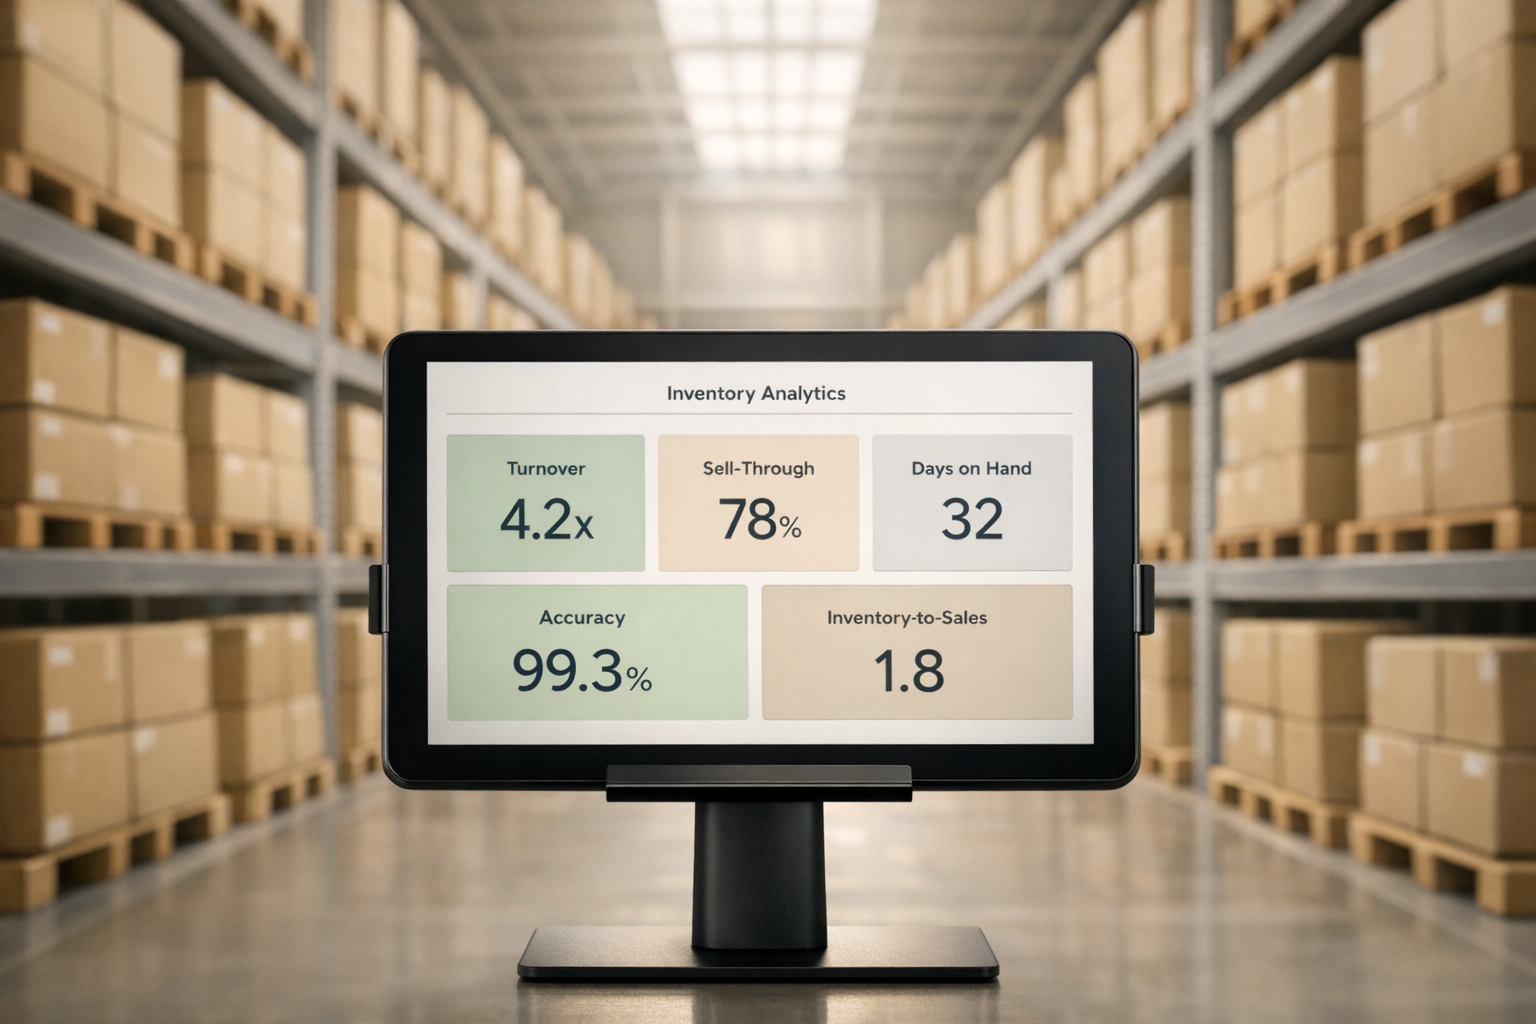
Running a Shopify store without tracking inventory metrics can lead to overstocking, stockouts, or cash flow issues. Monitoring the right data helps balance inventory levels, reduce costs, and improve customer satisfaction. Here are five key metrics every Shopify store owner should track:
- Inventory Turnover Ratio: Measures how often stock is sold and replaced. High turnover indicates efficient sales; low turnover suggests overstocking or weak demand.
- Sell-Through Rate (STR): Shows the percentage of inventory sold within a specific period. A higher STR reflects strong product demand.
- Days on Hand (DOH): Tracks how long inventory stays before being sold. Lower DOH frees up cash but risks stockouts; higher DOH ties up capital.
- Inventory Accuracy: Compares recorded stock levels to actual counts. Accurate data prevents phantom inventory and stock discrepancies.
- Inventory-to-Sales Ratio: Indicates how much inventory you hold relative to sales. A balanced ratio avoids overstocking and stockouts.
These metrics, when monitored using Shopify tools or advanced platforms like Forstock, provide actionable insights to optimize inventory management and boost profitability.
5 Essential Shopify Inventory Metrics: Formulas and Benchmarks
1. Inventory Turnover Ratio
Definition and Formula
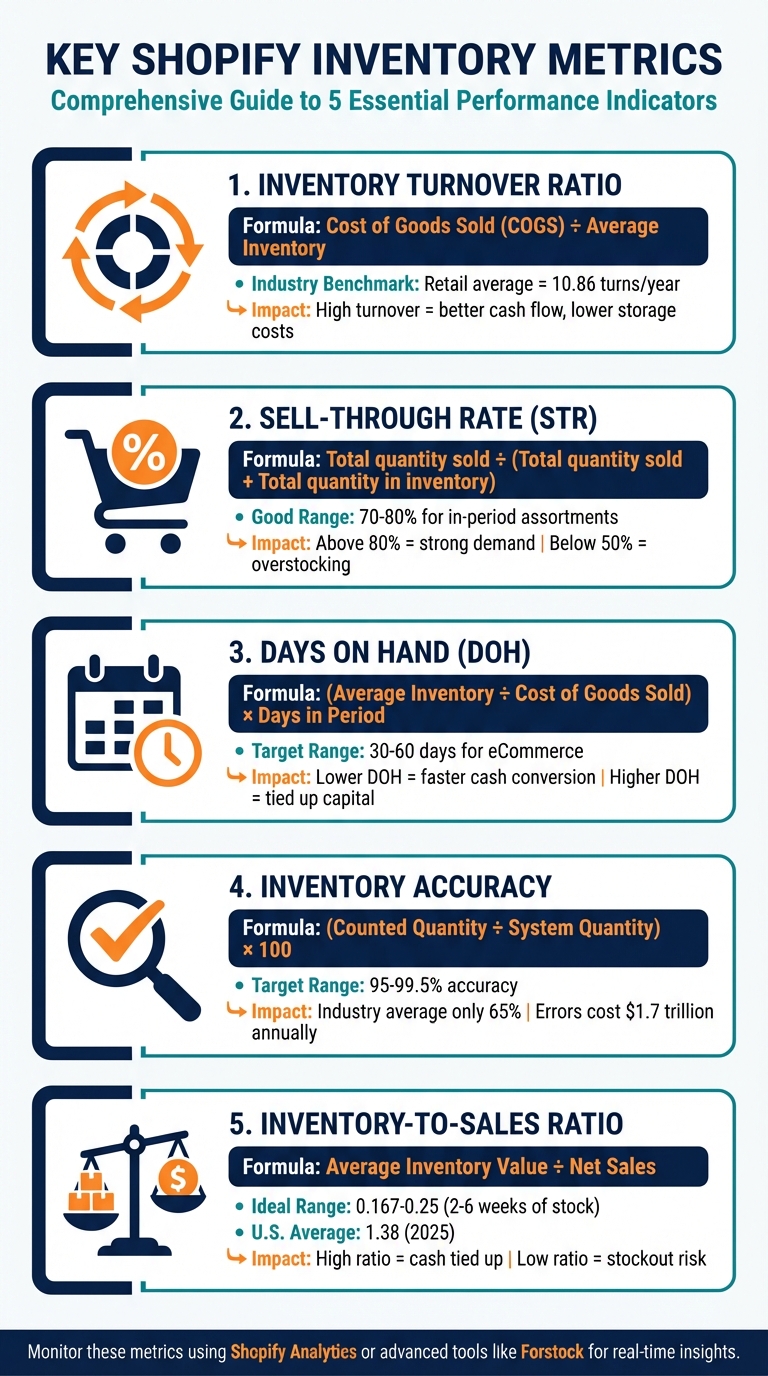
The inventory turnover ratio shows how often a business sells and replaces its inventory within a specific time frame. A higher ratio reflects quicker inventory movement, which often leads to better cash flow. The formula is straightforward:
Cost of Goods Sold (COGS) / Average Inventory
To find the average inventory, simply add the beginning and ending inventory for the period and divide by two [7, 12]. Shopify provides tools to track both COGS and inventory levels in its reports.
Business Impact on Inventory Management
Understanding this ratio is essential for evaluating operational efficiency. A high turnover ratio usually points to strong sales, lower storage costs, and effective inventory control. On the flip side, a low turnover ratio might suggest overstocking, weak marketing, or reduced demand. For instance, the retail industry averages a turnover ratio of 10.86, while consumer discretionary brands typically achieve about 7 inventory turns annually. Additionally, U.S. retailers hold approximately $1.39 in inventory for every dollar earned. The cost of holding inventory - including storage, insurance, and obsolescence - can range from 20% to 30% of its value yearly. Businesses that refine their inventory systems often experience a 67% boost in turnover rates and a 32% drop in carrying costs.
Optimization Strategies
To improve inventory turnover, focus on high-value items using the ABC analysis, which groups products into A (around 80% of revenue), B, and C categories [7, 18]. For slow-moving products, try bundling them with popular items instead of just cutting prices [17, 18]. If turnover remains sluggish, consider targeted marketing campaigns or flash sales to drive demand. Another effective approach is adopting a Just-in-Time (JIT) inventory strategy, which minimizes storage costs by ordering stock only when needed [16, 18]. Automated reorder points for Shopify, set based on lead times and daily sales, can also help avoid stockouts for high-demand products [16, 18].
"Your goal is to rotate inventory as much as possible to maximize profits. If you have older products that are low sellers, run a sale on them and discontinue the line after it's sold out."
- Michael Keenan, Shopify
sbb-itb-f0fc809
2. Sell-Through Rate
Definition and Formula
Sell-through rate (STR) is a key metric that shows the percentage of inventory sold compared to the total stock available within a specific time frame. It essentially measures how quickly products are selling. Shopify calculates STR with this formula:
Total quantity of items sold / (Total quantity of items sold + Total quantity of items still in inventory).
A good STR usually ranges between 70% and 80% for in-period assortments, but this can vary depending on the product category and industry. By analyzing STR, businesses can gain a quick understanding of product demand, which is crucial for effective inventory planning.
Business Impact on Inventory Management
STR is a powerful tool for identifying demand trends and shaping inventory strategies. A high STR (above 80%) suggests strong customer interest and efficient stock movement, while a low STR (below 50%) might indicate overstocking or lackluster product appeal. The stakes are high - inventory mismanagement costs retailers around $1.7 trillion globally each year, with U.S. retailers alone holding about $810 billion in unsold goods as of July 2025.
Different product categories naturally perform at different rates. For instance, fragrance products typically reach a 23% sell-through after eight weeks, cosmetics hit 25%, and home improvement items average 55%. These benchmarks can help businesses assess whether their products are performing as expected or need adjustments. A success story comes from Mac Duggal, a formalwear brand that used Shopify Audiences to expand its retargeting pool by 2.3x and reduce its cost per purchase by 3.6x.
Optimization Strategies
Improving STR is critical for keeping inventory levels balanced and meeting customer demand. Start by leveraging inventory forecasting tools that use real-time sales data and supplier lead times to anticipate demand. This can cut excess inventory by up to 50%. Monitoring STR at the SKU level - tracking specific variants like colors, sizes, or styles - can also reveal which items are underperforming.
For slow-selling products, consider bundling them with popular items instead of immediately resorting to steep discounts. Apps like Shopify Bundles make it easy to package less popular items with bestsellers, increasing cart size while clearing inventory. When discounts are necessary, calculate their impact carefully. Gerrid Smith, CMO of Joy Organics, emphasizes:
"While markdowns are a quick way to enhance inventory turnover, generate cash, keep fresh goods flowing, and remedy purchasing mistakes, they should solve problems rather than create new ones".
Even a 1% improvement in pricing strategy can lead to an 11% increase in profit margins when discounts are applied thoughtfully.
To further boost STR, integrate product recommendations with real-time inventory data - this alone can improve STR by 10%. Additionally, retargeting campaigns can help reach customers most likely to purchase specific items, and regular assortment reviews can guide decisions on reordering or discontinuing products.
3. Days on Hand
Definition and Formula
Days on Hand (DOH) tracks how long inventory stays in stock before it’s converted into cash. The formula is:
(Average Inventory / Cost of Goods Sold) x Days in Period
To calculate Average Inventory, add the starting and ending inventory values, then divide by two. Another related metric, "Days of Inventory Remaining", offered by Shopify, divides total stock by the average daily sales over the last 28 days. Understanding DOH is key because it ties directly to cash flow and operational efficiency.
Business Impact on Inventory Management
DOH plays a major role in shaping your business’s cash flow and profitability. A lower DOH means inventory is selling quickly, allowing you to reinvest cash into the business. Many eCommerce businesses aim for a DOH between 30 and 60 days, though this can vary depending on the industry. For instance, average inventory turnover rates differ across sectors: Retail (13.79), Technology (7.82), Consumer Discretionary (5.94), and Healthcare (3.00).
A higher DOH might indicate overstocking, which increases storage costs. As Javad Nasiry, a management professor at McGill University, puts it:
"The more you know about your demand, the less uncertain you are about demand. That means you can manage your inventory better and reduce inventory levels in your warehouses, because keeping inventory is costly".
On the flip side, a very low DOH - while showing efficient operations - can leave you vulnerable to stockouts during sudden demand surges. Keeping a close eye on DOH helps strike the right balance between maintaining enough stock and managing cash flow effectively. It also complements other metrics like inventory turnover and sell-through rates, offering a fuller picture of inventory performance.
Optimization Strategies
If your DOH is too high, consider strategies to speed up sales. These might include bundling slow-moving items, running flash sales, or offering targeted discounts. Shopify’s inventory reports can help you spot underperforming products and take steps to free up storage space. For unsold stock, donating items can cut holding costs and potentially offer tax benefits.
For a DOH that’s too low, increase safety stock to prepare for demand spikes. Use AI-based forecasting tools and automated alerts to maintain the right DOH and adjust orders as needed. Adopting Just-in-Time (JIT) inventory methods with flexible suppliers can also help you keep stock levels lean without running out.
Focus on monitoring DOH for your top 20% revenue-generating products to ensure stock levels are optimized.
4. Inventory Accuracy
Definition and Formula
Once you've assessed sales and turnover, the next step is ensuring your data is trustworthy. Inventory accuracy measures how closely your recorded stock levels match the actual physical count. The formula is simple:
(Counted Quantity / System Quantity) x 100
The average retailer only achieves about 65% accuracy, but for effective inventory management, you should aim for a range between 95% and 99.5%. For instance, if your system lists 100 units but you physically count 98, your accuracy is 98%. Even small errors like this can add up - retailers lose over $1.7 trillion annually due to inventory inaccuracies.
Business Impact on Inventory Management
Inaccurate inventory data can lead to phantom inventory - items that appear available in your system but don't actually exist. This often results in delayed or canceled customer orders, damaging trust and loyalty. On top of that, inventory shrinkage costs the retail industry a staggering $112.1 billion every year. These errors can also throw off your inventory valuation, which affects taxes, financing, and cash flow planning.
Sylvia Fountaine, Founder of Bowl and Pitcher, highlights the importance of accuracy:
"Having accurate inventory counts is not only important for keeping organized, but for staying accountable to your vendors, suppliers and customers."
Without dependable inventory data, forecasting demand becomes a guessing game. This can lead to overstocking slow-moving items or missing out on popular trends. To avoid these pitfalls, you need strategies that help you maintain near-perfect accuracy.
Optimization Strategies
- Cycle Counting: Instead of waiting for an annual audit, count smaller sections of your inventory daily or weekly. This helps you catch and fix discrepancies early.
- ABC Analysis: Focus on the 20% of SKUs that generate 80% of your revenue. These high-priority items should be counted more frequently.
- Automate Data Capture: Use tools like barcode scanners or RFID technology to achieve accuracy rates as high as 99.6%.
- Organize Your Stockroom: Clearly label and assign shelf space for each SKU. Set restricted permissions in Shopify POS to avoid unauthorized adjustments that lead to errors.
- Timely Reconciliation: Update your records immediately for returns or canceled orders to prevent phantom inventory issues.
5. Inventory-to-Sales Ratio
Definition and Formula
The inventory-to-sales ratio, also known as the stock-to-sales ratio, shows how many months' worth of inventory you have compared to your monthly net sales. The formula is:
Average Inventory Value / Net Sales
To calculate the average inventory value, add the beginning and ending inventory values for a given period, then divide by two. Net sales are your gross sales minus any returns and discounts. For instance, if you have $45,000 in inventory and $10,000 in monthly net sales, your ratio is 4.5. This means you're holding about 4½ months of stock.
If you're using Shopify, you can find these numbers by comparing the "Month-end inventory value" report with "Net sales" from your financial reports. While the ideal range depends on your industry, many businesses aim for a ratio between 0.167 and 0.25. For reference, the total inventory-to-sales ratio in the U.S. for 2025 was 1.38, according to Census data.
Business Impact on Inventory Management
This ratio provides valuable insights into how well your inventory is being turned into revenue. It can act as an early warning system for cash flow challenges. A high inventory-to-sales ratio suggests that too much capital is tied up in inventory, leaving less money available for things like marketing, payroll, or launching new products. For businesses dealing with bulky items, excess inventory can also overwhelm storage space, limiting the ability to stock faster-moving products.
On the flip side, a low ratio may indicate potential stockouts, which can lead to unhappy customers, emergency shipping costs, and missed sales opportunities. By understanding demand trends, businesses can fine-tune their inventory levels, reducing waste and improving cash flow.
Optimization Strategies
Start by tracking your inventory-to-sales ratio over several months to establish a baseline. Keep in mind that target ratios can vary depending on your industry. If your ratio is too high, you might need to clear out slow-moving inventory through sales or adjust ordering patterns to bring in smaller quantities more frequently. Multi-location inventory reports can help you redistribute stock across locations instead of resorting to heavy discounts.
If your ratio is too low, focus on increasing sales velocity through marketing or refining your demand forecasts to ensure popular items are always available. Shopify's "ABC product analysis" report can help you identify high-value products (A-grade items that drive 80% of revenue) that need careful inventory management. Setting up automated low-stock alerts and reordering thresholds can help you strike the right balance between overstocking and running out of stock.
Shopify Inventory Tracking Guide: ABC Analysis, Bundles & Stock Alerts
How to Monitor These Metrics with Shopify Tools
Shopify offers several tools to help you keep an eye on key inventory metrics and make smarter decisions. These reports and analytics ensure you're fully equipped to track performance and optimize your inventory management.
Shopify's built-in analytics make monitoring metrics straightforward. At the top of your Products page, the Product Inventory Analytics Bar provides quick insights, including sell-through rate, days of inventory remaining, and inventory value - all in one glance. For more detailed data, head to Analytics > Reports, where you'll find specialized reports like "Products by sell-through rate", "Inventory turnover report", and "Inventory sold daily by product" [3,8]. However, note that these reports come with a 2-day processing delay, and historical data only goes back to October 1, 2023.
To take things further, Forstock offers advanced inventory tracking features that integrate seamlessly with Shopify. With its unified dashboard, you can monitor all five key metrics - inventory turnover, sell-through rate, days on hand, inventory accuracy, and inventory-to-sales ratio - in real time. This eliminates the need to juggle multiple reports. Forstock also uses AI-driven demand forecasting to analyze sales trends, seasonality, and growth patterns, helping you predict reorder needs. Its Reorder Table calculates optimal reorder points based on supplier lead times and sales velocity, which directly impacts your days on hand metric [36,37].
Jason, Co-founder at HomeGoods, shared his experience:
"We're preventing stockouts that were costing us $50K monthly. The AI predictions are incredibly accurate".
Forstock also automates purchase order workflows, syncing received inventory directly to Shopify. Alexander, E-commerce Manager at PureOrganics, highlighted this benefit:
"The automated PO creation saves us 10+ hours weekly. Setup was seamless - just 2 minutes!".
Operations Lead Matt at TechGear used Forstock's inventory table to uncover over $70,000 worth of slow-moving stock in just one week, significantly improving their inventory-to-sales ratio.
Forstock goes beyond automation by offering customizable dashboards. You can apply filters, save views, and focus on specific performance indicators. Whether you're managing stock across multiple warehouses or dealing with complex multi-variant catalogs, Forstock provides 12-month demand plans and supplier performance insights - all without the hassle of spreadsheets [36,37].
Conclusion
Keeping an eye on key inventory metrics is essential for managing cash flow and ensuring you can meet customer demand. When inventory levels are too high, even small improvements can make a noticeable difference in your profits. Fixing inventory inaccuracies alone can lead to an estimated 11% increase in sales. Plus, regular monitoring helps you avoid locking up capital in products that don’t move quickly.
Shopify’s built-in analytics offer a great starting point for tracking these metrics. Tools like the Product Inventory Analytics Bar let you quickly see sell-through rates and how many days of inventory you have left. More detailed reports can also help you analyze turnover rates and individual product performance. While these tools are helpful, advanced solutions can take your inventory management to the next level.
Forstock provides real-time tracking and uses AI-driven forecasting to align with your actual sales trends, seasonal shifts, and supplier timelines. Instead of juggling spreadsheets or manually calculating reorder points, Forstock offers a single dashboard that tracks all five key metrics at once. Features like automated purchase order creation and supplier coordination save hours of work each week. This not only simplifies day-to-day operations but also leads to better long-term inventory management.
By focusing on these five metrics, you can shift from reacting to inventory issues to making smart, data-backed decisions. This approach helps lower carrying costs, avoid stockouts, optimize reorder points, and free up funds that can be used for marketing or launching new products.
To get started, use Shopify’s tools to build a solid foundation for tracking. Then, explore Forstock’s 14-day free trial to see how automation and AI forecasting can transform your inventory management into a proactive, scalable system. Together, these tools provide both immediate insights and the strategic planning needed for growth.
FAQs
What’s a good target for inventory turnover in my category?
For e-commerce businesses, aiming for an inventory turnover of 8–12 times per year is a solid target. Retailers, on average, achieve an annual turnover rate of about 10.86. However, these benchmarks can differ significantly depending on the industry. For example:
- Perishables: Typically range between 12–20 turnovers annually due to their short shelf life.
- Consumer staples: Generally fall in the 10–12.9 range.
Your ideal turnover rate will ultimately depend on your product category and the specific needs of your business.
How do I set reorder points using sell-through and days on hand?
To figure out reorder points, apply this formula: (Average Daily Sales × Lead Time) + Safety Stock.
- Average Daily Sales: Calculate this by dividing the total units sold (e.g., 420 units over 30 days) by the number of days (e.g., 30 days = 14 units/day).
- Lead Time: This is the number of days it takes for your supplier to deliver the stock.
- Safety Stock: Keep some extra inventory on hand to handle unexpected demand spikes or delivery delays.
It's important to review and adjust these numbers regularly to account for trends or seasonal changes.
How can I improve inventory accuracy without full counts?
Boosting inventory accuracy doesn't always require a full-scale count. Instead, you can rely on some focused strategies to keep things on track:
- Centralize Inventory Data: Stick to one reliable system for managing your inventory. Having a single source of truth reduces confusion and errors across platforms.
- Limit Stock Adjustments: Turn off stock adjustment features in apps or tools that don't need them. This prevents unnecessary changes that can throw off your records.
- Cycle Counts for Key Items: Regularly count items that are either high in value or low in stock. These are typically the most critical pieces of your inventory.
- Track Stock Movements: Use purchase orders and transfer records to log incoming stock. This can help catch mistakes before they snowball into bigger problems.
- Review Barcodes and SKUs: Regularly check for mismatches in barcode or SKU data. Even minor discrepancies can lead to larger issues if left unchecked.
By focusing on these specific areas, you can keep your inventory accurate without the need for constant full counts.
Keep reading
Try Forstock free for 14 days.
AI-powered demand forecasting and reorder automation for Shopify brands. No credit card required.