Inventory Turnover Ratio: Guide for Shopify Brands
How to calculate inventory turnover for Shopify stores, benchmark rates by product, and use forecasting, pricing, and supplier strategies to improve cash flow.
Inventory Turnover Ratio: Guide for Shopify Brands
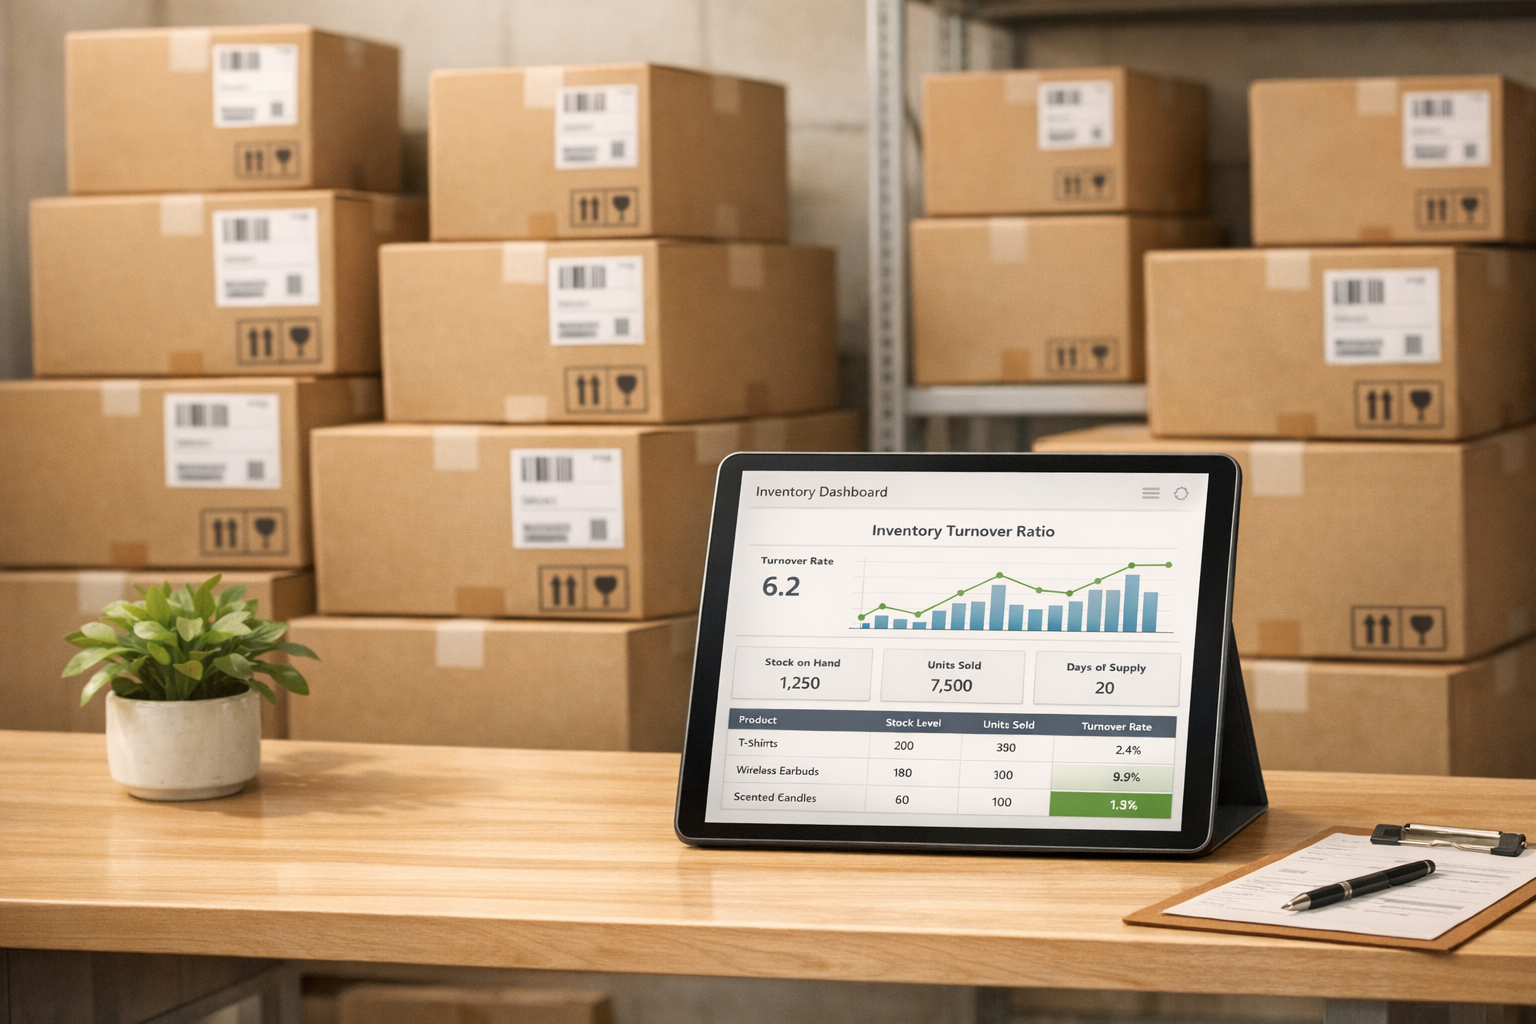
Want to improve your Shopify store's profitability and cash flow? Start by mastering your inventory turnover ratio. This key metric shows how often you sell and replace inventory within a specific timeframe, directly impacting your cash flow, profitability, and customer satisfaction.
Here’s what you need to know:
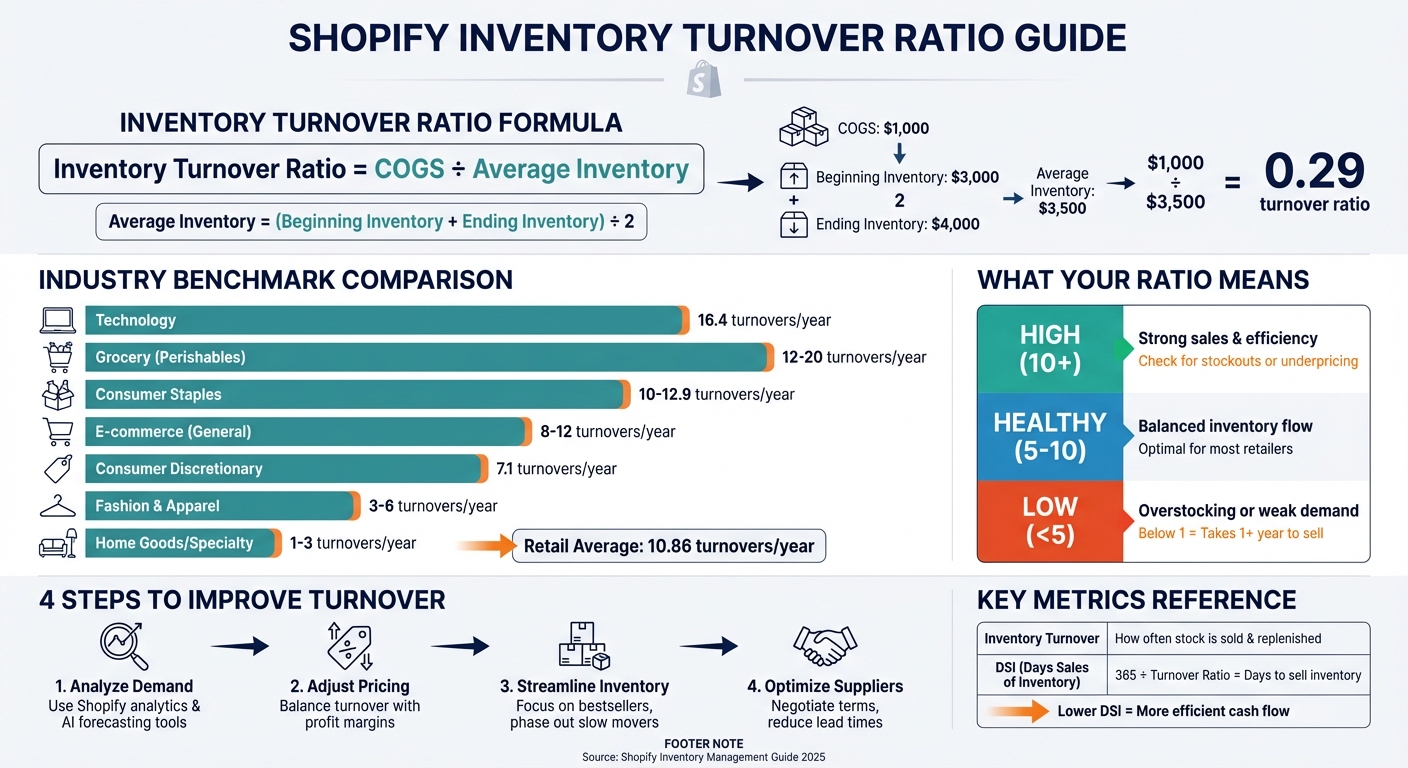
- Formula: Inventory Turnover Ratio = Cost of Goods Sold (COGS) ÷ Average Inventory
- Why It Matters: A high ratio means strong sales but could lead to stockouts, requiring stockout alert tools to manage. A low ratio signals overstocking or slow sales, tying up cash.
- Benchmarks: Retail averages around 10.86 turnovers annually; e-commerce aims for 8–12.
To improve your turnover:
- Analyze Demand: Use Shopify’s analytics or tools like Forstock for accurate forecasting.
- Adjust Pricing: Experiment with pricing to balance turnover and profit margins.
- Streamline Inventory: Focus on bestsellers, and phase out slow-moving items.
- Optimize Suppliers: Negotiate better terms and reduce lead times.
Inventory Turnover Ratio Guide: Formula, Benchmarks, and Optimization Strategies
Understanding Inventory Turnover and Related Metrics
How to Calculate Inventory Turnover Ratio
The inventory turnover ratio is calculated using this formula:
Inventory turnover ratio = COGS ÷ [(Beginning Inventory + Ending Inventory) ÷ 2]
Here, COGS refers to the direct costs associated with the products you’ve sold.
Let’s break it down with an example:
If your COGS is $1,000, your beginning inventory is $3,000, and your ending inventory is $4,000, the average inventory would be $3,500. Using the formula, the turnover ratio comes out to approximately 0.29.
Now, let’s look at additional metrics that can help evaluate inventory efficiency.
Related Metrics: DSI and Gross Margin
Days Sales of Inventory (DSI), often called "days on hand", tells you how many days, on average, inventory remains unsold. The formula for DSI is:
DSI = (Average Inventory ÷ COGS) × 365
Alternatively, you can calculate it by dividing 365 by your inventory turnover ratio. A lower DSI generally signals a more efficient cash-to-cash cycle.
While the inventory turnover ratio shows how often stock is replaced, DSI highlights how long it takes to sell inventory. Both metrics are critical for Shopify brands aiming to improve cash flow and refine pricing strategies.
There’s often a trade-off between turnover and gross margins. For example, high-margin luxury items typically sell slower, leading to a lower turnover, while lower-margin essentials tend to move faster. If you notice a high turnover ratio paired with slim margins, it might indicate underpricing. In such cases, you could experiment with raising prices without significantly reducing sales volume.
| Metric | Formula | What It Tells You |
|---|---|---|
| Inventory Turnover Ratio | COGS ÷ Average Inventory | How often stock is sold and replenished during a given period |
| Days Sales of Inventory (DSI) | 365 ÷ Inventory Turnover Ratio | Average time inventory takes to convert into sales |
| Average Inventory | (Beginning Inventory + Ending Inventory) ÷ 2 | A smoothed-out value of inventory, accounting for seasonal changes |
With these metrics in mind, let’s explore how Shopify can help you track and analyze this data.
Where to Find Your Data in Shopify

You’ll find COGS on your income statement, accessible through your accounting software or financial reports. Shopify simplifies inventory tracking by syncing stock levels across all sales channels whenever products are received, sold, returned, or exchanged.
One especially useful tool is the "Percent of inventory sold" report in Shopify admin. This report gives a detailed breakdown of starting inventory, ending inventory, and the percentage sold.
"Want to see which items are flying off shelves or collecting dust? View the Percent of inventory sold report in Shopify admin to see your entire product catalog's starting quantity, ending quantity, percent of sold, and more."
- Michael Keenan, Shopify Staff
Shopify POS also provides key inventory reports that can help predict demand for specific products. If you’re looking for more advanced cloud inventory tools for Shopify, platforms like Forstock integrate seamlessly. These tools offer real-time demand forecasting and inventory analytics, removing the need for manual data exports or calculations. Having accurate, up-to-date data is essential for making informed decisions that can boost cash flow and profitability.
How Inventory Turnover Affects Profitability
Impact on Cash Flow and Working Capital
Inventory only generates cash once it's sold. Until then, every dollar tied up in unsold stock is money that could have been used for paying bills, marketing efforts, or replenishing inventory. Faster turnover helps free up this cash, improving working capital by minimizing the amount locked in inventory.
When products move quickly, you also save on storage costs, keeping your expenses lower and protecting your profit margins. For example, consumer discretionary brands like luxury clothing typically refresh their inventory nearly seven times a year.
"To generate cash and pay the bills, you need to sell what you buy." - Michael Keenan, Shopify
However, low turnover can create inefficiencies. Products that sit too long in storage rack up costs for warehouse space, insurance, and labor - expenses that chip away at your margins. Worse, unsold inventory risks turning into dead stock, which can become a financial burden.
Next, let’s explore how both low and excessively high turnover rates can impact profitability.
Risks of Low or High Turnover
Low inventory turnover traps money in slow-moving products, piling on storage, labor, and insurance costs without bringing in revenue. This is especially risky for items like fashion, perishables, or tech gadgets that can quickly lose value or become outdated. For context, an inventory turnover ratio below 1 means it takes over a year to sell your average stock - a clear red flag.
On the flip side, high turnover often signals efficiency, but it can also cause problems. If your turnover is too high because you’re understocking, frequent stockouts can leave customers empty-handed, leading to lost sales. Additionally, a high turnover rate paired with thin margins might suggest you’re underpricing your products, leaving potential profits untapped. Constantly placing small orders to replenish stock can also drive up shipping and processing costs, further eating into profits.
| Turnover Level | Primary Risk | Impact on Profitability |
|---|---|---|
| Too Low | High holding costs, risk of dead stock, cash flow issues | Tied-up capital; storage costs reduce profits |
| Too High | Stockouts, higher shipping fees, possible underpricing | Lost sales; increased costs; missed profit potential |
| Balanced (4-8x) | Minimal risk with accurate forecasting | Optimized cash flow and stronger margins |
Finding the right balance is critical, as turnover extremes can strain your finances and risk disappointing customers.
Customer Experience and Product Availability
Inventory turnover doesn’t just affect your cash flow - it plays a huge role in customer satisfaction. A healthy turnover rate ensures bestsellers stay available, reducing the chances of empty shelves that could send shoppers to your competitors. Faster turnover also means customers get access to newer, fresher products, which is especially important for perishables, fashion, and tech. In fact, studies show that 78% of U.S. shoppers have encountered out-of-stock items, and poor availability can cost businesses up to 8% in lost revenue.
Consider this: A Pan-Asian health and beauty retailer slashed out-of-stock instances by 60% and boosted inventory turnover by 22% by adopting advanced inventory optimization tools that integrated sales data with supply chain visibility. Similarly, Target leveraged AI and machine learning to analyze real-time transactions and seasonal trends, reducing both excess inventory and stockouts significantly.
Reliable product availability builds trust with your customers. When they know they can count on you to have what they need, they’re more likely to return. On the other hand, frequent stockouts can frustrate shoppers and damage long-term loyalty. Tools like Forstock help Shopify merchants strike this balance by using AI-driven forecasting to adapt to sales trends, lead times, and seasonal shifts - keeping bestsellers in stock without overloading on slow-moving items.
Benchmarks and How to Interpret Your Inventory Turnover
Average Turnover Rates by Product Category
Inventory turnover rates can vary widely depending on the type of products you sell. For example, general retail averages around 10.86 turnovers per year. Technology items tend to move faster, with an average of 16.4 turnovers annually, while luxury consumer discretionary products typically see about 7.1 turnovers. Fashion and apparel brands usually experience 3 to 6 turnovers per year, whereas grocery stores dealing with perishable goods often need 12 to 20 turnovers to stay profitable.
E-commerce businesses generally aim for 8 to 12 turnovers annually, although some Shopify merchants with unique product mixes or sales strategies operate comfortably in the 2 to 4 range. For instance, in 2024, formalwear brand Mac Duggal used Shopify Audiences to connect recommendations with real-time inventory, which expanded their retargeting pool by 2.3× and cut their cost per purchase by 3.6×. Similarly, apparel brand We Are Jolies reduced stockouts by 60% by leveraging AI forecasting to align inventory turnover with demand.
| Product Category | Average Turnover Ratio |
|---|---|
| Technology | 16.4 |
| Grocery (Perishables) | 12 – 20 |
| Consumer Staples/FMCG | 10+ to 12.9 |
| E-commerce (General) | 8 – 12 |
| Consumer Discretionary | 7.1 |
| Fashion & Apparel | 3 – 6 |
| Home Goods/Specialty | 1 – 3 |
Keep in mind that product dimensions also play a role. Bulkier items often require faster turnover to offset higher storage costs. Instead of relying on a single store-wide average, calculate turnover ratios for each product line to get a clearer picture of your inventory performance.
These benchmarks provide a foundation for interpreting your specific turnover ratio.
What Your Turnover Ratio Tells You
A turnover ratio above 10 generally reflects strong sales and efficient inventory management. However, if high ratios are paired with slim profit margins, it could indicate underpricing or frequent stockouts. Ratios between 5 and 10 are considered healthy for most retail sectors, showing a good balance between inventory flow and demand. A ratio below 5 signals potential issues like overstocking, weak demand, or ineffective marketing strategies. If your ratio drops to 1 or less, it means your inventory takes over a year to sell, tying up capital in products that risk becoming obsolete.
In July 2025, U.S. retailers were left with approximately $810 billion in unsold inventory.
"Your goal is to rotate inventory as much as possible to maximize profits. If you have older products that are low sellers, run a sale on them and discontinue the line after it's sold out."
- Michael Keenan, Shopify
Use your turnover ratio to guide operational decisions. If it's on the lower side, consider strategies like adjusting prices, running flash sales, or phasing out underperforming SKUs to free up storage space.
Combining Turnover with Other Metrics
To get a full picture of your inventory performance, combine turnover ratios with other key metrics. For example, Days Sales of Inventory (DSI) helps you understand how long stock sits before being sold. Pairing turnover with Gross Margin Return on Investment (GMROI) can also reveal whether high-turnover items are actually profitable - because moving products quickly doesn’t help if they’re sold at a loss.
Tracking your sell-through rate is another valuable approach. This metric compares the amount of inventory sold to what was received from suppliers over the past 30 days, offering a real-time view of demand. Additionally, inventory aging reports can help you identify products that linger on shelves too long. Shopify’s built-in "Percent of Inventory Sold" report is a handy tool for spotting trends, showing starting quantities, ending quantities, and the percentage of inventory sold.
For a more strategic approach, consider ABC Analysis, which segments inventory into three categories:
- A: High-value items requiring frequent monitoring.
- B: Moderate-priority products.
- C: Lower-value items needing minimal attention.
AI-driven solutions can also make a big difference. Improved forecasting can reduce inventory levels by 20% to 30%, and even small pricing adjustments - like a 1% improvement - can increase profit margins by around 11%. Tools like Forstock integrate metrics like turnover, sell-through rates, and seasonality into a single dashboard, using AI to adapt forecasts to changing trends. This ensures you maintain optimal inventory turnover while balancing profitability and customer satisfaction.
sbb-itb-f0fc809
How to Improve Inventory Turnover Without Hurting Profits
Demand Forecasting and Smarter Purchasing
Getting a handle on demand forecasting is a game-changer for improving inventory turnover while avoiding excess stock. By analyzing historical sales data, you can predict future demand with quantitative forecasting. For new or seasonal items, qualitative methods like customer surveys and market research can fill in the gaps.
If you're a Shopify merchant, sales velocity analysis can be a powerful tool. Use the formula: Total Sales / (Total Days - Out-of-Stock Days). This approach ensures that periods of unavailability don’t distort your demand estimates. Combine this with reorder point (ROP) calculations - (Units used daily x Days lead time) + Safety stock - to automate restocking before inventory runs dry.
"The more you know about your demand, the less uncertain you are about demand. That means you can manage your inventory better and reduce inventory levels in your warehouses, because keeping inventory is costly."
- Javad Nasiry, Management Professor, McGill University
Focus your forecasting efforts where it matters most. Use ABC Analysis to identify high-value SKUs that contribute the bulk of your revenue. Clean up your historical data by removing unusual spikes caused by one-off events to keep your forecasts accurate.
To simplify things, modern AI tools like Forstock integrate directly with Shopify. These tools can automate demand forecasting, create 12-month demand plans, and even suggest purchase orders based on trends, lead times, and seasonality. With a unified dashboard, you can track stock across locations and make smarter purchasing decisions without relying on spreadsheets or guesswork.
Product Selection and Pricing Strategies
Speeding up inventory turnover is only helpful if it doesn’t eat into your profits. Start by auditing your catalog regularly to identify slow-moving SKUs that tie up your cash. Instead of looking at a store-wide average, calculate turnover ratios for each product line - this gives you a clearer picture of what’s underperforming.
To move aging inventory without slashing margins, try targeted markdowns or bundling strategies. For example, pair slow sellers with popular items or offer discounts like “three-for-two” deals. These methods encourage bulk purchases while still protecting your bottom line.
Pricing plays a crucial role too. If your turnover is too high, it might mean your prices are too low. Adjusting prices upward can slow turnover slightly while increasing profit margins. Before turning to steep discounts, explore marketing campaigns or collaborations with influencers to shift how customers perceive the value of slow-moving products.
Shopify’s "Percent of inventory sold" report can help you spot items that are gathering dust. This report highlights starting and ending quantities, along with the percentage sold, making it easier to decide which products need markdowns or should be discontinued. Strong supplier relationships and efficient fulfillment processes further support these pricing and product strategies.
Supplier and Fulfillment Optimization
Your suppliers and fulfillment processes play a huge role in maintaining healthy inventory turnover. Use the Kraljic Matrix to categorize suppliers based on their profit impact and supply risk. Build strong relationships with "Strategic" suppliers (high impact, high risk) while automating orders from "Non-critical" suppliers (low impact, low risk).
Collaborative forecasting can strengthen supplier relationships. Sharing your sales data and demand projections with key partners can help reduce lead times and ensure stock availability during busy periods. Consistent, on-time payments also build trust, which can result in discounts or priority service.
"Maintaining an excellent relationship with our suppliers is critical to our business. I'm sure you've read there are beef shortages. We've never felt a moment of that, and I cannot help but credit it to the relationships we've built."
- Nicholas Fiorentino, Owner, The Meatery
Negotiate lower Minimum Order Quantities (MOQs) with reliable suppliers to avoid overstocking and free up capital tied to slow-moving products. Local sourcing can also be a smart move - shorter lead times let you adopt a more reactive Just-in-Time (JIT) strategy, improving turnover. Always have backup suppliers on hand to guard against global supply chain disruptions.
Tools like Forstock simplify supplier management by automating reorder suggestions and tracking key performance metrics, such as On-Time, In-Full (OTIF) delivery rates. With low-stock alerts and automated purchase orders, you can focus more on strategic supplier relationships.
For fulfillment, consider distributing inventory across multiple warehouses to position products closer to customers. This reduces shipping times and costs while speeding up turnover. Real-time inventory syncing across all sales channels - both online and in-store - helps prevent overselling and phantom inventory issues. Mismanaged inventory costs retailers nearly $2 trillion annually due to overstocking and stockouts. By optimizing suppliers and fulfillment, you can support smarter forecasting and pricing strategies to achieve better turnover rates.
Conclusion
Key Takeaways
Inventory turnover is a key indicator of how efficiently your business operates. It helps improve cash flow, cuts down on storage costs, and ensures products are readily available for customers. The challenge lies in maintaining the perfect balance - avoiding both overstocking and running out of stock.
What constitutes an ideal turnover rate depends on your product category and business model. To achieve this, focus on forecast inventory costs, strategic pricing, and building strong supplier relationships. These practices not only free up working capital but also keep your products available when customers need them.
Modern AI tools like Forstock can make a big difference. By combining demand forecasting, purchase order automation, and multi-location tracking, these tools empower businesses to make smarter, data-driven decisions - leading to better profitability and happier customers.
Next Steps for Shopify Merchants
Start by calculating your current inventory turnover ratio. Use Shopify Analytics to pull your COGS and average inventory data (found under Reports > Finance Report). Compare your results to the retail benchmark of 10.86 to understand how your business stacks up.
To improve your turnover, focus on the strategies outlined earlier. Identify slow-moving and fast-moving SKUs, then use ABC analysis to organize your inventory. Prioritize high-value items while exploring options like bundling or discounting for lower-priority products. Set up automated low-stock alerts by calculating reorder points and maintain safety stock buffers of 10%–15% for your bestsellers.
For a more streamlined approach, consider adopting a platform like Forstock. Its AI-powered tools adapt to seasonal trends and sales patterns, providing 12-month demand plans and automated purchase order suggestions. With these insights, you can scale your operations confidently, improve profitability, and keep customers satisfied.
Inventory turnover for ecommerce sellers | How to calculate and optimize
FAQs
How do I calculate the inventory turnover ratio for my Shopify store?
To figure out your Shopify store's inventory turnover ratio, use this straightforward formula:
Inventory Turnover Ratio = COGS ÷ Average Inventory
Here’s how to calculate your average inventory: Add your beginning inventory and ending inventory for a specific period, then divide that total by 2:
Average Inventory = (Beginning Inventory + Ending Inventory) ÷ 2
This calculation gives you insight into how effectively your store is handling inventory. A higher turnover ratio often points to strong sales and efficient inventory management, while a lower ratio might indicate issues like overstocking or sluggish product movement.
How can I increase my inventory turnover without reducing profitability?
Improving inventory turnover means moving products off the shelves faster while still keeping your profit margins intact. When done right, it cuts down on storage costs, frees up cash flow, and reduces the chances of holding onto outdated stock. However, it’s crucial not to sacrifice profitability in the process.
Start by fine-tuning your product lineup. Focus on your best-sellers and gradually phase out items that don’t perform well. Leverage demand forecasting tools to stay ahead of trends and ensure you’re ordering the right quantities at the right time. Streamlining your supply chain with automated purchase orders and working with suppliers who offer shorter lead times can also help you maintain just the right amount of stock without overloading your inventory.
Tools like Forstock make this process easier by providing real-time demand forecasting, inventory analytics, and automated workflows. These features help you strike the perfect balance - boosting turnover without putting your profits at risk.
How does inventory turnover affect customer satisfaction and business profitability?
A steady inventory turnover can do wonders for both customer happiness and a company's bottom line. When products move off the shelves quickly, businesses can unlock cash flow, cut down on storage expenses, and sidestep the headache of dealing with outdated inventory.
It also helps ensure that shelves stay stocked, so merchants can fulfill orders without hiccups - no delays, no stockouts, and no frustrated customers. The trick lies in finding the sweet spot: maintaining a turnover rate that meets customer demand while keeping operating costs under control.
Keep reading
Try Forstock free for 14 days.
AI-powered demand forecasting and reorder automation for Shopify brands. No credit card required.