
What Is a Good Sales Velocity for a New CPG Brand? (Units Per Store Per Week Benchmarks)
UPSPW benchmarks by channel to judge new CPG shelf performance, reorders, and inventory planning.
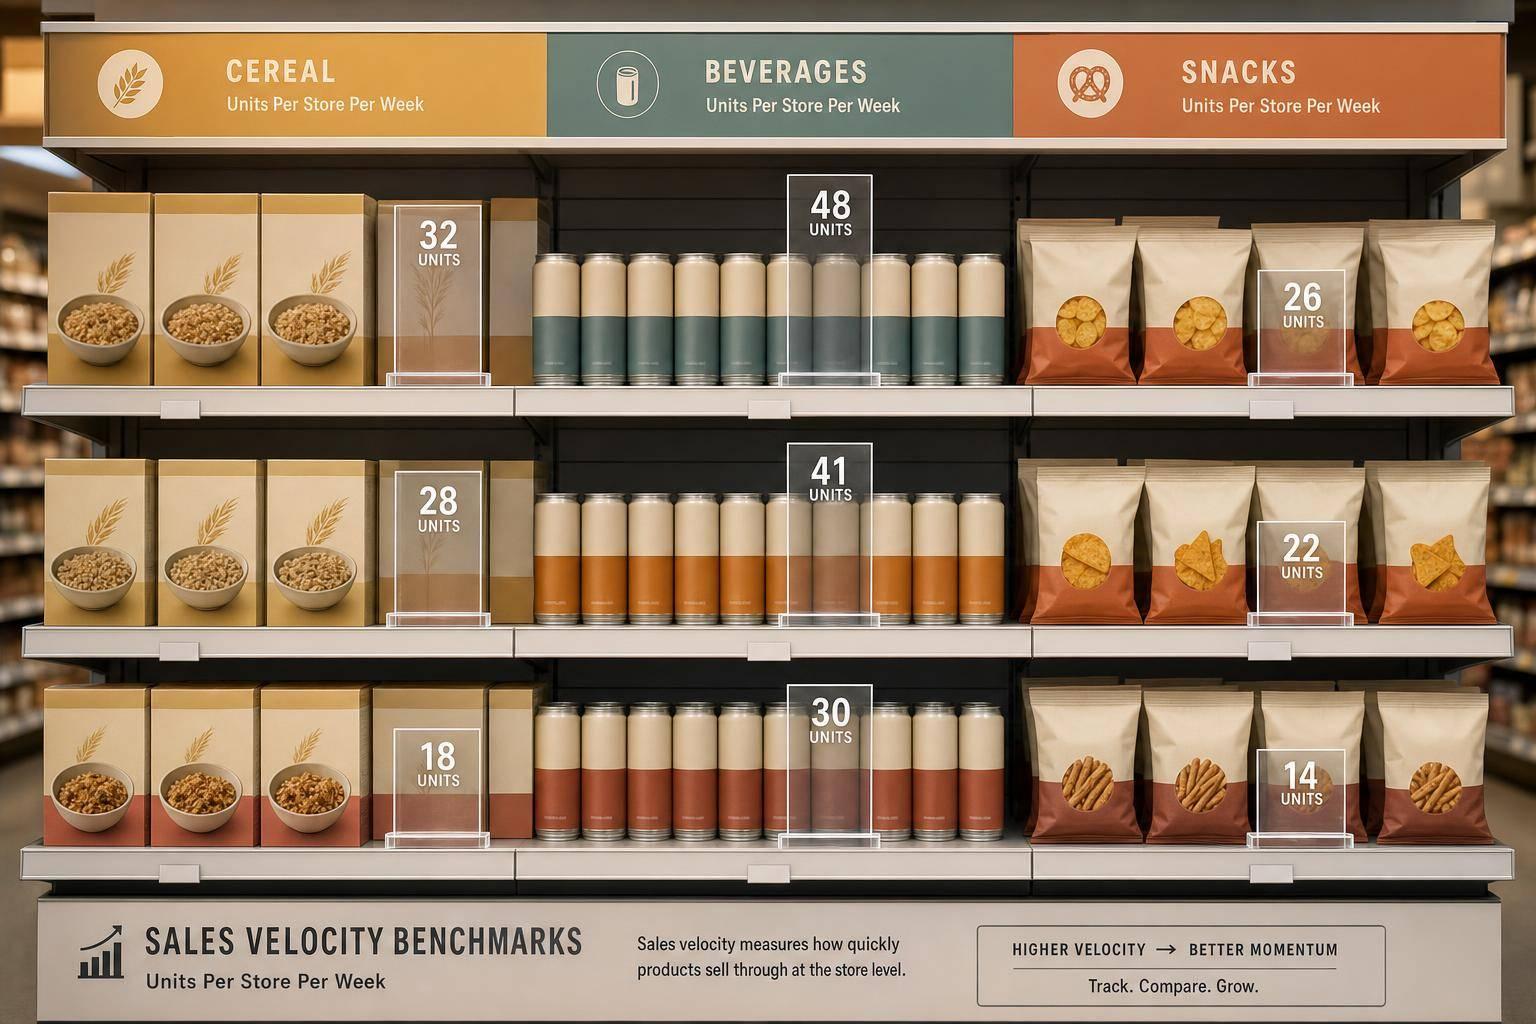
What Is a Good Sales Velocity for a New CPG Brand? (Units Per Store Per Week Benchmarks)
If you want the short answer: for a new CPG brand, under 2 UPSPW is often weak, 2 to 5 is usually solid, 5+ is strong in grocery and specialty, and 8+ is often the mark in mass retail or fast-moving beverage.
I’d judge sales velocity with units per store per week (UPSPW), not total sales. That’s because 2,000 units across 200 stores is only about 2.5 UPSPW, while 500 units across 20 stores is about 6.25 UPSPW. Same headline sales story. Very different shelf story.
Here’s the core takeaway:
- UPSPW formula: Units sold ÷ stores selling ÷ weeks
- Use active stores, not total authorized doors
- Natural grocery: around 2 to 3 UPSPW can work; 3 to 5 is a good range
- Conventional grocery: 4 to 6 UPSPW is a good target, with 6+ often strong
- Mass beverage: many sets need 5 to 8 UPSPW, and grab-and-go can need 6 to 10+
- Premium categories: even 1 to 3 UPSPW may be fine if price and margin are high
- Reorders: a simple check is UPSPW × active stores × (lead time + safety stock weeks)
- Low velocity does not always mean low demand; shelf placement, out-of-stocks, tags, and backroom issues often play a part
A fast example: a $29.99 supplement at 1.5 UPSPW brings in about $45 per store per week at retail. So in higher-price categories, unit turns alone do not tell the full story.
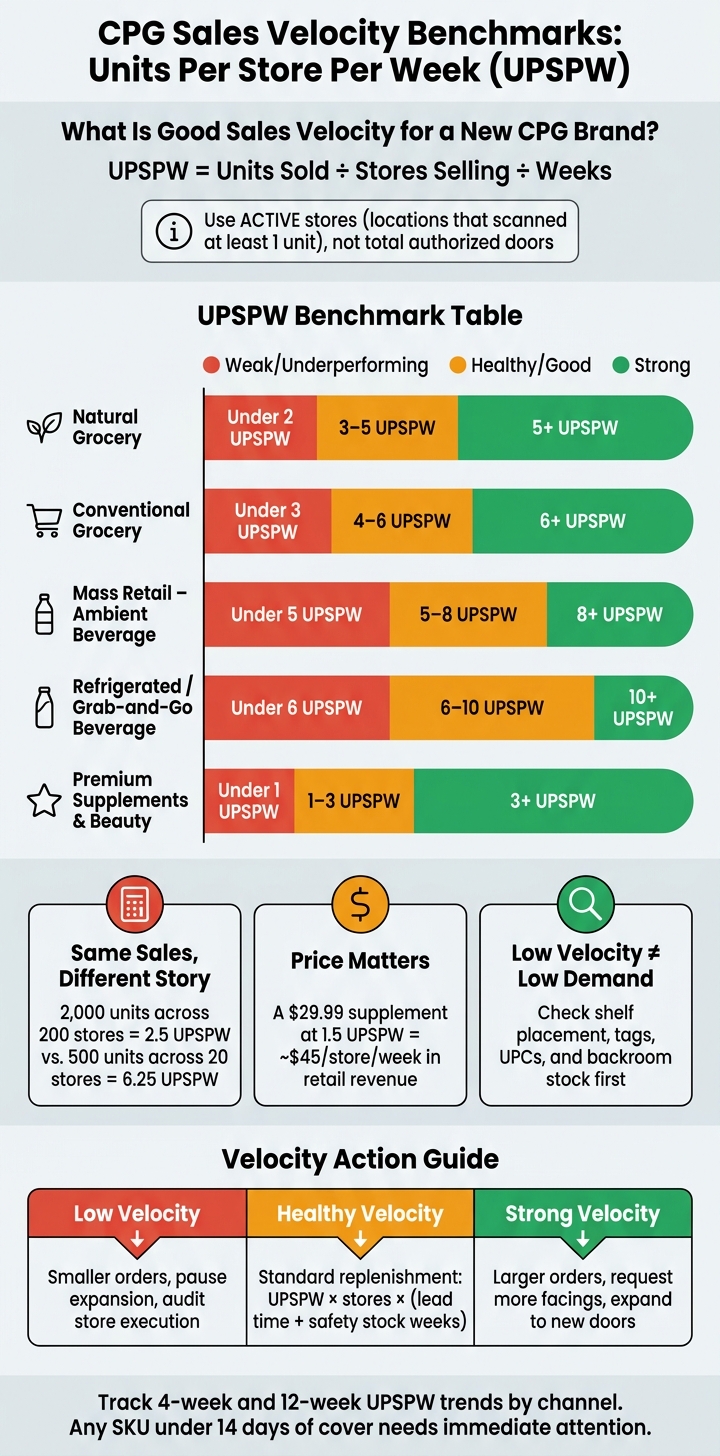
CPG Sales Velocity Benchmarks: UPSPW by Channel & Category
Mastering Velocity: Boost Your Brand's Retail Success with Key Metrics | Startup CPG

sbb-itb-f0fc809
Quick comparison
| Channel or Category | Weak | Good | Strong |
|---|---|---|---|
| Natural grocery | Under 2 | 3 to 5 | 5+ |
| Conventional grocery | Under 3 | 4 to 6 | 6+ |
| Mass ambient beverage | Under 5 | 5 to 8 | 8+ |
| Refrigerated / grab-and-go beverage | Under 6 | 6 to 10 | 10+ |
| Premium supplements / beauty | Under 1 | 1 to 3 | 3+ |
My bottom line: if you sell into retail, I’d track 4-week and 12-week UPSPW trends, compare them by channel, and use them to guide reorders, shelf checks, and store expansion.
What Sales Velocity Means in CPG and How to Calculate UPSPW
In CPG, sales velocity tells you how fast a product moves in the stores where shoppers can actually buy it.
The UPSPW Formula and the Data You Need
UPSPW = Units Sold ÷ Stores Selling ÷ Weeks
The key detail here is stores selling, not authorized stores. Why? Because only active stores show true velocity. Stores selling means locations that scanned at least one unit during the period.
For U.S. brands, this data usually comes from retailer POS, distributor reports, or synced inventory data.
When to Use 4-Week, 12-Week, and Launch-Period Views
Use launch-period velocity for an early read. Then move to a 4- or 12-week rolling view once store counts level out. After you have a stable read, compare the SKU against channel benchmarks.
UPSPW vs. Dollar-Based Velocity
UPSPW tracks unit movement. Dollar velocity tracks revenue per store per week. Both help, but UPSPW is the cleaner benchmark for shelf productivity because it isn't changed by price shifts or promo discounting.
| Metric | Formula | Best Used For |
|---|---|---|
| UPSPW | Units Sold ÷ Stores Selling ÷ Weeks | Benchmarking shelf performance and productivity |
| Dollar Velocity | Revenue ÷ Stores Selling ÷ Weeks | Comparing performance across price points |
That benchmark matters because the same UPSPW can look weak, healthy, or strong depending on the channel. Once the metric is clear, the next move is to figure out what good UPSPW looks like by channel and category.
UPSPW Benchmarks by Channel and Product Type
UPSPW targets change by channel, traffic, category, price point, and shelf placement. That’s why one “good” number can look solid in one store and weak in another. These benchmarks help show whether a new CPG SKU is moving fast enough to keep shelf space, replenish on time, and earn a shot at more doors.
Natural and Conventional Grocery Benchmarks
Natural grocery can work with lower velocity because store traffic is lower and assortments are tighter. In many natural sets, 2–3 UPSPW can be viable, though it may still be at risk in crowded categories. 3–5 UPSPW is a healthy range that supports steady replenishment. And 5+ UPSPW held for 8–12 weeks is often strong enough to start the conversation about expansion.
Conventional grocery sets a higher bar. A large multi-brand analysis at Kroger found that the median item sells about 2 units per store per week, the 75th percentile hits 3.57 UPSPW, and the 90th percentile reaches 7.12 UPSPW. So in plain terms, conventional chains tend to sit near the top end of each range.
| Channel | Underperforming | Healthy | Strong |
|---|---|---|---|
| Natural Grocery – Center Store | <2 UPSPW | 3–5 UPSPW | 5+ UPSPW |
| Conventional Grocery – Center Store | <3 UPSPW | 4–6 UPSPW | 6+ UPSPW |
These bands help answer a simple question: is the SKU just sitting on shelf, or is it moving enough to earn replenishment?
Mass Retail and Fast-Moving Beverage Benchmarks
Mass retail and fast-moving beverage sets usually need higher velocity because buyers expect faster turns.
For ambient shelf beverages like multipacks or larger formats in a secondary aisle, 5–8 UPSPW is a healthy range for a new SKU, and 8+ UPSPW is strong. Refrigerated and grab-and-go placements move faster on purpose. In those spots, 6–10 UPSPW is healthy, while 10+ UPSPW is strong for single-serve or impulse formats.
A good example: if a new RTD drink is sitting at 4 UPSPW in a grab-and-go cooler, that usually points to weak placement, weak demand, or both.
| Placement | Underperforming | Healthy | Strong |
|---|---|---|---|
| Mass Retail – Ambient Beverage (Multipacks) | <5 UPSPW | 5–8 UPSPW | 8+ UPSPW |
| Mass Retail – Refrigerated Beverage (Single-Serve) | <6 UPSPW | 6–10 UPSPW | 10+ UPSPW |
| Mass Retail – Front-of-Store Grab-and-Go | <6 UPSPW | 6–10 UPSPW | 10+ UPSPW |
Premium and Specialty Categories with Lower Unit Expectations
Premium categories often come with higher price points, so buyers look at margin dollars along with unit turns.
| Category | Underperforming | Healthy | Strong | Typical Price Range |
|---|---|---|---|---|
| Supplements (Premium) | <1 UPSPW | 1–3 UPSPW | 3+ UPSPW | $20–$50 |
| Beauty / Personal Care (Specialty) | <1 UPSPW | 1–3 UPSPW | 3+ UPSPW | $25–$50 |
| Higher-Price Specialty Items | <1 UPSPW | 1–2 UPSPW | 2+ UPSPW | $40+ |
A $29.99 supplement at 1.5 UPSPW generates about $45 in weekly retail sales per store. That’s why lower unit velocity doesn’t always mean weak shelf performance. In premium categories, dollar velocity and margin contribution can tell the more useful story.
On the flip side, a premium beauty item priced at $39.99 and selling below 1 UPSPW in conventional grocery may simply be in the wrong channel. It may fit better in specialty retail or an online-first setup.
At lower unit velocities, dollar velocity and margin contribution become the more meaningful signals of whether a premium item is earning its shelf space.
When a SKU falls below these ranges, the problem is often placement, fit, or distribution, not only raw sales volume. The next step is turning these velocity bands into reorder and inventory calls.
How to Use Velocity Data for Reorders, Inventory, and Store Decisions
Those benchmarks only matter if they change what you order and where you put your money. Once you know a SKU's velocity, you can use it to make sharper calls on reorders, inventory, and expansion.
What Underperforming, Healthy, and Strong Velocity Mean in Practice
Velocity is a decision tool, not just a score. Each band should lead to a clear next step:
| Velocity Band | Action |
|---|---|
| Low velocity | Smaller orders, pause expansion, audit store execution |
| Healthy velocity | Standard replenishment with lead time + safety stock coverage |
| Strong velocity | Larger orders, request additional facings, expand to more doors |
A simple way to estimate reorder needs is:
UPSPW × active stores × (lead time + safety stock weeks)
For example, if a product is moving at 2.0 UPSPW across 100 stores, with a 6-week lead time and a 4-week safety stock goal, you'd need about 2,000 units to stay covered through that period.
If a SKU starts missing the mark, don't rush to change the forecast. First, figure out what's dragging performance down.
How to Tell Whether the Problem Is the Product, the Store, or Distribution
Low UPSPW doesn't always mean people don't want the product. Sometimes the issue is product fit. Other times, it's store execution or a gap in distribution. Before cutting orders, sort those out.
If a SKU underperforms in almost every store, even with correct pricing, enough facings, and steady in-stock levels, that's a stronger sign of a fit problem. But when velocity looks good in some stores and weak in others, execution is usually the better bet.
Common issues include:
- Poor shelf placement
- Missing shelf tags
- Incorrect UPCs
- Product sitting in a backroom
One simple check can tell you a lot: zero on-hand combined with zero sales usually points to a supply or replenishment failure, while positive on-hand combined with zero sales usually means the product is in the store but not on shelf.
Before you make a call on demand, audit placement, facings, pricing, and promo execution. Give the SKU 8–12 weeks of corrected execution before treating low velocity as a demand signal instead of an operations problem.
Once you know the cause, you can feed that velocity signal into your inventory plan.
Using UPSPW in Forecasting and Replenishment with Forstock
For omnichannel brands that manage both retail accounts and a Shopify storefront, Forstock puts retail POS data, Shopify orders, and warehouse inventory into one view. That makes it easier to track UPSPW trends by SKU and account, flag stock risks based on current velocity and lead times, and turn those signals into purchase-order recommendations that already account for safety stock targets and supplier constraints.
Conclusion: A Simple Way to Judge Early Retail Performance
Good sales velocity depends on the category, stays steady over time, and needs to be strong enough to support reorders without piling up extra stock.
Key Benchmarks and Decisions to Keep in Mind
Once you know the benchmark range, the next step is simple: check whether velocity is steady enough to support reorder calls. Track UPSPW across 4- to 12-week windows instead of reacting to one hot week or one slow week.
For inventory planning, use UPSPW alongside a coverage metric. Units on hand tells you how much inventory you have. Days of cover tells you how long that inventory is likely to last. Any SKU with less than 14 days of cover should get immediate attention.
Set velocity targets by channel and category, then use the trend to shape replenishment and expansion decisions. That’s how early sell-through data turns into smarter calls on what to restock and where to grow next.
FAQs
How soon after launch should I trust UPSPW?
Trust UPSPW once you have at least a few full weeks of sell-through. Then keep updating it as new weekly numbers come in.
Sales and inventory data can lag by 12 to 72 hours, so don’t make calls from a single day’s snapshot. Look at the trend over time, not just one week. If sales start to slow after a strong launch, that can be an early sign that something’s off.
Should I track UPSPW by SKU or brand?
Yes - track UPSPW by SKU.
Items under the same brand often move at different speeds. If you only look at brand-level averages, it's easy to miss weak spots or assume every product is doing fine when some clearly aren't.
Tracking at the SKU level gives you a much clearer read on demand. It helps you forecast sales, set reorder points, and spot which items are healthy, underperforming, or getting close to a stockout.
What if velocity is good in some stores but weak in others?
That usually points to local demand, logistics, or store-level execution - not one company-wide issue. If you roll everything into one average, you can miss what’s going wrong at a specific location.
Treat each store as its own operation. Use location-specific sales velocity to set reorder points, lead times, and safety stock. Then track weeks of supply and sell-through to tell whether a store is underperforming or simply needs a different inventory plan.
Keep reading
Try Forstock free for 14 days.
AI-powered demand forecasting and reorder automation for Shopify brands. No credit card required.