Top 5 Safety Stock Formulas for eCommerce Brands
No single formula fits all—match safety stock methods to your demand and supplier reliability to avoid stockouts without tying up capital.
Top 5 Safety Stock Formulas for eCommerce Brands
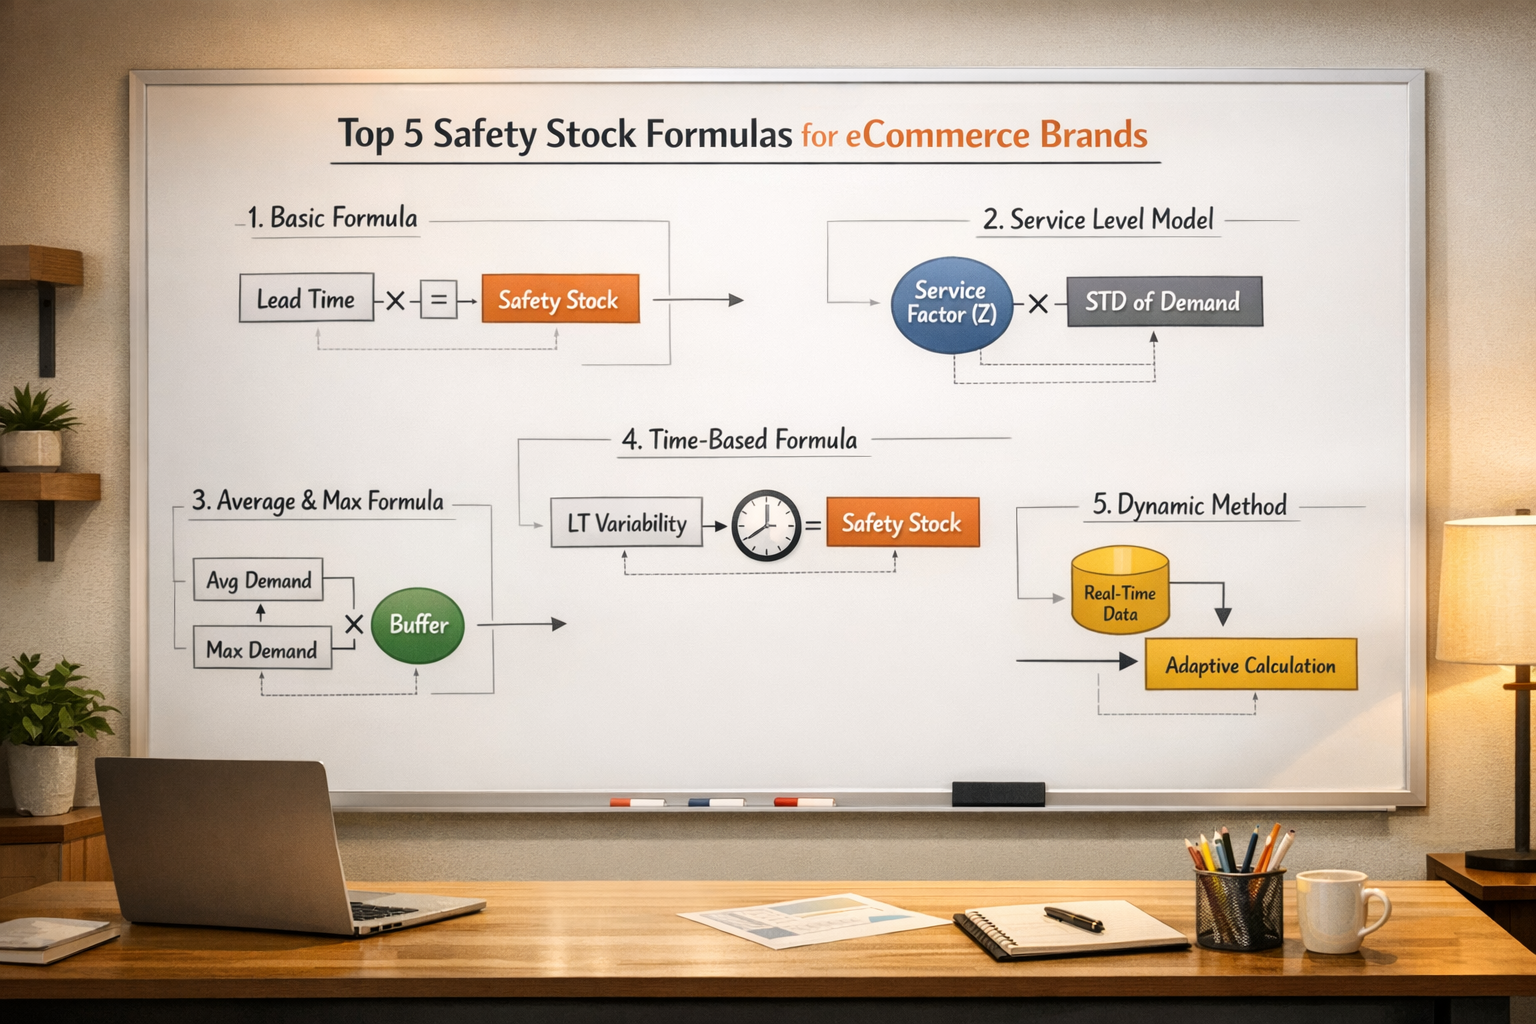
Safety stock is your safety net against stockouts and unexpected demand surges. Calculating it correctly ensures you avoid overstock vs. stockouts to prevent lost sales without overloading on inventory. Here are the top 5 safety stock formulas every eCommerce brand should know:
-
Basic Usage Formula: Ideal for steady sales and reliable suppliers.
Formula:(Max Daily Sales × Max Lead Time) - (Avg Daily Sales × Avg Lead Time)
Example: Results in 400 units for a clothing retailer with peak sales of 100 units/day and a 7-day lead time. -
Days of Coverage Formula: Best for stable demand and predictable suppliers.
Formula:Days of Coverage × Avg Daily Sales
Example: A 5-day buffer for 100 daily sales equals 500 units. -
Service Level Formula: Tailored for critical items with volatile demand.
Formula:Z × σ_D × √LT
Example: A 95% service level with variable demand calculates safety stock based on demand uncertainty. -
Combined Variability Formula: Handles fluctuating demand and lead times.
Formula:Z × √[(Avg LT × σ²_D) + (Avg D² × σ²_LT)]
Example: For volatile operations, this method ensures comprehensive risk coverage. -
Lead Time Driven Formula: Focuses on unpredictable supplier delays.
Formula:Z × Avg Daily Sales × σ_LT
Example: A 90% service level for 85 daily sales with an 8-day lead time variation equals 870 units.
Quick Tip: Choose a formula based on your business’s demand patterns, supplier reliability, and operational complexity. Tools like Forstock can automate these calculations, saving time and reducing errors.
Safety Stock Calculation Explained | 5 Methods Of Calculating Safety Stock | Safety Stock Inventory
sbb-itb-f0fc809
How Safety Stock Works in eCommerce
Safety stock revolves around managing demand unpredictability, lead time inconsistencies, and desired service levels. Demand variability refers to how sales fluctuate daily or weekly. If your sales are steady, you’ll need a smaller safety stock. But if your sales are unpredictable or seasonal, you’ll need a larger buffer. Lead time variability, on the other hand, accounts for delays caused by issues like supplier capacity problems, port strikes, or global disruptions that can throw off delivery schedules.
Your target service level plays a big role in how much safety stock you’ll need. For instance, a 95% service level means you’re accepting a 5% chance of stockouts, whereas aiming for 99% reduces that risk to just 1%. However, achieving that higher service level requires significantly more safety stock - up to 40–50% more for the same product. This is because higher service levels rely on larger Z-scores, which translate to bigger inventory buffers.
Safety stock also ties directly to your reorder point (ROP), the threshold that signals it’s time to place a new order. The formula looks like this:
ROP = (Average Daily Demand × Lead Time) + Safety Stock.
When your inventory dips to this level, it’s time to reorder. The quantity you order will typically cover your forecasted sales, account for safety stock, and subtract any current stock already on hand. With so many moving parts, managing this manually can quickly become overwhelming.
That’s where automation tools like Forstock come in. Forstock simplifies the process by analyzing real-time sales data, factoring in actual supplier lead times instead of relying on static estimates, and recalculating reorder points nightly. It also adjusts safety stock dynamically to account for seasonal trends, promotions, or shifting market conditions. This level of automation reduces errors while helping you avoid costly stockouts or excess inventory.
1. Basic Usage Based Safety Stock Formula
The Basic Usage Based Safety Stock Formula, also known as the Average-Max method, calculates your inventory buffer by comparing worst-case scenarios with average operations. The formula is:
Safety Stock = (Maximum Daily Sales × Maximum Lead Time) – (Average Daily Sales × Average Lead Time).
To apply this formula, you’ll need four key data points:
- Maximum Daily Sales: The highest number of units sold in a single day, often during peak events like Black Friday or viral surges.
- Maximum Lead Time: The longest time it has ever taken for a supplier to fulfill an order.
- Average Daily Sales: The total units sold divided by the number of days in the observed period.
- Average Lead Time: The average delivery time across multiple orders.
Here’s an example: Imagine a clothing retailer with the following data:
- Maximum daily sales: 100 units
- Maximum lead time: 7 days
- Average daily sales: 60 units
- Average lead time: 5 days
Using the formula:
(100 × 7) – (60 × 5) = 700 – 300 = 400 units
"The basic safety stock formula is a good starting point for most businesses as it provides a serviceable ballpark estimate when specifics about variables are unknown." - NetSuite
This method is most effective for businesses with steady sales patterns and suppliers whose delivery times are generally predictable. However, it’s less suitable for products with sharp seasonal fluctuations. Relying on annual averages can result in understocking during high-demand periods and overstocking during slower months. To ensure accuracy, you’ll need at least 12 months of historical data to account for peak demand and potential delivery delays. Additionally, calculate lead times based on actual supplier performance and monitor each supplier individually.
This formula serves as a solid foundation for more advanced models, like the Days of Coverage method, which we’ll explore next.
2. Days of Coverage Safety Stock Formula
The Days of Coverage Safety Stock Formula, sometimes called the Time-Based Calculation or Fixed Safety Stock method, calculates your buffer inventory based on a fixed number of days of stock. The formula itself is simple:
Safety Stock = Days of Coverage × Average Daily Sales.
Here’s how it works: multiply your average daily sales by the number of days you want to maintain as a buffer. For instance, if your average daily sales are 100 units and you want a 5-day buffer, your safety stock would be 5 × 100 = 500 units.
This approach is particularly effective for businesses with stable demand and predictable lead times. It’s also ideal for products with consistent customer demand or high sell-through rates. Many brands start by setting safety stock at 50% of their lead-time demand and then adjust upward if stockouts continue to occur. If stockouts are frequent, you might increase your coverage days (e.g., from 14 to 21 days). On the other hand, if you’re dealing with surplus inventory, reducing the coverage period can help.
"Safety stock is best suited for products with a high sell-through rate or long supplier lead time." - Marijana Kay, Shopify
That said, this method has its limitations. It doesn’t automatically adjust for unexpected changes, like supplier delays or a sudden spike in demand (think: a product going viral). In these cases, manual intervention is necessary to recalibrate the safety stock. Another drawback is the potential for increased storage costs - typically 15% to 30% of the item’s value per year - if the coverage period is set too high. This also raises the risk of accumulating dead stock, which can hurt profit margins. Because of this, it’s not a good fit for seasonal products, as it doesn’t account for rapid fluctuations in demand.
Up next, we’ll explore a formula that incorporates service level metrics for more precise calculations.
3. Service Level Based Safety Stock Formula
The Service Level Based Safety Stock Formula, also known as the Normal Distribution method, uses statistical probability to calculate how much extra inventory you need to avoid stockouts. The service level represents the likelihood of fulfilling orders without running out of stock. For instance, a 95% service level means you're prepared to accept a 5% chance of a stockout.
This method hinges on the Z-score, a statistical value tied to your chosen service level. For example, achieving a 90% service level corresponds to a Z-score of 1.28, while a 99% service level requires a Z-score of 2.33. Keep in mind, aiming for higher service levels can significantly increase your safety stock - sometimes by as much as 40–50%.
The formula for demand uncertainty:
Safety Stock = Z × σ_D × √LT
- σ_D: Standard deviation of daily demand
- LT: Average lead time
To calculate safety stock accurately, you'll need reliable historical data on daily sales to determine average demand and its variability. You'll also need precise tracking of lead times and a clearly defined service level target.
This approach works particularly well for high-value items where the cost of losing a sale outweighs the expense of holding extra inventory. For example, in 2025, The Little Potato Company significantly boosted its inventory fill rate using this method. Similarly, an industrial electrical distributor with $35 million in annual revenue applied a 95% service level to commercial circuit breakers. With an average monthly demand of 93.7 units, a demand standard deviation of 9.3 units, and a 0.74-month lead time, they determined that maintaining 14 units of safety stock prevented 3–4 stockouts annually. This adjustment resulted in a net benefit of $2,400–$3,200, while the carrying cost was only $446.
| Desired Service Level | Z-Score | Risk of Stockout |
|---|---|---|
| 90% | 1.28 | 10% |
| 95% | 1.65 | 5% |
| 97.5% | 1.96 | 2.5% |
| 99% | 2.33 | 1% |
You can further refine this approach by using ABC analysis to assign different service levels based on product importance. High-value, fast-moving items might justify a 95–99% service level, while less critical products could be maintained at 85–90% to better manage capital. Always ensure your historical data is accurate and clean to optimize your inventory turnover metrics, and round up your safety stock calculation to the nearest whole unit to meet your targets effectively.
Next, we’ll explore a formula that accounts for both demand and lead time variability.
4. Combined Demand and Lead Time Variability Formula
When both demand and lead times fluctuate unpredictably, a more advanced approach is necessary. The Combined Demand and Lead Time Variability Formula addresses the compounded risks that arise when supplier delays align with unexpected sales surges - a scenario that simpler methods often fail to account for.
The formula:
Safety Stock = Z × √[(Avg. Lead Time × σ²_Demand) + (Avg. Demand² × σ²_Lead Time)]
This formula captures how supplier inconsistencies amplify stockout risks by factoring in the squared average demand and multiplying it by lead time variance. To apply it, you'll need the standard deviation of demand, standard deviation of lead time, average demand, average lead time, and an appropriate Z-score based on your desired service level.
Example Calculation:
Suppose a brand has a daily demand of 100 units (σ = 10), an average lead time of 30 days (σ = 5), and aims for a 95% service level (Z = 1.65). The calculation would look like this:
1.65 × √[(30 × 100) + (10,000 × 25)]
= 1.65 × √(3,000 + 250,000)
≈ 1.65 × 502.99
≈ 830 units.
This example highlights how the formula integrates uncertainties from both demand and lead time, making it particularly effective for managing volatile supply chains.
This method is especially valuable for brands dealing with challenges like international shipping delays, port congestion, or sudden demand spikes. It’s best applied to high-value or high-volume items where stockouts are most costly, rather than slower-moving products. To get accurate results, use historical lead time data while excluding anomalies, and revisit these calculations monthly or quarterly since eCommerce demand patterns can change quickly.
For brands using tools like Forstock, incorporating this formula into your inventory management process is straightforward. With features like real-time demand forecasting and automated analytics, the platform ensures your safety stock levels adjust seamlessly to shifting market conditions.
5. Lead Time Driven Safety Stock Formula
When customer demand is steady but supplier delivery times are unpredictable, the Lead Time Driven Safety Stock Formula is a practical solution. Instead of accounting for both demand and lead time variability, this formula zeroes in on lead time fluctuations - the changes in the time it takes to receive stock after placing an order.
The formula:
Safety Stock = Z × Average Daily Sales × standard deviation of lead time (σLT)
This method works under the assumption that demand remains consistent, while lead times vary. It's particularly helpful for businesses that rely on international suppliers or face challenges like port congestion or customs delays. To calculate safety stock, you'll need three key inputs: your desired service level (Z-score), average daily demand, and historical lead time data to determine the standard deviation. This straightforward approach is perfect for situations where demand is stable but delivery times are less predictable.
Example Calculation:
Imagine an eCommerce store with average daily sales of 85 units, a 90% service level (Z = 1.28), and a lead time standard deviation of 8 days. The calculation would look like this:
1.28 × 85 × 8 = 870.4, which rounds to 870 units of safety stock.
As Bizowie advises:
"Use your actual lead time, not your supplier's quoted lead time. If your supplier quotes 2 weeks but consistently delivers in 3 weeks, use 3 weeks in your calculation."
– Bizowie
This formula shines when dealing with international suppliers or B2B vendors impacted by global shipping delays. To get accurate results, analyze delivery data from the past 6–12 months to understand real lead time variability. For high-priority SKUs, aim for service levels between 95–98%, while slower-moving products can manage with smaller safety stock buffers. Regularly update your calculations to reflect changes in supplier performance - outdated data can either tie up too much capital or leave you vulnerable to stockouts.
Comparison Table
Safety Stock Formula Comparison Guide for eCommerce
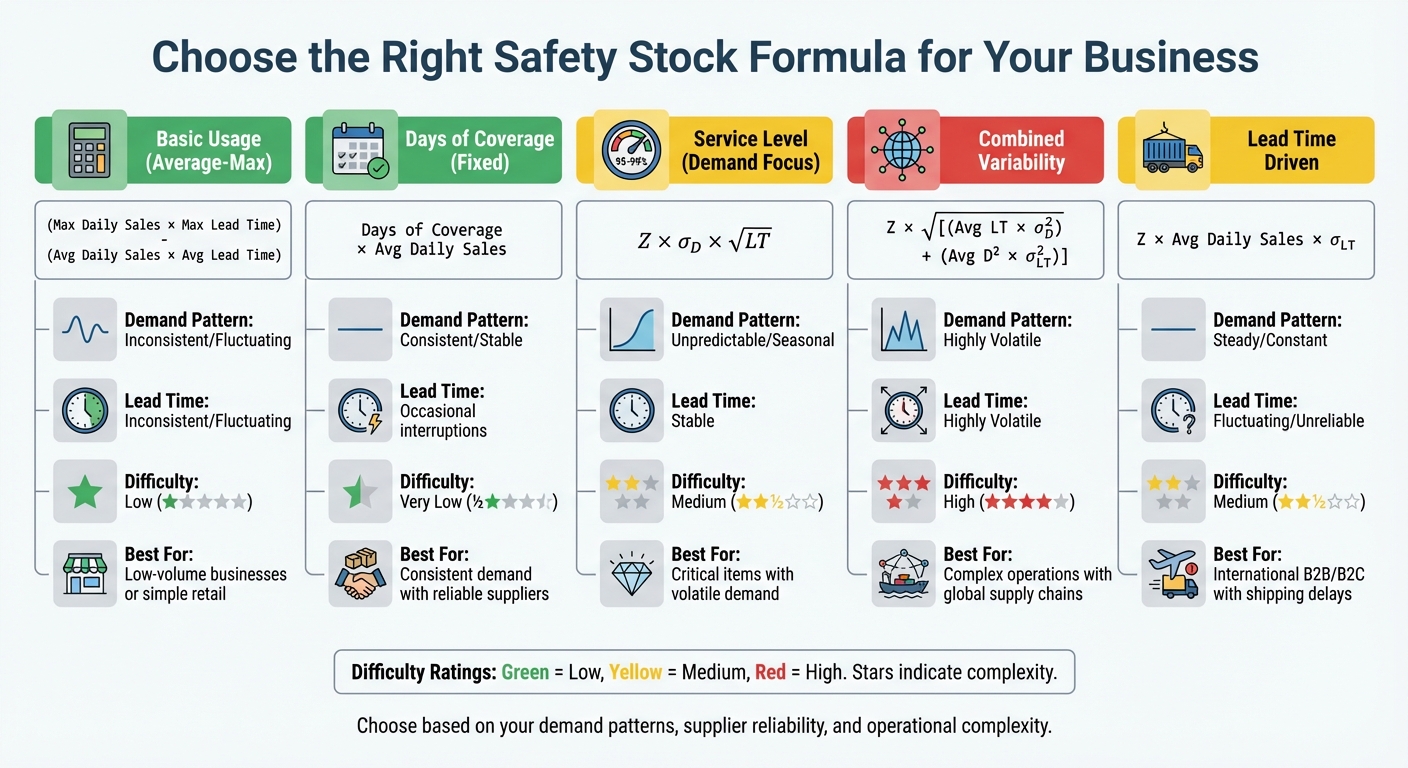
Selecting the right safety stock formula depends on how predictable your sales are, how reliable your suppliers can be, and your comfort with handling statistical calculations. The table below breaks down key factors like demand patterns, lead time consistency, calculation complexity, and the best scenarios for each formula:
| Formula Type | Demand Pattern | Lead Time Consistency | Calculation Difficulty | Best Use Case |
|---|---|---|---|---|
| Basic Usage (Average-Max) | Inconsistent / Fluctuating | Inconsistent / Fluctuating | Low | Low-volume businesses or simple retail |
| Days of Coverage (Fixed) | Consistent / Stable | Occasional interruptions | Very Low | Consistent demand with reliable suppliers |
| Service Level (Demand focus) | Unpredictable / Seasonal | Stable | Medium | Critical items with volatile demand |
| Combined Variability | Highly Volatile | Highly Volatile | High | Complex operations with global supply chains |
| Lead Time Driven | Steady / Constant | Fluctuating / Unreliable | Medium | International B2B or B2C with shipping delays |
This table highlights the strengths and ideal applications of each formula. For businesses dealing with seasonal spikes or unpredictable demand, the Service Level Based formula is a smart choice, as it adjusts to demand variability. On the other hand, the Lead Time Driven formula is perfect for addressing delays in delivery schedules. For operations with extreme volatility, the Combined Variability formula provides a more comprehensive approach.
For simpler needs, Basic Usage and Days of Coverage work well, especially for small catalogs or businesses just starting out. However, as Netstock explains, "days of supply tends to overstock slow-moving items and understock volatile ones, while statistical methods adjust proportionally to each item's actual variability". This makes statistical methods a must for companies managing hundreds of SKUs, as they help maintain a balance between service levels and working capital.
To make the most of these formulas, segment your inventory strategically. Use highly precise formulas (aiming for 95–98% service levels) for your "A" items, which are your most valuable products. For lower-priority "C" items, simpler methods will suffice. This approach ensures you allocate your resources efficiently while keeping fulfillment rates high. These insights are key to fine-tuning your inventory management strategy.
Conclusion
Picking the right safety stock formula boils down to matching your approach to the specific needs of your business. If you’re just starting out or working with a small, predictable product catalog, simpler methods like Basic Usage or Days of Coverage are practical options. They don’t require complex calculations or extensive historical data. However, as your business grows and demand patterns become harder to predict, you’ll benefit from more advanced strategies like Service Level Based or Lead Time Driven formulas. These approaches help strike a balance between maintaining stock availability and managing cash flow. For companies handling international suppliers or facing highly variable demand, the Combined Variability formula offers a more comprehensive safety net. This progression reflects the natural evolution of inventory management discussed earlier.
The best way to approach safety stock planning is to start with straightforward methods and adapt as your data quality and operational complexity improve. Be sure to clean your sales data by excluding one-off bulk orders or spikes from promotions, and use tools like ABC analysis to prioritize your efforts. For instance, you can apply detailed, high-service-level formulas to your top-performing "A" items while keeping simpler buffers for less critical "C" items. As your inventory grows more complex, manual calculations often become unsustainable, paving the way for automation.
When managing hundreds of SKUs, automation is no longer optional - manual spreadsheets become too cumbersome and error-prone. That’s where tools like Forstock step in. Forstock recalculates safety stock levels in real time, factoring in sales trends, supplier lead times, and seasonality. It integrates seamlessly with Shopify, providing demand forecasting, automated reorder suggestions, and even purchase order creation - all within a single dashboard. These features, as highlighted earlier, ensure your inventory management evolves alongside your business.
FAQs
How can I choose the best safety stock formula for my eCommerce business?
Choosing the right safety stock formula hinges on your business's specific needs and how much demand and supply fluctuate. Safety stock serves as a cushion to safeguard against unexpected surges in demand or delays in supply, making it crucial to have a solid grasp of your sales data and lead times.
The first step is to evaluate the quality of your data. If your sales and lead times are consistent, a straightforward formula like average demand × lead time + safety stock might do the job. However, if demand and lead times tend to be more erratic, you may need to rely on more advanced formulas that factor in variability.
For a hands-off, accurate approach, Forstock offers a solution tailored to Shopify users. By analyzing your sales and supplier data, it uses AI-driven forecasts to recommend optimal safety stock levels for each product. This not only saves you time but also ensures your inventory decisions are backed by reliable data.
What should I consider when calculating safety stock for seasonal products?
When working out safety stock for seasonal products, you need to juggle several key factors to strike the right balance between meeting demand and avoiding overstocking. Start with demand variability - this is especially crucial during peak seasons when customer needs can fluctuate significantly. Then, factor in lead-time variability, or how long it typically takes to replenish your stock.
Your target service level is another critical piece of the puzzle. This reflects how often you aim to fulfill orders without running into delays. On top of that, it’s essential to assess the accuracy of your demand forecasts. The better your predictions, the easier it is to align stock levels with actual needs.
Don’t forget about your supply chain. The reliability of suppliers and the potential for delays can have a big impact on your ability to restock efficiently. By carefully weighing these elements, you’ll be in a stronger position to handle demand shifts while keeping stockouts and excess inventory to a minimum.
How does Forstock help streamline safety stock management?
Forstock takes the hassle out of managing safety stock by leveraging AI-driven demand forecasting. It analyzes sales trends, lead times, and seasonal fluctuations to adjust safety stock levels in real time. This means fewer stockouts, less overstocking, and a more efficient inventory system.
The platform also handles repetitive tasks like creating purchase orders and tracking inventory levels automatically. By reducing manual errors and saving time, Forstock offers eCommerce businesses a clear view of stock performance. This allows brands to meet customer needs seamlessly while keeping cash flow in check.
Keep reading
Try Forstock free for 14 days.
AI-powered demand forecasting and reorder automation for Shopify brands. No credit card required.