5 Steps to Optimize Reorder Points for Variants
Five steps to set reorder points and safety stock by variant: analyze sales, calculate lead times, add buffers, automate in Shopify, and refine with forecasting.

5 Steps to Optimize Reorder Points for Variants
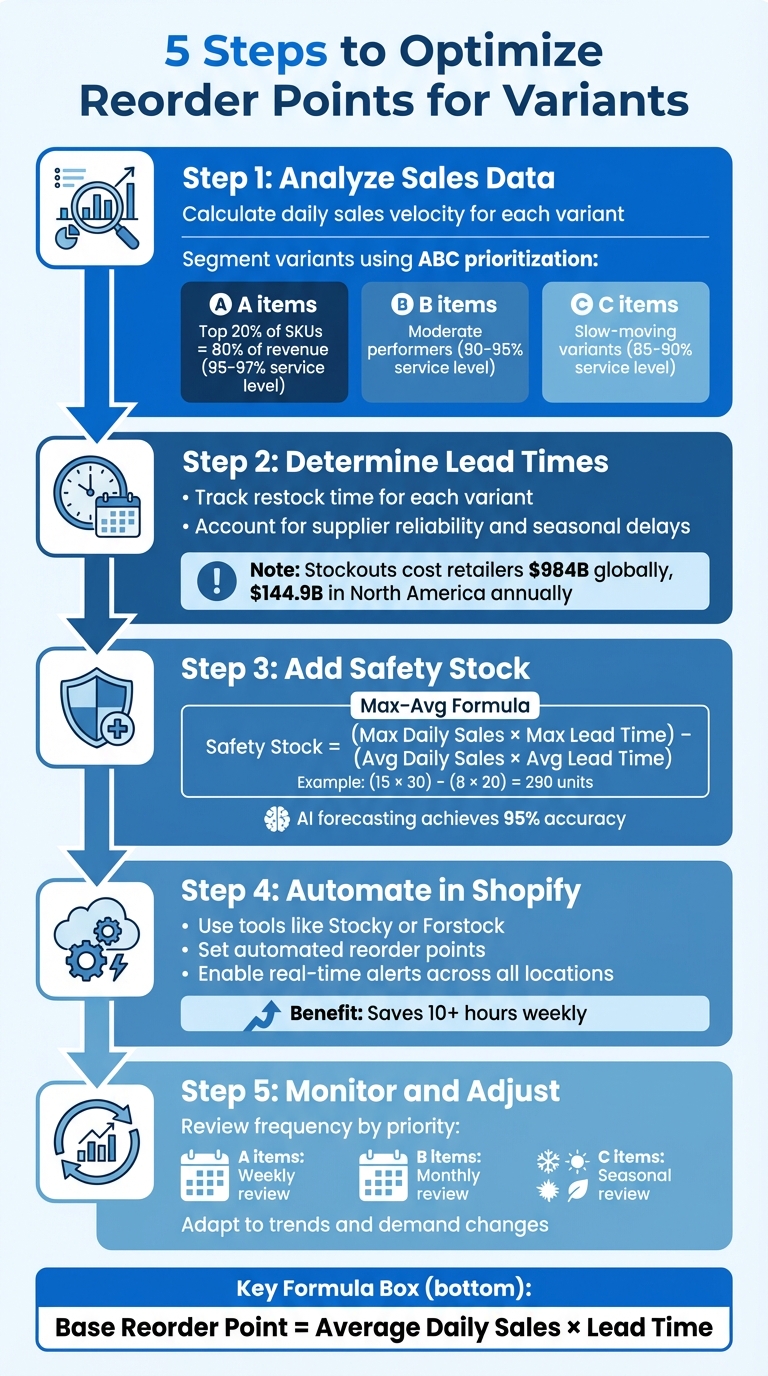
When managing inventory for multiple product variants, like sizes or colors, setting accurate reorder points is critical to avoid stockouts or overstocking. Here's a quick guide:
- Analyze Sales Data: Calculate daily sales velocity for each variant using historical data to identify fast and slow movers. Segment variants into A (top sellers), B (moderate), and C (slow-moving) categories.
- Determine Lead Times: Track how long it takes to restock each variant, accounting for supplier reliability and seasonal delays. Use this to calculate base reorder points.
- Add Safety Stock: Include a buffer for unexpected demand spikes or delays using the Max-Avg formula.
- Automate in Shopify: Use tools like Stocky or Forstock to set and automate reorder points, track inventory, and receive alerts.
- Monitor and Adjust: Regularly review and update reorder points to reflect changes in demand, trends, and lead times.
Key Formula:
- Base Reorder Point = Average Daily Sales × Lead Time
- Safety Stock = (Max Daily Sales × Max Lead Time) − (Avg Daily Sales × Avg Lead Time)
Forstock's AI-powered tools simplify these steps by automating calculations, tracking inventory across locations, and providing real-time alerts. This ensures better stock management, fewer stockouts, and improved cash flow.
5-Step Process to Optimize Inventory Reorder Points for Product Variants
How Do You Calculate Safety Stock and Reorder Points in Inventory Management? | Unleashed
sbb-itb-f0fc809
Step 1: Analyze Historical Sales Data for Each Variant
The first step in refining your inventory strategy is calculating the daily sales velocity for each variant. This metric tells you how many units of a specific variant sell per day, which is essential for determining when to reorder.
Shopify treats each variant as its own SKU.
To calculate sales velocity, simply divide the total units sold by the number of days in your analysis period. For established products, use 30–60 days of data. For stable items, a 90–180 day range works well. Seasonal products benefit from year-over-year data. Once you've done this, break down your data by variant to uncover specific sales trends.
Segment Data by Variant
Breaking down sales data by variant helps you identify which items are fast sellers and which are slower to move. This is where ABC prioritization becomes useful. Here's how it works:
- "A" items: The top 20% of SKUs that generate 80% of your revenue. These require close monitoring, often weekly, with service levels between 95% and 97%.
- "B" items: These are moderate performers and can be reviewed monthly. Aim for service levels between 90% and 95%.
- "C" items: Slower-moving variants that can be checked seasonally, with service levels around 85%–90%.
For example, TechGear used an automated inventory tool to identify over $70,000 worth of slow-moving stock in just one week. By segmenting their inventory, they pinpointed which colors and sizes were tying up cash flow and adjusted their purchasing strategy accordingly.
This detailed segmentation ensures that each variant’s distinct demand is factored into your inventory planning, paving the way for reorder point calculations for Shopify.
Use Automated Tools for Data Analysis
After segmenting your variants, automation can streamline the analysis process and improve accuracy. Relying on spreadsheets to manage multiple locations and variants is inefficient. Tools like Forstock's Inventory Table centralize your sales data, automatically calculate daily velocity, and predict depletion dates. The dashboard flags variants as "Stock Gap", "Running Low", or "Healthy" (indicating 20–50 days of stock) based on real-time data.
Shopify users can also leverage the "Inventory sold daily by product" report in Shopify Analytics, which provides the "Quantity sold per day" metric automatically. From there, Forstock can handle ongoing velocity recalculations as sales patterns change, ensuring you’re always working with up-to-date data instead of outdated averages.
Step 2: Determine Lead Times for Each Variant
Now that you’ve analyzed how quickly each variant sells, the next step is figuring out how long it takes to restock each one. This is where lead times come into play. Lead time refers to the total number of days between placing an order and having that inventory ready to sell. It includes processing, production, shipping, and even a day or two for warehouse receiving.
Lead times can vary widely depending on the variant. For example, a basic t-shirt in a standard color might only take 10 days to restock, while a custom embroidered version could stretch to 30 days or more due to the added production steps. If you’re working with international suppliers, customs delays can further extend timelines, whereas domestic vendors are typically faster—though seasonal demand and lead time adjustments can impact both. Overlooking these differences can lead to stockouts - a problem that costs retailers an estimated $984 billion in lost sales globally, with North American businesses alone losing around $144.9 billion annually.
Track Lead Time Variations
To stay ahead, track the actual delivery times for your orders over the past 30–90 days and compare them to your suppliers' promised lead times. This comparison helps you gauge how reliable your suppliers are.
Tools like Forstock's supplier management features allow you to log lead times for each variant and flag delays automatically. Another useful metric is the standard deviation of lead time, which measures how consistent your supplier is. A high deviation means delivery times are unpredictable, and you’ll need to keep more safety stock on hand to avoid running out during delays. If you notice significant inconsistencies, it’s a signal to adjust your inventory buffer. You can also automate safety stock with AI to handle these fluctuations more efficiently.
Having accurate lead time data is essential - it’s the foundation for calculating safety stock and planning your reorder strategy effectively.
Calculate Base Reorder Point
Once you have reliable lead time data, you can determine the base reorder point using this formula:
Base Reorder Point = Average Daily Sales × Lead Time
Let’s say a variant sells 5 units per day, and the lead time is 20 days. In this case, your base reorder point is 100 units. This means when your stock drops to 100 units, it’s time to reorder. This ensures your new inventory arrives right when you’re about to run out.
Keep your lead time data up to date - outdated numbers can lead to either stockouts or overstocking, both of which hurt your bottom line. Accurate tracking and timely adjustments will keep your inventory running smoothly.
Step 3: Add Safety Stock for Demand Variability
While your base reorder point tells you when to restock, it doesn't factor in unexpected changes. This is where safety stock comes in - it acts as a cushion against sudden demand spikes, supplier delays, or supply chain hiccups. By analyzing past demand fluctuations, you can set a safety stock level tailored to each SKU’s risk. For instance, a limited-edition hoodie in a trendy color might need a larger buffer than a basic black t-shirt with steady sales year-round.
Adjust your safety stock and reorder points based on the season. During peak times, increase these levels to meet higher demand. In off-seasons, scale them back to free up cash flow.
How to Calculate Safety Stock
A straightforward way to calculate safety stock is by using the Max-Avg Formula:
Safety Stock = (Maximum Daily Sales × Maximum Lead Time) – (Average Daily Sales × Average Lead Time)
Let’s break this down with an example. Imagine a product typically sells 8 units daily but saw a spike to 15 units during a promotion. If the average lead time is 20 days but can stretch to 30 days during busier periods, the calculation would be:
(15 × 30) – (8 × 20) = 290 units.
Adding this buffer to your base reorder point ensures you’re prepared for demand surges and delays.
For products with highly unpredictable demand or lead times, you might explore advanced statistical models. But for many Shopify brands managing a variety of SKUs, the Max-Avg method is a practical starting point. It sets a solid baseline that can later be refined with more sophisticated tools.
AI Forecasting: A Smarter Approach
Traditional spreadsheets fall short when it comes to capturing real-time changes in demand and supply. Enter AI-powered forecasting, which identifies patterns - like seasonality, demand spikes, and trend shifts - that traditional methods often miss. Forstock’s AI models, for example, claim 95% accuracy in predicting demand variability. They dynamically optimize safety stock levels, eliminating the need for static quarterly reviews.
AI systems can also factor in external data like promotions, weather conditions, or even economic trends. This is especially useful for catalogs with many SKUs, enabling precise, SKU-level forecasts. It’s a game-changer for those "middle of the range" SKUs that manual planning might overlook. The payoff? Fewer stockouts, less overstock, and more cash available for growth.
| Service Level Goal | Z-Score (Multiplier) | Impact on Safety Stock |
|---|---|---|
| 90% | 1.28 | Lower inventory, higher risk of backorders |
| 95% | 1.65 | Balanced results for most retail SKUs |
| 98% | 2.05–2.33 | Higher costs, but fewer stockouts |
Step 4: Set and Automate Reorder Points in Shopify

Now that you've calculated reorder points and safety stock, it's time to automate these processes in Shopify. While manual tracking might work for a handful of SKUs, managing multiple variants without automation can quickly become overwhelming. Setting up a system to trigger restocks automatically is key.
Input Reorder Points into Shopify
Shopify provides tools to set reorder points, though the exact process depends on your setup. If you're using Stocky - Shopify's inventory management app for Plus merchants - it can automatically calculate reorder points based on lead times and average daily sales. You can also manually override these values for specific variants. To do this, navigate to Reports > Low Stock > SKU/Variants, then go to Settings > Reorder Points and enter your calculated reorder point in the Manual ROP column. Additionally, you can set vendor lead times under Vendors > [Vendor Name] > Settings > Lead & restock times, ensuring supplier delays are factored into your system.
For those seeking full automation, Forstock offers a more advanced solution. Its Reorder Suggestions feature uses AI-powered demand forecasting to dynamically calculate and update reorder points. This eliminates the need to input values manually. As Alexander shared:
"The automated PO creation saves us 10+ hours weekly. Setup was seamless – just 2 minutes!"
Once you've set these reorder points, the next step is monitoring inventory levels in real-time across all locations.
Enable Alerts and Multi-Location Tracking
After establishing reorder points, it's crucial to stay informed with timely alerts. Stocky allows you to enable daily email notifications by navigating to Reports > Low Stock > SKU/Variants > Settings > Report Email. While these passive alerts are helpful, they may not provide the immediacy needed for fast-paced inventory management. For real-time notifications, consider using Shopify Flow or third-party apps.
Forstock takes things up a notch with real-time stock health alerts across all locations. Its unified dashboard displays inventory levels for every physical and digital storage point, eliminating the need to juggle multiple reports. This feature becomes particularly useful for businesses managing inventory across multiple warehouses, retail stores, or third-party logistics providers.
| Feature | Shopify (Stocky App) | Forstock |
|---|---|---|
| ROP Calculation | Based on lead time + sales/day | AI-powered demand forecasting |
| Manual Adjustment | Supported in SKU/Variants report | Supported via unified dashboard |
| Alerts | Daily email reports (passive) | Real-time stock health alerts |
| PO Generation | Manual creation based on reports | Automated PO generation & supplier sync |
| Multi-Location | Tracked via Low Stock reports | Unified dashboard for all locations |
To avoid ordering mistakes, clean your demand data by removing one-time anomalies and returns. Additionally, consider supplier constraints like Minimum Order Quantities (MOQs) or case pack sizes when setting automation rules. Ensure your system calculates "Inventory Position" using this formula: On-hand + On-order − Backorders. This approach helps prevent over-ordering and keeps your inventory levels optimized. This process also allows you to forecast inventory costs more accurately to maintain healthy cash flow.
Step 5: Monitor and Adjust Reorder Points Regularly
Once you've calculated reorder points and safety stock, the next step is to keep a close eye on them. Why? Because demand, sales trends, and lead times are constantly shifting. Regular adjustments ensure your inventory stays in sync with your business needs. As Michelle Cornish from Sage explains:
"The reorder point is not something that can be set and then forgotten about. Regularly review and adjust ROP based on changes in your business environment, sales trends, and supply chain dynamics."
If you skip this step, your reorder points can easily become outdated. That could mean running out of stock at the worst time or tying up too much cash in excess inventory. Here's how to monitor and tweak your reorder points effectively.
Review Performance Regularly
Keeping tabs on your inventory performance is key to avoiding stockouts and overstock situations. Tools like Forstock's analytics dashboard can show you which SKUs are flying off the shelves and which ones are gathering dust. This kind of visibility allows you to adjust reorder points before problems arise.
To stay on top of things, review inventory at different intervals based on its importance:
- A Items: These are your top revenue drivers. Check them weekly to ensure reorder points align with demand.
- B Items: Mid-tier items can be reviewed monthly.
- C Items: Lower-priority items are fine with seasonal reviews.
Here’s a quick breakdown:
| ABC Class | Revenue Priority | Review Frequency | Target Service Level |
|---|---|---|---|
| A Items | High (Top Drivers) | Weekly | 97–99% |
| B Items | Medium | Monthly | 95–97% |
| C Items | Low | Seasonally | 90–93% |
For example, Matt, the Operations Lead at TechGear, used Forstock's real-time inventory tracking to identify $70,000 worth of slow-moving stock in just one week. With that insight, he adjusted reorder points and avoided further overstock.
Adapt to Trends with Demand Planning
Once you've reviewed performance, use demand planning to fine-tune reorder points. A 12-month demand plan can help you anticipate seasonal peaks or prepare for new product launches. With tools like Forstock, forecasting becomes much easier. The software automatically adjusts to changes in sales trends, lead times, and seasonality, so you're not left scrambling to update spreadsheets when the holidays or summer rush hits.
For seasonal products, start by establishing a baseline demand. Then, scale up reorder points during peak periods to match expected sales. When it comes to new products, things can be trickier since you don’t have historical data. In this case, you can estimate demand by looking at similar products - those with comparable brands or price points. After 4–8 weeks of actual sales, you can switch to more accurate calculations.
Conclusion
Managing reorder points for SKUs with high variability doesn’t have to be complicated. By focusing on five key steps - examining past sales data, calculating lead times, incorporating safety stock, automating processes in Shopify, and consistently tracking performance - you can keep inventory levels in check and reduce inefficiencies. This method not only ensures you have the stock you need but also boosts overall supply chain efficiency.
Examples from businesses show that fine-tuning reorder points can cut down on surplus inventory and free up working capital, making it easier to invest in other areas.
Tools like Forstock simplify this process by automating tasks like manual vs. automated purchase order creation, tracking inventory across locations, and sending alerts when stock levels drop too low. These features save time and make it easier to manage supplier relationships and stock replenishment.
Optimizing reorder points improves cash flow, reduces manual tasks, and helps you stay agile in meeting customer demand - all without tying up money in excess inventory. Whether you oversee a handful or thousands of SKUs, this strategy helps create a more efficient and adaptable supply chain.
Take it step by step, evaluate your progress, and make adjustments along the way. The sooner you start, the sooner you’ll see the benefits reflected in your business performance.
FAQs
What time period should I use to calculate sales velocity for each variant?
To get a clear picture of recent sales trends, focus on a relevant time frame - like the average daily sales over the past 30 days. This approach ensures your sales velocity calculation aligns with the current demand for each product variant, giving you a more accurate and up-to-date understanding of performance.
How do I handle reorder points when lead times vary a lot by supplier or season?
To handle reorder points when lead times fluctuate, it’s crucial to calculate safety stock and reorder points individually for each supplier or season. Start by analyzing data on maximum and average lead times, along with demand variations. During peak seasons, increase safety stock to account for potential delays and higher demand surges.
For a more efficient process, consider using advanced tools that automate these calculations. These systems can dynamically update reorder points using real-time data, helping you minimize stockouts while avoiding excess inventory.
Should I base reorders on on-hand inventory or inventory position?
To make smart reordering decisions, focus on your inventory position. This includes everything: what you currently have in stock, what's on the way, and any pending orders. By keeping track of all these factors, you can restock at the right time, avoiding the risks of running out of stock or overloading your inventory.
Keep reading
Try Forstock free for 14 days.
AI-powered demand forecasting and reorder automation for Shopify brands. No credit card required.