
Landed COGS vs Product Cost: The Hidden Costs Eating Your Margin
Don’t trust supplier price alone—use landed COGS (freight, duties, brokerage, 3PL, FX) to calculate true per‑unit margin.

Landed COGS vs Product Cost: The Hidden Costs Eating Your Margin
If you track only supplier cost, your margin can look far better than it is. I’d treat product cost as the factory price, and landed COGS as the actual per-unit cost after freight, duties, brokerage, receiving, packaging, and FX fees are added in.
Here’s the short version:
- Product cost = what the supplier billed per unit
- Landed COGS = product cost plus inbound and import costs
- A SKU that looks like $10.00 on a PO can end up at $13.85
- A margin that looks like 66.7% can drop to 53.8%
- For many U.S. brands, inbound costs can add 15% to 40%+ above the invoice price
If I were checking SKU profit, pricing, or reorder points, I would not rely on Shopify’s supplier cost field alone. I’d use landed COGS, because that’s the number tied to what I actually spent to get stock into sellable condition.
Inventory Landed Costs Explained | What's Included and How to Calculate It
sbb-itb-f0fc809
Quick Comparison
| Cost View | What it Includes | Best For | Main Risk |
|---|---|---|---|
| Product Cost | Supplier unit price only | Sourcing, quote checks, PO review | Margin looks too high |
| Landed COGS | Supplier price + freight + duties + brokerage + 3PL receiving + packaging + FX | Pricing, inventory value, SKU profit, reorders | Takes more work to track |
The article’s core point is simple: use product cost to buy, but use landed COGS to judge profit.
1. Product Cost
Product cost is the supplier’s invoice price for the finished good, per SKU. In plain English, it’s the unit price your supplier charges you.
That makes it handy for PO-level comparisons. You can line up suppliers, compare quoted unit costs, and push on pricing during negotiation. But it does not tell you your true margin.
In most cases, product cost includes the factory’s own production cost, its margin, and any basic packaging already listed on the invoice.
What’s missing? A lot of the costs that show up after the product leaves the factory:
- Inbound freight
- Duties and tariffs
- Customs brokerage
- 3PL receiving and handling
- Added packaging and inserts
- Currency conversion costs and FX swings
Those missing pieces are what turn product cost into landed COGS.
In Shopify, product cost sits in the "Cost per item" field at the variant level. That field is meant for the supplier unit price, not the full cost of getting the item ready to sell.
So use product cost for supplier comparison and PO negotiation. Just don’t use it by itself for pricing, promotions, or reorder calls. For that, you need landed COGS, which adds the inbound and handling costs product cost leaves out.
2. Landed COGS
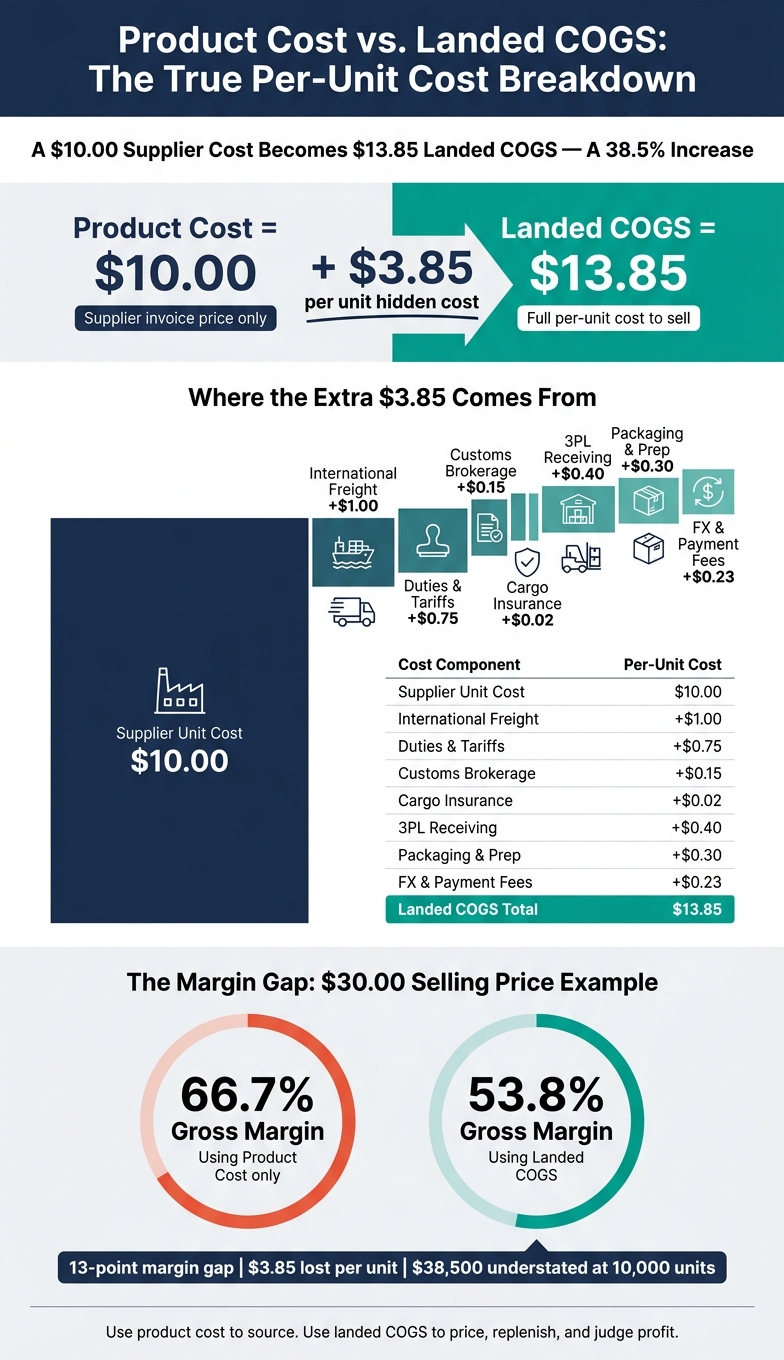
Product Cost vs. Landed COGS: The True Per-Unit Cost Breakdown
Product cost is only the starting point. Landed COGS is the full per-unit cost to get inventory into sellable stock.
That means you start with the factory cost, then add every inbound cost needed to make the item ready for sale.
Inventory cost must include all costs required to bring inventory to sale-ready condition. In plain English, that usually means costs like freight, duties, tariffs, brokerage, insurance, 3PL receiving, packaging, and FX or payment fees.
Here’s how that plays out with actual numbers. Say a SKU has a $10.00 factory cost:
| Cost Component | Calculation | Per-Unit Cost |
|---|---|---|
| Supplier unit cost | Base price | $10.00 |
| International freight | $2,000 ocean freight ÷ 2,000 units | $1.00 |
| Duties and tariffs | 5% duty + specific tariff on $10.00 declared value | $0.75 |
| Customs brokerage | $300 brokerage fee ÷ 2,000 units | $0.15 |
| Cargo insurance | $40 insurance ÷ 2,000 units | $0.02 |
| Inbound 3PL receiving | $800 receiving fee ÷ 2,000 units | $0.40 |
| Packaging and prep | Branded packaging and inserts | $0.30 |
| FX and payment fees | FX spread and bank fees on factory cost | $0.23 |
| Landed COGS | $13.85 |
So that $10.00 unit doesn’t stay $10.00 for long. Once it’s landed and ready to sell, it costs $13.85 per unit. That’s a 38.5% increase over the supplier price alone.
And that’s the figure your pricing and margin work should use. If you price the item at $30.00, the margin looks like 66.7% if you only use product cost. Use landed COGS instead, and the margin falls to 53.8%. That’s a 13-point gap and $3.85 per unit.
The same issue shows up at the inventory level. At 10,000 units, stock looks like $100,000 if you only count product cost. On a landed COGS basis, it’s $138,500. That gives you a much more honest picture of how much cash is tied up in inventory.
How to Track and Allocate Hidden Costs at the SKU Level
To use landed COGS day to day, you need to push every inbound cost down to the SKU level.
Start with all the paperwork tied to the shipment: commercial invoice, freight bill, customs entry, brokerage invoice, 3PL receiving records, packaging materials, and any FX or currency conversion fees. Then sort those charges into clear buckets: freight, duties and tariffs, brokerage, 3PL receiving, packaging, and FX. From there, assign each cost based on the billing method that fits that charge.
Use this allocation map:
| Hidden Cost Type | Allocation Basis | Formula (per SKU) |
|---|---|---|
| Freight (air or parcel) | Weight (lb.) | (SKU lb. ÷ total shipment lb.) × total freight spend |
| Freight (ocean or LTL) | Volume (cubic feet) or carton count | (SKU cu. ft. ÷ total cu. ft.) × total freight spend |
| Duties & tariffs | Customs value ($) | (SKU customs value ÷ total customs value) × total duties |
| Brokerage / clearance | Units or line count | (SKU units ÷ total units) × total brokerage fee |
| 3PL receiving | Carton or unit count | (SKU cartons ÷ total cartons) × total inbound fee |
| Packaging (shared) | Units | (SKU units ÷ total units) × total shared packaging spend |
| FX / currency impact | Invoice line amount (foreign currency) | (SKU FC amount ÷ total FC amount) × total FX gain/loss ($) |
Once each SKU has its share, divide that amount by the units received. That gives you the per-unit landed cost in USD.
If you run a Shopify brand in spreadsheets, a simple setup works well: keep one "Inbound Shipment" tab for each PO. Include units, weight, volume, customs value, and carton count. Use plain formulas so anyone can trace the math. Then either update Shopify's Cost per item with landed cost or leave supplier cost there and work out margin outside Shopify.
The key is to match the driver to the charge. Freight should be split by weight, volume, or carton count based on how the carrier billed it, not spread evenly across units. 3PL receiving should sit in inventory cost, not overhead. FX should use the actual settled exchange rate and be split by invoice line amount. Stick with one policy every time so your numbers stay clean and easy to check.
That same setup also makes landed COGS tradeoffs much easier to see. A heavier SKU, for example, may look fine at the supplier price but turn into a margin drain once freight and receiving are added in.
Pros and Cons
Once you’ve allocated landed costs down to the SKU level, the next step is simple: which cost view should you use for which decision? Product cost is good for speed. Landed COGS is better when the decision depends on actual margin.
This isn’t just an accounting detail. It changes how you price items, when you restock your Shopify inventory, and how you decide whether a SKU is worth keeping.
Product cost is quick to pull and handy for supplier comparisons, early sourcing work, and rough pricing estimates. But it stops at the supplier price. It does not include the costs that show up after the product leaves the supplier. So the tradeoff is clear: you get speed, but not precision.
Landed COGS takes more effort to keep up to date, but it gives you a much better view for pricing floors, replenishment, and SKU keep-or-cut decisions because it reflects the full per-unit cost. Put simply, product cost helps with fast sourcing calls. Landed COGS helps with buying and pricing decisions tied to profit.
| Product Cost | Landed COGS | |
|---|---|---|
| Main advantages | Fast, simple, and easy to pull from POs | Shows true per-unit margin for pricing and valuation |
| Main disadvantages | Omits freight, duties, receiving, packaging, and FX | Requires consistent allocation rules and ongoing upkeep |
| Best use cases | Early sourcing, supplier quotes, rough pricing estimates | SKU-level profitability, inventory accounting, pricing floors, purchasing, and financial reporting |
In practice, mature brands use both. Product cost acts like a quick operating shortcut the team can check at a glance. Landed COGS is the number you lean on for the calls that shape the business: what to reorder, how to price, and what to present to investors.
Use product cost for fast checks. Use landed COGS for decisions that touch margin. The right choice should come from the decision in front of you, not from whichever number is easier to find.
Conclusion
Product cost helps you source. Landed COGS shows whether you’re making money.
That’s the key difference. Product cost is a sourcing metric, not a margin metric. Landed COGS includes freight, duties, brokerage, and 3PL receiving, so it reflects the margin you actually earn. For U.S. eCommerce brands dealing with freight and tariff swings, that extra layer can add 15%–40%+ on top of the supplier invoice. And that gap can make a SKU that looks profitable on paper turn into a margin drag.
If you want to see the difference in your own business, start with one recent inbound shipment for a top-selling SKU. Pull:
- the supplier invoice
- the freight bill
- the duty and brokerage statement
- the 3PL receiving charges
Add those costs together, then divide by the units received. That gives you a much clearer per-unit number. From there, focus on the three biggest cost buckets first: inbound freight, customs duties and tariffs, and 3PL receiving fees. In most cases, those explain most of the gap.
Once you’ve locked in those major costs, keep the model up to date. Refresh allocations quarterly and after major freight or tariff changes. You don’t need a fancy system to do this. A spreadsheet for your top 10–20 SKUs is usually enough to spot margins that are being misstated.
Use product cost to source. Use landed COGS to price, replenish, and judge profit.
FAQs
What costs should I include in landed COGS?
Include every cost tied to getting inventory ready for sale, not just the supplier’s unit price.
That usually means freight, shipping, customs duties, import fees, taxes, insurance, and brokerage fees. Track these costs by shipment so you can see the full cash impact of your inventory.
If you skip those extra costs, your margins can look better than they are. In many cases, that can overstate margins by 15% to 30%.
How do I allocate inbound costs across SKUs?
Track landed costs for each shipment, then spread those costs across SKUs instead of looking only at the supplier’s unit price. That means adding in expenses like freight, duties, tariffs, brokerage, packaging, and 3PL fees.
If you use inventory management tools, build those costs into your purchase orders and update inventory values when the goods are received. That way, COGS reflects the full cost of your inventory, not just what you paid the supplier.
Should I replace supplier cost with landed COGS in Shopify?
Yes. For Shopify margin reporting, landed COGS gives a more accurate view than supplier cost alone.
Supplier unit cost leaves out expenses like freight, duties, tariffs, brokerage, and 3PL inbound fees. That gap can make margins look 15% to 30% higher than they are.
Shopify doesn't include these costs by default. So if you want clean margin reporting, you need to track them at the SKU level.
Keep reading
Try Forstock free for 14 days.
AI-powered demand forecasting and reorder automation for Shopify brands. No credit card required.