
Profitable and Broke: The 90-Day Cash Timeline of a CPG Production Run
A 90-day CPG production run can leave a profitable brand cash‑strapped as deposits, freight, duties, and slow wholesale payments lock up funds.
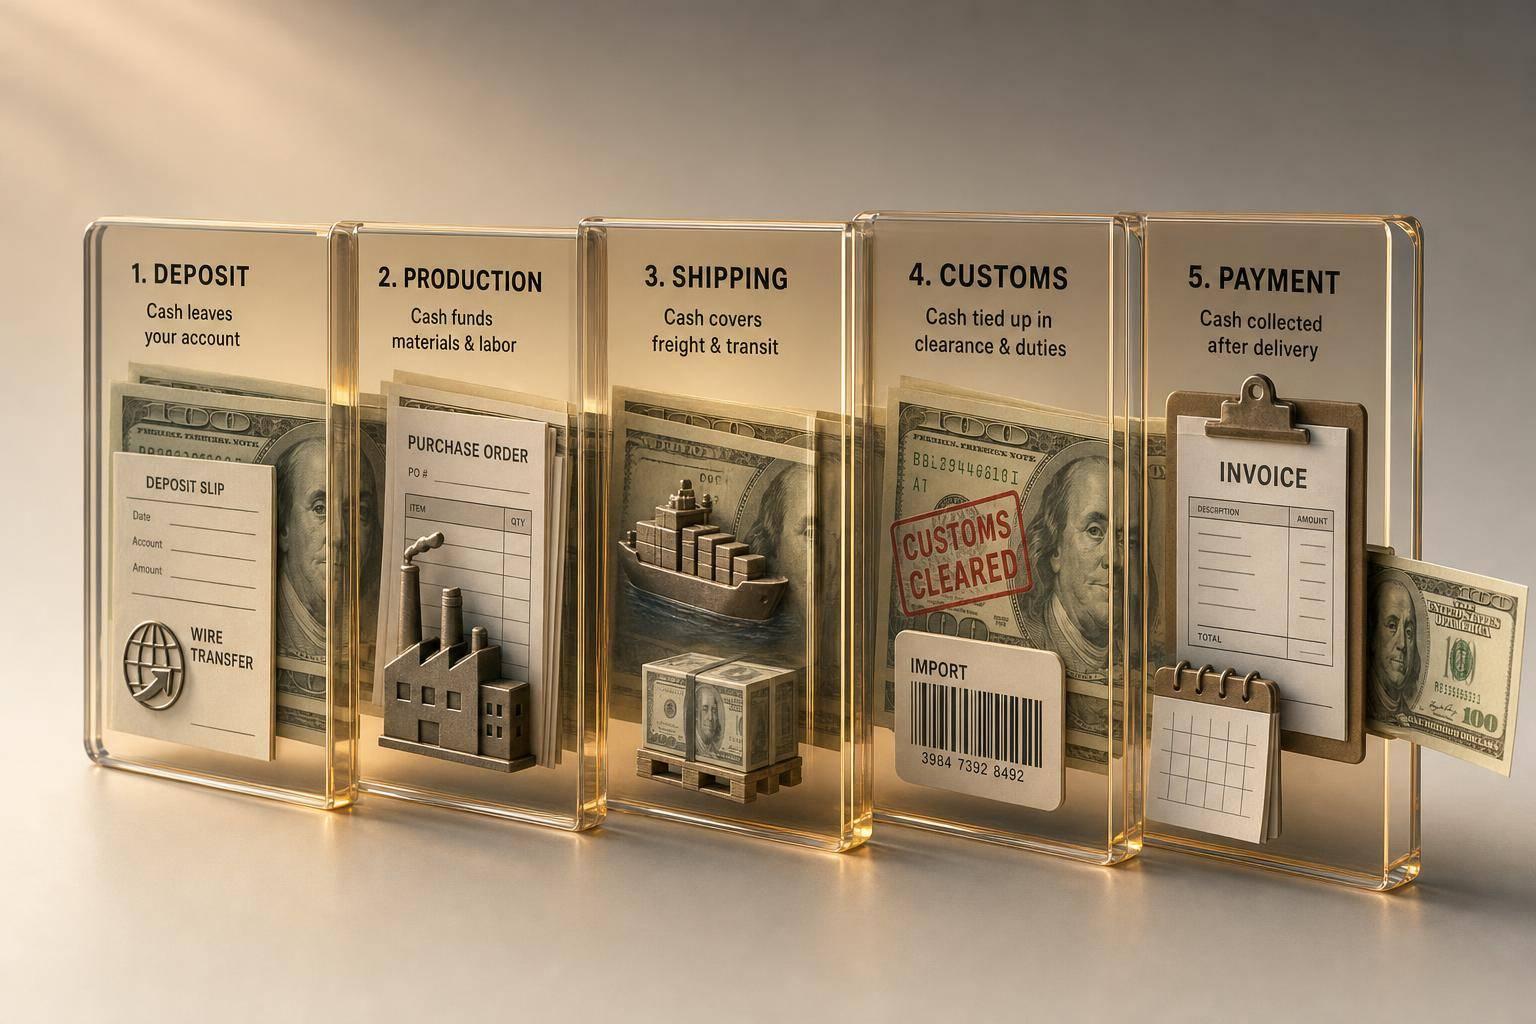
Profitable and Broke: The 90-Day Cash Timeline of a CPG Production Run
A CPG brand can show $52,000 in gross profit and still be short on cash by Day 60. That’s the core issue here: profit sits on the P&L, but cash leaves the bank weeks earlier through deposits, freight, duties, and 3PL costs.
If I boil this down, the article shows one simple thing: timing can crush a healthy product business. In this example, a brand pays $30,000 on Day 0, sends out another $43,000 by about Day 60, and may still be waiting on wholesale cash long after Day 90. So even with decent margins, money gets stuck in inventory and receivables.
Here’s the short version:
- 20,000 units are ordered at $3.00 per unit
- Total production cost is $60,000.00
- Total revenue is $112,000.00
- Gross profit is $52,000.00
- After freight, duties, and brokerage, cash contribution drops to $79,000.00
- Cash paid out by about Day 60 reaches $73,000.00
- DTC cash starts later
- Wholesale cash may not arrive until around Day 115
What I like about this piece is that it keeps the lesson plain: good margins do not mean you have enough cash. The main fix is to track the gap every week with a 13-week cash view, while watching POs, in-transit inventory, on-hand stock, Shopify payouts, wholesale aging, and inbound bills.
| What the article shows | Why it matters |
|---|---|
| Profit and cash are not the same | A brand can look healthy on paper and still run low on cash |
| Cash leaves before sales cash comes in | Deposits, shipping, and import costs hit first |
| Inventory ties up working capital | Money sits in goods instead of the bank |
| Wholesale terms slow collections | Net 30/45/60 can stretch the cash gap past 90 days |
| A shorter cash conversion cycle helps | Less money gets trapped between PO and payment |
Bottom line: if I’m running a CPG brand, I should watch cash timing, not just margin, before placing the next order.
Boost Your Business’s Cash Flow: Working Capital 101 with Finaloop | Webinar

sbb-itb-f0fc809
Case setup: A hypothetical CPG production run with healthy margins
Here’s the same cash gap, this time through a simple production run.
Brightly is a fictional U.S. sparkling water brand that sells through Shopify and wholesale. It works with a contract manufacturer and imports finished goods into the U.S. The brand is small, growing, and short on cash.
Baseline numbers for the production run
Brightly places one production order for 20,000 units. Total production cost is $60,000.00, which works out to $3.00 per unit. On Shopify, DTC packs sell for $7.00 per unit equivalent - for example, a 6-pack sells for $42.00. Wholesale case packs sell for $4.20 per unit. The split is even: 10,000 units DTC and 10,000 units wholesale.
| Metric | DTC | Wholesale |
|---|---|---|
| Units | 10,000 | 10,000 |
| Selling price per unit | $7.00 | $4.20 |
| Factory cost per unit | $3.00 | $3.00 |
| Gross margin | ~57% | ~29% |
| Total channel revenue | $70,000.00 | $42,000.00 |
That puts total run revenue at $112,000.00. Total manufacturing cost is $60,000.00. Gross profit comes to $52,000.00.
But that’s not the full picture. Once freight ($8,000.00), duties ($4,000.00), and brokerage ($1,000.00) are paid, cash contribution drops to $79,000.00.
Payment and inventory assumptions that drive the cash gap
The problem isn’t margin. It’s timing.
Brightly’s supplier asks for a 50% deposit ($30,000.00) at purchase order on Day 0. The other 50% ($30,000.00) is due at shipment around Day 30–35, before the goods leave the factory. So cash goes out long before a single unit can be sold.
Freight is billed at shipment, around Day 35, and payment is due within seven days. Duties and brokerage clear around Day 45–52. By Day 60, after 3PL receiving and put-away, Brightly has paid out $73,000.00 and collected very little cash.
After that, DTC orders start shipping. Even then, Shopify payouts usually take a few business days, so cash doesn’t show up right at checkout. Wholesale moves even slower. Retailers are invoiced around Day 70 on net 45 terms, which pushes cash collection to about Day 115 - well past this 90-day window.
That’s the gap in plain English: inventory sits, wholesale cash comes in late, and the supplier wants money up front. The next timeline shows when each of those costs hits cash.
The 90-day cash timeline: When money goes out before revenue comes in
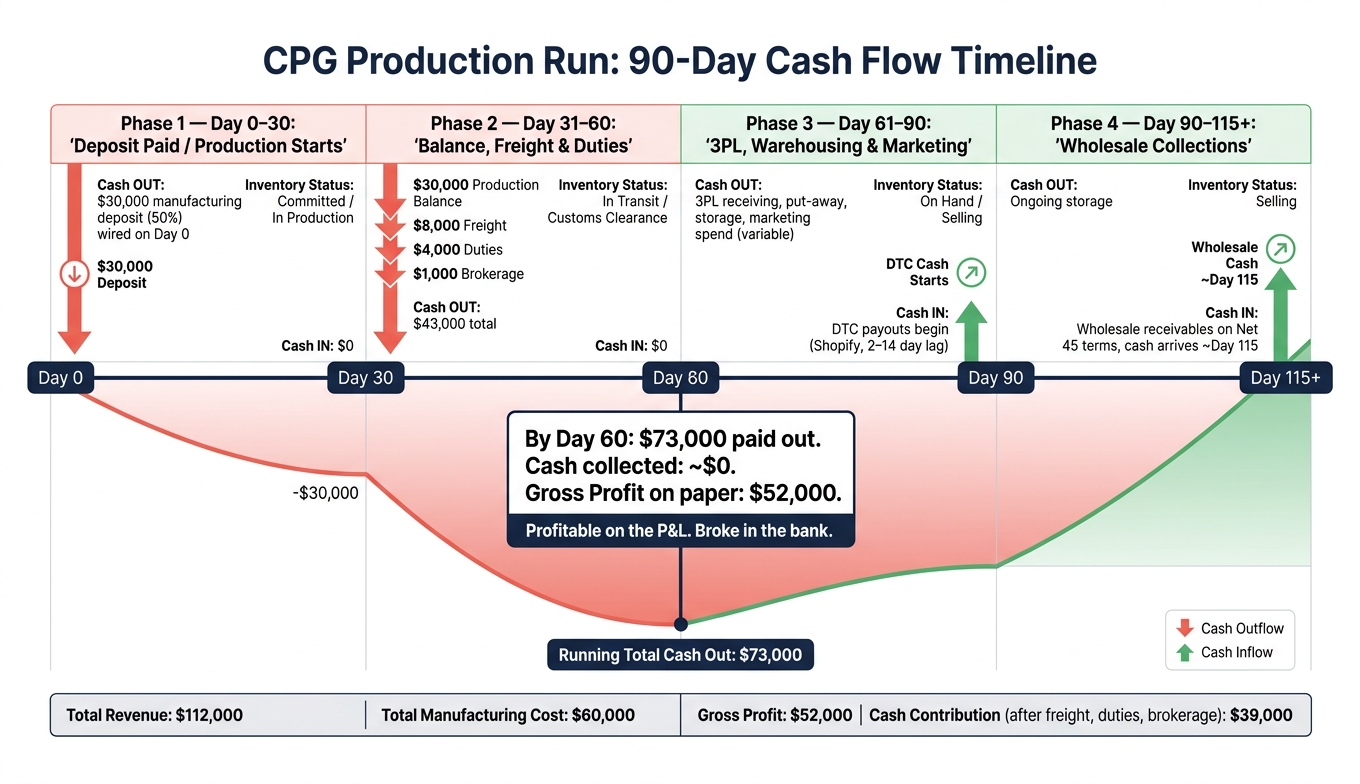
CPG Production Run: 90-Day Cash Flow Timeline
This is the point where the cash gap stops being abstract and starts feeling very real.
Day 0–30: Deposit paid, production starts, cash leaves first
On Day 0, Brightly places the purchase order and wires $30,000.00 for the 50% manufacturing deposit. The cash leaves right away. At that moment, there’s still no product to sell and no revenue coming back in. The inventory is only committed: Brightly has a factory agreement, not finished units.
During this stretch, the factory buys materials, makes the product, and runs quality checks. Brightly now has less cash in the bank, but nothing sellable on hand. That’s the first squeeze point: cash is already tied up, but inventory still can’t do its job.
Day 31–60: Production balance, freight, and duties expand the cash outflow
Once production is done, Brightly pays the remaining $30,000.00, which brings total manufacturing spend to $60,000.00. Then more costs stack on. Freight comes to $8,000.00, duties add $4,000.00, and customs brokerage adds $1,000.00. Cash keeps going out, while revenue is still stuck at zero.
By the end of this period, Brightly has paid $73,000.00 in total. The inventory now exists, but the cash still hasn’t come back. It may appear on the balance sheet as inventory, but that doesn’t mean it’s spendable cash. Inventory value and bank balance are not the same thing.
Day 61–90: 3PL receiving, warehousing, marketing spend, and delayed cash collection
When the container arrives at the 3PL, receiving and put-away fees hit right away. Storage charges start building. Brightly also puts money into launch marketing to generate the first orders. The stock is getting closer to full selling status, but cash still lags behind. DTC payouts usually start in 2–14 days, while wholesale cash often comes in on net 30–90 terms.
The table below shows the timing more clearly.
| Day Range | Cash Outflow | Inventory Status | Cash Inflow |
|---|---|---|---|
| Day 0–30 | $30,000.00 deposit | Committed / In production | $0.00 |
| Day 31–60 | $43,000.00 balance, freight, duties, and brokerage | In transit / Customs clearance | $0.00 |
| Day 61–90 | 3PL receiving, warehousing, and marketing spend | On hand / Selling | DTC payouts start |
| Day 90+ | Storage continues; wholesale collections may begin | Selling | Wholesale collections on net terms |
That’s the gap: the brand can look profitable on paper while still running short on cash.
Where the brand becomes profitable and broke
The lowest cash point before inventory converts to collected revenue
The lowest cash point usually hits between Week 7 and Week 10. By then, the deposit, production balance, freight, duties, and early 3PL costs have already gone out. But the cash coming back in still lags behind.
For Brightly, that means $73,000.00 has already left the bank while DTC payouts are only starting to come in, and wholesale receivables may not clear until well past Day 90. On paper, the P&L can still look healthy. The bank account tells a different story: cash is tight because money is still locked up in inventory that’s either in transit or sitting on hand.
The table below shows what happens when that cycle gets shorter.
Growth can make this even tougher. If a new PO goes in before the first run has paid for itself, the next deposit comes due while cash is still stuck in inventory and receivables.
Comparison table: Long cash cycle vs. improved cash cycle
Shorter inventory days and faster collections reduce the cash hole.
| Metric | Long Cash Cycle | Improved Cash Cycle |
|---|---|---|
| DIO (Days Inventory Outstanding) | 90–120 days | 45–75 days |
| DSO (Days Sales Outstanding) | 50–75 days | 20–40 days |
| DPO (Days Payable Outstanding) | 15–30 days | 30–60 days |
| CCC (Cash Conversion Cycle) | 70–100+ days | 20–50 days |
| Cash tied up in inventory (on a $300,000 run) | $200,000–$260,000 | $100,000–$170,000 |
| Risk of becoming profitable and broke | High - next PO and marketing often require outside funding | Moderate to low - internal cash flow covers most routine cycles |
At the center of this gap are three things: order timing, stock levels, and supplier terms. Smaller, more frequent orders can help. So can tighter safety stock levels and better terms with co-packers, freight providers, and 3PLs. When those pieces improve, the CCC gets shorter and peak cash pressure starts to ease.
Conclusion: How operators can monitor inventory-linked cash before it becomes a crisis
The main problem is timing, not margin. Cash goes out before inventory turns into paid revenue, which means growth can tighten cash even when unit economics look healthy.
The best way to watch this is with a rolling 13-week cash view that you update every week. That makes the pattern easier to see: when cash drops, how far it drops, and which calls are putting pressure on the business.
What to track every week
Use these seven inputs to spot the cash gap before it shows up in the bank account.
| Weekly focus | What to track |
|---|---|
| Open POs and committed cash | Dollar value of approved POs, deposit and balance due dates |
| Inventory in transit | Units and dollar value on the water or in customs, estimated arrival dates |
| Inventory on hand and days on hand | Sellable units per SKU, translated into weeks of coverage based on recent velocity |
| Channel sell-through | Weekly units sold through DTC, Amazon, and wholesale; flag any velocity changes |
| Expected Shopify payouts | Scheduled DTC cash inflows, accounting for the typical 2–3 business day payout lag |
| Wholesale receivables and aging | Open invoices by customer, payment terms (Net 30/45/60), and days outstanding |
| Upcoming freight, duty, and 3PL bills | Known or estimated amounts and due dates for inbound logistics and storage |
Read those inputs together in a 13-week grid, and the timing issue becomes clear before the next order goes out.
Put everything into one weekly view so cash exposure is visible before the next buying call. A tool like Forstock gives teams one place to see weekly cash exposure before they commit to a new order or a bigger marketing push.
The aim is simple: get an early warning. If you can spot cash gaps 8 to 10 weeks ahead, you have time to act before approving a new PO, reorder, or marketing push.
FAQs
Why can a profitable CPG brand still run out of cash?
Profit on a P&L is not the same thing as cash in the bank.
In CPG, cash often leaves the business 30 to 90 days before inventory is sold and becomes revenue. That timing matters more than many founders expect.
Here’s where the money gets stuck: production deposits, freight, duties, warehousing, and unsold inventory. So even if the business looks profitable on paper, a chunk of that money is still tied up in stock.
That creates a liquidity gap. And when cash is locked in inventory, there’s less left for day-to-day expenses, payroll, marketing, or growth.
What is a 13-week cash view?
A 13-week cash flow forecast is a planning tool that shows the cash you expect to bring in and the cash you expect to pay out each week over the next 90 days.
It maps things like purchase orders, storage costs, and projected revenue to give you a clear picture of short-term liquidity. That way, you can spot cash gaps early, see pressure points before placing large orders, and make smarter decisions about reordering and growth.
How can I shorten my cash conversion cycle?
Reduce the time cash sits in inventory. Keep stock lean with just-in-time inventory management, use accurate demand forecasting to set reorder points based on lead times and sales velocity, and avoid overstocking without running into stockouts.
You can also negotiate longer supplier payment terms, ask for smaller, more frequent shipments, and use a 13-week rolling cash-flow forecast to spot liquidity gaps early.
Keep reading
Try Forstock free for 14 days.
AI-powered demand forecasting and reorder automation for Shopify brands. No credit card required.