Ultimate Guide to Reorders with Turnover Data
Use inventory turnover (COGS ÷ average inventory) to set reorder points, calculate EOQ, and adjust for seasonality to reduce stockouts and free cash.

Ultimate Guide to Reorders with Turnover Data
Managing inventory effectively can make or break your business. Stockouts mean lost sales, while overstock ties up cash. The solution? Use inventory turnover data to optimize reorders and improve cash flow.
Here’s the key takeaway:
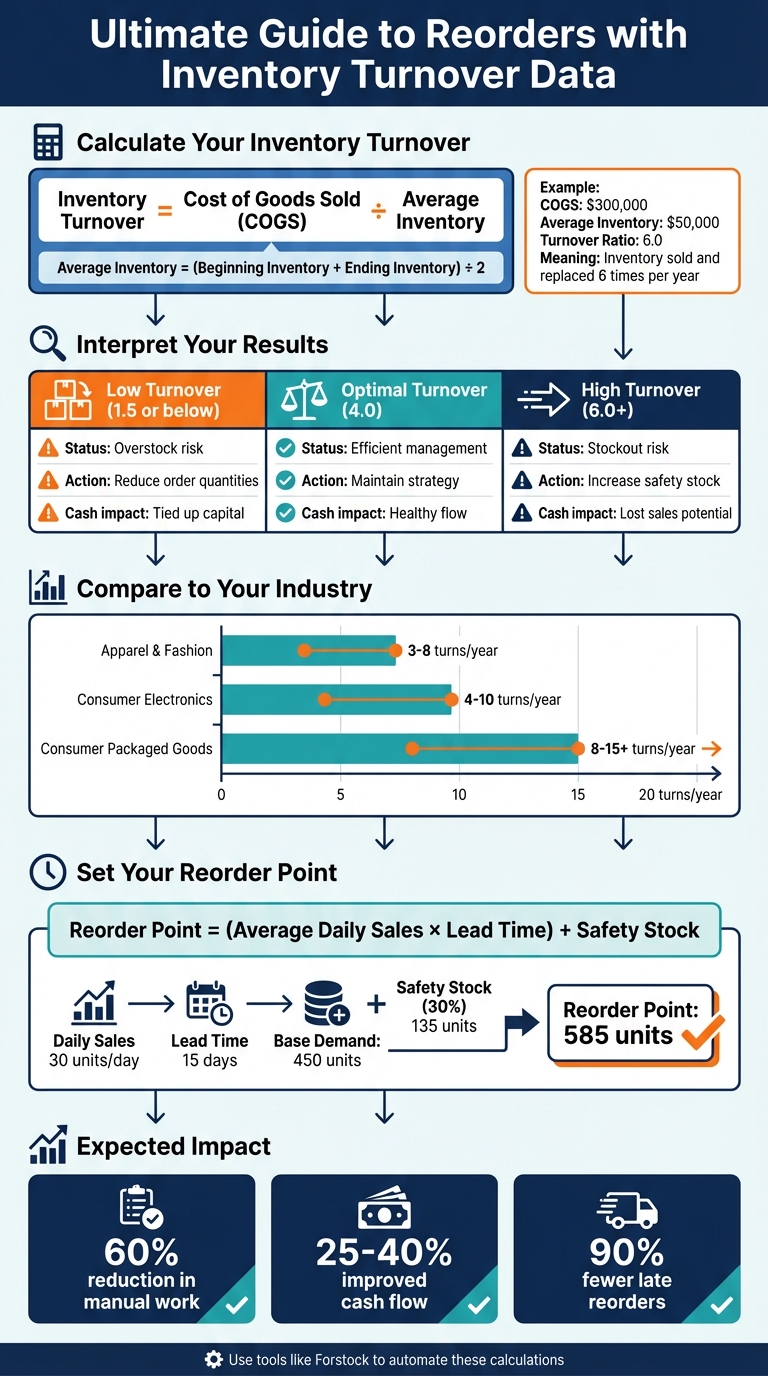
- Inventory Turnover Formula: Cost of Goods Sold (COGS) ÷ Average Inventory.
- Why It Matters: High turnover indicates fast-selling items; low turnover points to overstock or slow-moving products.
- Practical Steps:
- Calculate turnover for each SKU.
- Set reorder points using sales velocity and supplier lead times.
- Use tools like Shopify or Forstock to automate tracking and forecasting.
For example, a turnover ratio of 4 means you sell and replace inventory four times a year. This helps you avoid both stockouts and excess stock, saving money and improving efficiency.
Start by pulling your COGS and inventory data, then compare your turnover to industry benchmarks. Adjust reorders based on seasonal trends, and let tools like Forstock automate repetitive tasks. This approach can reduce manual work by 60% and improve cash flow by 25–40%.
Let’s dive in to learn how to use turnover data to fine-tune your inventory strategy.
How to Calculate and Use Inventory Turnover Ratio for Reordering
What Is Inventory Turnover and Why It Matters
Inventory Turnover Definition
Inventory turnover shows how many times a business sells and replaces its stock within a year. Here's the formula:
Inventory Turnover = Cost of Goods Sold (COGS) ÷ Average Inventory
To find Average Inventory, use this formula:
(Beginning Inventory + Ending Inventory) ÷ 2
For example, if a retailer reports $300,000 in COGS and an average inventory of $50,000, the turnover ratio is 6. This means the retailer sold and restocked its inventory six times over the year.
How Turnover Data Improves Reorder Decisions
Inventory turnover data is a valuable tool for understanding product performance. It highlights which items are selling quickly and which are sitting on the shelves.
- High-turnover products: These require frequent, smaller orders to prevent running out of stock.
- Low-turnover products: These need fewer, smaller orders to avoid tying up cash unnecessarily.
For instance, a turnover ratio of 1.5 suggests slow-moving inventory, while a ratio of 4 or higher indicates efficient stock management. Using this information helps businesses optimize cash flow and reduce storage expenses.
Common Mistakes When Using Turnover Data
One frequent mistake is using revenue instead of COGS in the formula. Since revenue includes markups, it inflates the turnover ratio and gives an inaccurate picture. Always rely on COGS from financial reports for a precise calculation.
Another error is overlooking seasonal trends. Seasonal spikes or dips can skew averages, so it's better to use a 12-month average or break the data into seasonal segments for more accurate insights.
Next, explore how to calculate your inventory turnover ratio in Shopify to make informed decisions.
How to Calculate Inventory Turnover in Shopify

Calculating Your Turnover Ratio
To calculate your inventory turnover ratio for a specific period, you'll need two key figures: your Cost of Goods Sold (COGS) and your inventory values. Start by identifying your beginning inventory value and ending inventory value for that timeframe.
For instance, imagine a Shopify apparel brand analyzing data from January to March. The COGS for the quarter is $90,000, the beginning inventory on January 1 is $40,000, and the ending inventory on March 31 is $50,000. First, calculate the average inventory: ($40,000 + $50,000) ÷ 2 = $45,000. Then, determine the turnover ratio: $90,000 ÷ $45,000 = 2.0. This means the brand sold and replenished its average inventory twice during that three-month period.
If your inventory levels fluctuate significantly - due to large shipments or flash sales - you can get a more accurate result by calculating a daily average inventory. Add up your daily inventory values over the period, then divide by the number of days. This method smooths out any irregularities caused by sudden changes.
Once you've calculated your turnover ratio, you'll need to pull the necessary data from Shopify to ensure accuracy.
Finding COGS and Inventory Data in Shopify
Shopify can track your COGS, but only if you've entered a cost per item for each product variant. To set this up, populate the cost fields for your products. Once in place, Shopify uses these figures to calculate the cost of each sale. You can find this data by navigating to Analytics → Reports and reviewing the Profit margin or Sales by product reports to estimate your COGS.
For inventory values, head to Shopify's Inventory reports. These reports provide details on quantities and dollar values for specific dates. If your store operates across multiple locations, you'll need to pull inventory data for each location, then combine them to get a total value in USD. Export inventory snapshots for the start and end of your chosen period, then calculate Quantity on hand × Cost per item for each SKU. Add these up to determine your total inventory value. To keep your calculations accurate, update product costs quarterly or whenever supplier prices change.
With your turnover ratio in hand, the next step is to see how your store stacks up against industry benchmarks.
Comparing Your Turnover to Industry Standards
Your turnover ratio is a powerful tool for evaluating how well your inventory is performing compared to others in your industry. Once you have your number, compare it to typical ranges for your sector. For example:
- Apparel and fashion brands often see turnover rates of 3–8 times per year. Basics tend to be on the lower end, while fast-fashion items move faster.
- Consumer electronics typically turn 4–10 times annually, with accessories selling faster than higher-priced devices.
- Everyday consumer packaged goods (like groceries) can reach 8–15+ turnovers per year, especially for frequently replenished products.
If your turnover ratio is 2.0 but the industry standard is 5.0, it could indicate overstocking or ineffective merchandising. On the flip side, if your ratio is higher than average but you're constantly running out of stock, it might be time to increase your safety stock or improve your demand forecasting. Tracking your turnover over multiple quarters can reveal trends - if your ratio improves from 3.0 to 4.5 in six months, it shows progress in managing inventory and boosting cash flow.
Using Turnover Data to Improve Reorder Strategies
Setting Reorder Points Based on Turnover
Understanding your turnover ratio can help you determine how long inventory sits before selling and set more effective reorder points. Here's a simple formula to calculate days of inventory:
Days of Inventory = 365 ÷ Turnover Ratio
For instance, if your turnover ratio is 6.0, your inventory stays on hand for about 61 days (365 ÷ 6) before selling out. Now, compare this to your supplier's lead time. If the lead time is 20 days but you only have 30 days of inventory, you're at risk of running out of stock.
To calculate your reorder point, use this formula:
Reorder Point = (Average Daily Sales × Lead Time) + Safety Stock
Take a skincare brand that sells 900 units of serum in 30 days. That’s an average of 30 units per day. With a 15-day lead time, the base demand during that time is 30 × 15 = 450 units. If past data shows frequent mini-stockouts during promotions, adding a 30% buffer (0.3 × 450 = 135 units) brings the reorder point to 585 units. When the total of on-hand and inbound inventory hits 585 units, it’s time to place a new order.
For high-turnover products, like a T-shirt design that turns over 10 times a year, you’ll need tighter reorder points and higher safety stock, potentially 40–50% of lead-time demand. These items may also require daily stock checks to avoid losing sales. On the other hand, slow-moving products (1–2 turns per year) should carry minimal safety stock to free up cash. Some brands even switch these items to make-to-order or limited restocks.
Once you’ve set your reorder points, the next step is to determine the best order size.
Calculating Optimal Order Quantities
After setting reorder points, you can calculate the ideal order size using the Economic Order Quantity (EOQ) formula. This formula balances ordering and holding costs to pinpoint the most cost-effective order size:
EOQ = √((2 × D × S) ÷ H)
Here’s what the variables mean:
- D is annual demand in units.
- S is the cost per purchase order, including admin and freight.
- H is the annual holding cost per unit, covering storage, insurance, and capital costs.
Let’s say a Shopify brand in the U.S. sells 12,000 units per year of a supplement. If each order costs $80 and the holding cost is $1.20 per unit annually, then:
EOQ = √((2 × 12,000 × 80) ÷ 1.2) ≈ 1,265 units
In this case, ordering about 1,265 units at a time balances costs effectively.
Turnover data can refine EOQ calculations by improving demand forecasts and holding cost estimates. High-turnover products may justify larger, less frequent orders since they sell quickly, while slower-moving items might require smaller orders - even less than the EOQ - to avoid overstocking. This is especially important for seasonal or fashion-related items.
Now, let’s look at how to adjust reorder strategies for seasonal demand.
Adjusting Reorders for Seasonal Changes
Annual turnover figures often hide seasonal variations. To stay ahead, calculate turnover for key periods - like November to December for holiday sales or June to August for summer - and compare it to off-season performance. For example, a toy that normally sells 20 units per day (5 turns per year) might surge to 60 units per day during the holiday season (15 turns per year). This kind of spike calls for a major adjustment in reorder strategy.
During peak seasons, use last year’s demand data for that period instead of the annual average in your reorder point calculations. For instance, with a 20-day lead time and 60 units sold daily, adding 50% safety stock increases the reorder point from 1,200 to 1,800 units. Recalculating EOQ with this higher seasonal demand can also help you decide if larger orders are needed. Start increasing orders two to three months before the peak to account for potential delays like port congestion or slower domestic shipping.
In slower seasons, reduce reorder points and order sizes as turnover drops. A swimwear brand that moves inventory 8 times per year in summer might only see 2 turns in winter. To avoid markdowns, lower safety stock to 10–20%, extend the time between orders, and use smaller case packs.
Tools like Forstock can automate these adjustments by tracking real-time turnover trends and seasonal patterns. This eliminates the need for manual spreadsheets and helps you quickly adapt to demand changes without tying up cash in slow-moving inventory. It’s a dynamic way to keep your stock aligned with market trends all year long.
sbb-itb-f0fc809
How to Calculate Inventory Reorder Points and Safety Stock Values
Managing Reorders with Forstock
Keeping your inventory at the right level requires more than just calculations - tools like Forstock take it a step further by automating essential tasks to ensure you’re always stocked appropriately.
Tracking Turnover in Real Time
Forstock’s Inventory Table provides an instant snapshot of each SKU’s turnover, using live data synced directly from Shopify. It calculates key metrics like sales velocity and turnover ratios, with color-coded alerts to flag potential issues. For example, a turnover ratio below 4.0 might mean you’re overstocked, while anything above 6.0 signals a potential stockout.
Let’s break it down: If a SKU has a cost of goods sold (COGS) of $300,000 and an average inventory of $50,000, the turnover ratio would be 6.0. This indicates a fast-moving product that needs attention to avoid running out of stock. On the other hand, a product with $25,000 in COGS and $15,000 in average inventory results in a turnover of 1.67 - a red flag for slow movement. To make things easier, dynamic charts visualize these trends over days and weeks, helping you act quickly to avoid tying up cash in unsold inventory or losing sales due to stockouts.
The best part? This live data feeds directly into Forstock’s automated purchasing tools.
Automated Purchase Orders and Demand Forecasting
Using precise turnover metrics, Forstock’s AI takes the guesswork out of purchasing decisions. Its Alfred AI analyzes historical turnover data, sales patterns, lead times, and seasonal trends to create accurate 12-month demand forecasts. For instance, if your turnover jumps from 2.3 to 4.0, Alfred AI recalculates reorder points and adjusts order quantities in real time.
Forstock simplifies this further with one-click purchase orders based on these forecasts. If your days of supply drop below 14, it auto-generates a purchase order. For example, it might recommend ordering $125,000 worth of inventory to support an expected $500,000 COGS at a 4x turnover. Users have seen impressive results, cutting manual inventory tasks by at least 60% and improving cash flow by 25–40% by avoiding overstock situations and last-minute reorders.
Coordinating with Suppliers Using Forstock
Forstock streamlines supplier communication through a centralized dashboard, eliminating the chaos of endless email threads and missed updates. Suppliers gain access to real-time turnover insights, so they’re always in the loop. For instance, if a SKU with a turnover ratio of 2.3 needs 150 units urgently, the system notifies the supplier directly. Suppliers can also confirm lead times within Forstock, which automatically syncs with Shopify to keep forecasts accurate and delays at bay.
The platform also tracks average lead times from past orders and uses this data to fine-tune reorder triggers. Let’s say your supplier typically needs 14 days, and your turnover ratio hovers around 4.0. Forstock will alert you when inventory levels fall below the lead time threshold, ensuring you have enough buffer to place orders proactively. Shopify brands using Forstock have reported reducing late reorders by 90% and cutting supplier coordination time by 70%, all while keeping inventory flowing without constant manual intervention.
Conclusion
Inventory turnover data takes the guesswork out of reordering, turning it into a precise, data-driven strategy. By using the formula COGS ÷ average inventory for each SKU, Shopify brands can quickly identify potential issues, such as overstock (low turnover ratios under 2–4) or stockout risks (high turnover above 6). Armed with these insights, businesses can set reorder points and order quantities that align with actual demand. The result? Freed-up cash from slow-moving stock, fewer emergency shipments or clearance sales, and consistently stocked bestsellers - all of which help improve profit margins and keep customers happy.
But don’t stop at just calculating turnover ratios - make it a regular part of your workflow. Start by pulling COGS and inventory data for your top 10–20 SKUs from Shopify. Categorize them as fast, medium, or slow movers, and adjust reorder triggers based on their performance. Factor in seasonality by increasing reorder points before peak sales periods and scaling back during slower months. Revisit these metrics quarterly to ensure your strategy stays on track.
For businesses managing larger catalogs, tools like Forstock simplify the process. From real-time turnover calculations to automatically generating purchase orders, Forstock reduces manual work by over 60%, helping improve cash flow by aligning inventory orders with actual demand.
"Since switching, I haven't had a single stockout, and I don't overorder anymore. The AI forecast actually makes sense for my business." – Sophie, E-commerce Manager
FAQs
How do I use inventory turnover data to set accurate reorder points?
To determine accurate reorder points using inventory turnover data, start by examining two key factors: your sales velocity (how fast products are selling) and your lead times (how long it takes to receive new inventory). The goal is to ensure you have enough stock to meet demand during the lead time without piling up unnecessary inventory.
Inventory turnover rates play a critical role in maintaining the right balance. Leveraging tools like real-time inventory analytics can make this process much easier. These tools calculate reorder points by analyzing sales patterns, turnover rates, and lead times, helping you sidestep issues like running out of stock or holding too much inventory.
What mistakes should I avoid when calculating inventory turnover?
When working out inventory turnover, there are a few missteps you’ll want to steer clear of to ensure you get accurate results. First, always match the time frames for your sales and inventory data. If these don’t align, your calculations could end up misleading.
Another factor to keep in mind is lead times and seasonality. Ignoring these can throw off your turnover rates, especially during peak or slow periods.
Also, don’t rely too heavily on average turnover rates without considering stockouts or excess inventory. Both can skew your numbers and give a false sense of how well your inventory is moving. Lastly, make it a point to update your turnover calculations regularly so they reflect the latest sales trends and stay useful for decision-making.
How does Forstock simplify inventory management and help boost cash flow?
Forstock takes the hassle out of inventory management by using AI-driven demand forecasting combined with real-time sales data to create purchase orders automatically. This minimizes manual work and helps keep your stock levels perfectly aligned with customer demand.
With smarter reorder strategies, Forstock helps you steer clear of overstocking and running out of stock, unlocking funds that would otherwise be tied up in excess inventory. This approach not only improves cash flow but also lets you concentrate on scaling your business with ease.
Keep reading
Try Forstock free for 14 days.
AI-powered demand forecasting and reorder automation for Shopify brands. No credit card required.