Inventory Turnover Ratio: Formula + Calculator Guide
Calculate inventory turnover using COGS and average inventory, convert to Days Inventory Outstanding (DIO), and use calculators and automation to optimize stock.
Inventory Turnover Ratio: Formula + Calculator Guide
Your inventory turnover ratio tells you how efficiently you're selling and replenishing stock. A higher ratio means faster sales, while a lower one may indicate overstocking or slow-moving goods. This guide covers:
- Formula: Inventory Turnover = COGS ÷ Average Inventory.
- Key Data: Use Cost of Goods Sold (COGS) and average inventory values (beginning + ending inventory ÷ 2).
- Timeframe: Match your COGS and inventory periods (e.g., annual, monthly).
- Industry Benchmarks: Retail averages 10.86 turnovers/year, while ecommerce often ranges from 2 to 4.
For example, if your COGS is $490,000 and your average inventory is $55,750, your ratio is 8.8. This means you turn over inventory about every 41 days (365 ÷ 8.8).
Efficient inventory management balances high turnover (to avoid stockouts) and low turnover (to reduce excess stock). Use tools like Forstock to automate tracking, optimize reorder points, and improve cash flow.
The Inventory Turnover Formula: Components Breakdown
The Standard Formula
The inventory turnover formula is straightforward: Inventory Turnover = COGS ÷ Average Inventory. It measures how frequently inventory is replenished over a specific period.
- COGS (Cost of Goods Sold) includes the direct costs of producing or purchasing the items you sell. For Shopify retailers, this typically covers the wholesale price of goods plus shipping costs from suppliers to your warehouse. You can find this figure in the "Finances summary" report within Shopify's admin panel.
-
Average Inventory smooths out stock fluctuations over time. It’s calculated as:
(Beginning Inventory + Ending Inventory) ÷ 2.
Both beginning and ending inventory values can be found on your balance sheet or Shopify inventory reports.
Why use COGS instead of sales revenue? Inventory on your balance sheet is recorded at cost, not retail price. As Investopedia explains:
"Analysts use COGS instead of sales in the formula for inventory turnover because inventory is typically valued at cost, whereas the sales figure includes the company's markup".
This ensures you're comparing costs consistently, without mixing wholesale costs with retail pricing.
For example, Walmart reported a COGS of $490 billion, with a beginning inventory of $56.6 billion and an ending inventory of $54.9 billion. Their average inventory was $55.75 billion. Dividing $490 billion by $55.75 billion gives a turnover ratio of approximately 8.8, meaning Walmart replenished its entire inventory roughly every 41 days.
Next, let’s dive into why selecting the right timeframe matters for accurate calculations.
Selecting the Right Timeframe
To get reliable results, make sure the periods for COGS and Average Inventory match.
Most retailers calculate inventory turnover annually to account for seasonal trends. Events like holiday shopping, back-to-school sales, or summer lulls can cause inventory levels to fluctuate significantly. An annual calculation captures these variations, giving you a complete picture of your business cycle.
For seasonal businesses, using monthly inventory data and averaging it over 12 months can provide a steadier figure.
If your business deals with perishable goods - like groceries or flowers - calculating turnover more frequently (monthly or even weekly) can help you catch potential issues before products spoil or become unsellable. Meanwhile, businesses with longer sales cycles, such as furniture or luxury items, may benefit from quarterly or annual tracking instead.
Alternative Formula: Sales-Based Turnover
Another way to calculate turnover is by dividing Sales by Average Inventory. While this method is simpler, it’s less accurate for financial planning.
Sales figures include profit margins, which can distort the calculation. The COGS-based formula remains the standard because it matches cost with cost, offering a clearer picture of inventory efficiency. Use the sales-based formula only for quick, informal estimates when COGS data isn’t readily available.
Inventory Turnover Ratio Calculation In Excel | Step-by-Step Excel Tutorial | Inventory Turn Formula
How to Calculate Your Inventory Turnover Ratio
How to Calculate Inventory Turnover Ratio in 3 Steps
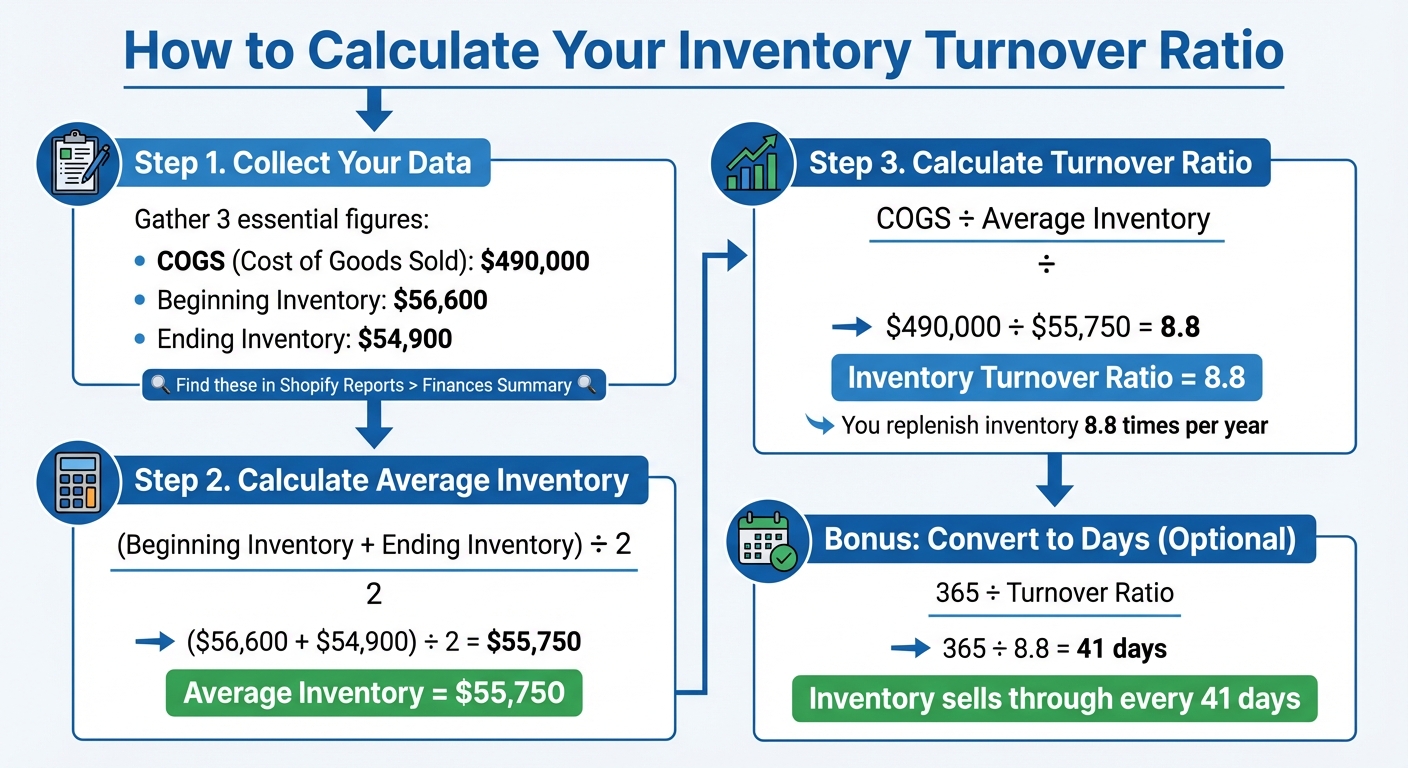
Let’s break down how to calculate your inventory turnover ratio step by step, using the components we previously discussed.
Collecting Your Data
Start by gathering three essential figures: COGS (Cost of Goods Sold), Beginning Inventory, and Ending Inventory. You can find these numbers in your Shopify admin:
- COGS: Check the "Finances summary report" under Reports > Finance > Income Statement.
- Inventory values: Look in the "Percent of inventory sold report" or the "Inventory value" report.
Make sure the timeframes for your COGS and inventory values match. For example, if you’re calculating turnover for the entire year of 2025, use COGS from January 1 to December 31, 2025, and pull inventory values from the same dates. Using mismatched periods will lead to inaccurate results.
Running the Calculation
First, calculate your Average Inventory. If your Beginning Inventory was $56,600 and your Ending Inventory was $54,900, the average would be:
($56,600 + $54,900) ÷ 2 = $55,750.
Next, divide your COGS by your Average Inventory. For instance, if your COGS for the year was $490,000, the calculation would look like this:
$490,000 ÷ $55,750 = 8.8
This result means you turned over your entire inventory about 8.8 times during the year.
To take this one step further, you can convert this ratio into Days Inventory Outstanding (DIO) for a more practical perspective.
Optional: Converting to Days Inventory Outstanding (DIO)
DIO helps you understand how long your inventory stays on hand before being sold. To calculate it, divide 365 by your turnover ratio. Using the example above:
365 ÷ 8.8 = approximately 41 days.
This figure indicates that, on average, it takes 41 days to sell through your inventory. DIO is especially helpful for setting reorder points and comparing your business to industry standards. For example, in 2023, U.S. auto dealers averaged 58 days, while food store chains averaged just 33 days.
A lower DIO suggests your inventory moves quickly, which means less capital tied up in stock. However, it’s essential to balance efficiency with maintaining adequate inventory levels to avoid stockouts.
sbb-itb-f0fc809
Using an Online Inventory Turnover Calculator
Online calculators take the hassle out of manual calculations and help reduce errors when determining your inventory turnover ratio. Instead of crunching numbers yourself, you just input your data, and the tool instantly provides results - including both your turnover ratio and Days Inventory Outstanding (DIO) metrics [20, 21]. Below, we’ll walk through how to prepare your data, interpret the results, and use Forstock for ongoing inventory tracking.
Preparing Your Data Inputs
To get started, gather four key pieces of data: Cost of Goods Sold (COGS), Beginning Inventory, Ending Inventory, and the time period you want to analyze [9, 16, 17]. You can find COGS on your income statement, while beginning and ending inventory figures should come from your balance sheet. It’s important to use COGS rather than total sales revenue to avoid artificially inflating your turnover ratio [3, 22].
Reading Calculator Results
After entering your data, the calculator will display two essential metrics: the inventory turnover ratio and Days Inventory Outstanding (DIO). A higher turnover ratio often reflects strong sales and efficient inventory management, meaning your products are selling quickly without tying up too much cash [2, 18]. For retail businesses, benchmarks typically fall between 7 and 10.86 turnovers per year [9, 19].
However, an exceptionally high turnover ratio can signal trouble. It might mean you’re understocked, leading to stockouts and missed sales opportunities [9, 18]. On the flip side, a low ratio - especially one under 1 - can indicate weak sales, overstocking, or unsold inventory that’s draining your cash flow. For most retailers, a ratio between 2 and 4 strikes a good balance, aligning with typical restocking cycles.
Automated Turnover Monitoring with Forstock

While calculators provide a one-time snapshot, Forstock takes it a step further by continuously monitoring your inventory turnover in real time for all your Shopify products. It calculates turnover ratios at the SKU level, giving you a clear view of which products are selling well and which are tying up your capital.
Using AI-driven forecasting, Forstock adapts to your specific trends and seasonal patterns to recommend reorder points and purchase quantities. It also sends alerts when stock levels approach critical thresholds, helping you avoid stockouts empowering you to make smarter, data-backed purchasing decisions. With Forstock, you can stay ahead of inventory challenges and keep your operations running smoothly.
How to Improve Inventory Turnover for Shopify Stores

Managing your inventory turnover effectively is key to keeping cash flow steady, cutting storage costs, and ensuring you never miss a sale.
Adjusting Reorder Points and Quantities
The reorder point (ROP) is the inventory level that signals it’s time to restock. You can calculate it with this formula:
(Daily Sales Velocity × Lead Time) + Safety Stock.
For example, if you sell 10 units daily, have a 14-day lead time, and maintain a safety stock of 20 units, your ROP would be:
(10 × 14) + 20 = 160 units.
"Inventory turns improve when you buy less product more often."
- Michael Keenan, Shopify
Instead of placing large, infrequent orders, consider a Just-In-Time (JIT) approach. Smaller, more frequent orders can lower your average inventory levels. However, this strategy works best when you have dependable suppliers and accurate demand data.
Keep in mind that your ROP isn’t static. Adjust it regularly to reflect changes like seasonal trends, marketing campaigns, or supply chain delays. Pair this with forecasting tools to fine-tune your inventory planning.
Using Demand Forecasting and Automation
Once your reorder points are in check, take your inventory management to the next level with demand forecasting. Ditch spreadsheets in favor of AI-driven tools that analyze historical sales patterns and predict seasonal demand.
For instance, Forstock offers SKU-level forecasting tailored to your specific trends, lead times, and seasonality. It automatically calculates optimal reorder points and even generates purchase orders when stock reaches critical levels. This ensures you always restock the right amount at the right time.
The results speak for themselves. One Shopify brand reduced stockouts by 60% using AI-driven forecasting. Another saw a 40% boost in operational efficiency after moving away from spreadsheets. A third merchant reported a 75× ROI by optimizing stock levels and cutting carrying costs.
High vs. Low Turnover: Finding the Right Balance
Striking the right balance with your inventory turnover is crucial. A turnover that’s too high can lead to stockouts, while a low turnover ties up your cash in excess inventory. For most retailers, a turnover ratio between 5 and 10 is ideal, which typically translates to restocking every one to two months.
| Scenario | Advantages | Disadvantages | Recommended Approach |
|---|---|---|---|
| High Turnover | Better cash flow, lower holding costs, and reduced risk of obsolete stock | Higher risk of stockouts and lost sales | Use automated reorder points and maintain safety stock buffers to avoid disruptions |
| Low Turnover | Ensures product availability consistently | Ties up capital and increases storage costs | Run promotions, bundle slow-moving products, and improve demand forecasting |
Conclusion
The inventory turnover ratio is a key indicator of your business's cash flow, operational efficiency, and overall profitability. By mastering its formula, using calculators, and analyzing turnover at the SKU level, you can identify which products drive revenue and which ones are tying up valuable capital.
Once you’ve calculated your turnover, the challenge is finding the right balance. An ideal ratio ensures steady cash flow while maintaining sufficient stock levels. Whether you're restocking every 41 days like Walmart or managing a slower-moving inventory, the goal is the same: keep stock moving efficiently to boost profits.
Manual calculations can give you a quick snapshot, but they have their limits. Tools like Forstock simplify the process by automating real-time turnover tracking, providing AI-driven forecasts, and streamlining purchase order creation. This can save up to 20 hours a week, freeing you to focus on scaling your business.
Start by calculating your current turnover ratio, identifying slow-moving items and top sellers, and adjusting reorder points as needed. Then, embrace automation to maintain and improve efficiency. Brands that report 60% fewer stockouts and a 40% increase in operational efficiency aren’t just working harder - they’re working smarter by leveraging the right tools.
Your inventory is one of your greatest assets - make sure it’s working just as hard as you are.
FAQs
What is the impact of the inventory turnover ratio on cash flow?
The inventory turnover ratio plays a key role in cash flow management by indicating how quickly products are sold and replenished. A higher turnover ratio suggests that inventory is moving swiftly, which means less cash is tied up in unsold goods. This creates an opportunity to free up funds for other business priorities, ultimately helping to improve cash flow.
Focusing on optimizing your inventory turnover can help prevent overstocking, cut down on storage expenses, and ensure your cash is being used effectively to drive business growth.
Why does the inventory turnover formula use COGS instead of sales revenue?
The inventory turnover formula relies on Cost of Goods Sold (COGS) because it accurately represents the expense of producing or purchasing the inventory that’s sold. This ensures the calculation matches the inventory's cost as recorded on the balance sheet. If sales revenue - which includes markup - were used instead, the ratio would be skewed, making it less effective at showing how efficiently inventory is being managed.
How can AI-powered tools improve inventory management for Shopify stores?
AI-powered inventory tools are transforming how Shopify merchants manage their operations, making sense of complex data and turning it into actionable insights. These tools dive into sales trends, seasonality, lead times, and even external factors like promotions or weather. The result? Highly accurate demand forecasts that help merchants avoid overstock, prevent costly stockouts, and boost profitability.
Take platforms like Forstock, for example. They seamlessly integrate advanced features into Shopify workflows, offering real-time demand forecasting, automated purchase orders, and 12-month demand planning. These capabilities allow merchants to fine-tune inventory levels, improve cash flow, and save valuable time. By automating routine tasks and giving merchants a clear view of their inventory's health, AI tools make it easier to focus on growing the business with confidence.
Keep reading
Try Forstock free for 14 days.
AI-powered demand forecasting and reorder automation for Shopify brands. No credit card required.