
How Much Does It Cost to Hold Inventory? Carrying Cost Formula and Benchmarks
Holding stock often costs 20-30% of its value yearly — learn the carrying-cost formula, main cost buckets, benchmarks, and ways to cut it.
How Much Does It Cost to Hold Inventory? Carrying Cost Formula and Benchmarks
Holding inventory often costs 20% to 30% of its average value per year. So if you carry $500,000 in stock, you may be spending $100,000 to $150,000 a year just to keep it on hand.
If I had to boil this article down to a few points, it would be this:
- Inventory carrying cost is the yearly cost of owning unsold stock.
- The main formula is (total annual carrying costs ÷ average inventory value) × 100.
- The biggest cost buckets are capital, storage, service, risk, and handling.
- A common planning estimate is 25%, but many DTC and seasonal brands land between 22% and 35%.
- If your rate gets above 35%, I’d check slow-moving SKUs, aging stock, overstock vs. stockout risks, and storage spend first.
In plain English: if products sit too long, they eat margin, tie up cash, and make it harder for you to spend on things like ads, payroll, or new product launches.
A simple example makes the point fast. If average inventory is $200,000 and annual holding costs are $50,000, your carrying cost is 25%. That means every $1.00 in inventory costs $0.25 per year to hold.
Here’s the short list of what the article covers:
- what carrying cost is
- what to leave out of the math
- the formula for percentage and dollar cost
- common benchmark ranges by business type
- a worked example
- ways to cut holding cost without causing stockouts
Bottom line: if you know your carrying cost in both percent and dollars, you can make better buying and replenishment calls instead of letting excess stock drain cash in the background.
Calculate Warehouse Inventory Carrying Costs Per Square Foot
sbb-itb-f0fc809
The Carrying Cost Formula and the Inputs You Need
You only need two formulas to handle most carrying cost math. Put them in a spreadsheet, and you can work out both your rate and the dollar amount.
Carrying cost percentage formula
The standard formula is:
Carrying Cost % = (Total Annual Carrying Costs ÷ Average Inventory Value) × 100
Use full-year totals. If all you have is opening and closing inventory, calculate average inventory like this:
(Beginning Inventory + Ending Inventory) ÷ 2
Dollar-value formula for annual holding cost
Once you know your carrying cost percentage, turn it into a dollar figure with this formula:
Annual Carrying Cost ($) = Average Inventory Value × Carrying Cost %
Here’s a simple example. At a 24% carrying cost rate, $500,000 in average inventory costs $120,000 per year to hold.
That figure shows how much cash your inventory is tying up instead of letting you use it somewhere else.
Once you know the total rate, the next move is to see which costs are driving it higher.
The five cost buckets to include
Split carrying cost into these five buckets so you can see what’s under your control.
| Cost Bucket | What to Include |
|---|---|
| Capital tied up | Opportunity cost of cash locked in inventory; apply your cost of capital to average inventory value |
| Warehousing and storage | Portion of rent, utilities, racking, software, and warehouse overhead attributable to the space your inventory occupies |
| Insurance and admin costs | Insurance premiums, taxes or fees tied to holding stock, and admin costs needed to keep inventory available |
| Shrinkage and obsolescence | Expected losses from theft, miscounts, spoilage, markdowns, or write-offs; use historical loss rates as your estimate |
| Handling labor and equipment | Labor and equipment costs for receiving, moving, counting, storing, protecting, and monitoring inventory |
These buckets are what drive your carrying cost rate. Add the percentage from each one, and you’ll get your annual carrying cost rate.
Next, break that total rate into the cost drivers behind it.
The Main Drivers of Inventory Holding Cost
To understand carrying cost, split it into parts. That makes it much easier to spot which cost bucket is pushing your rate up.
Storage, capital, and service costs
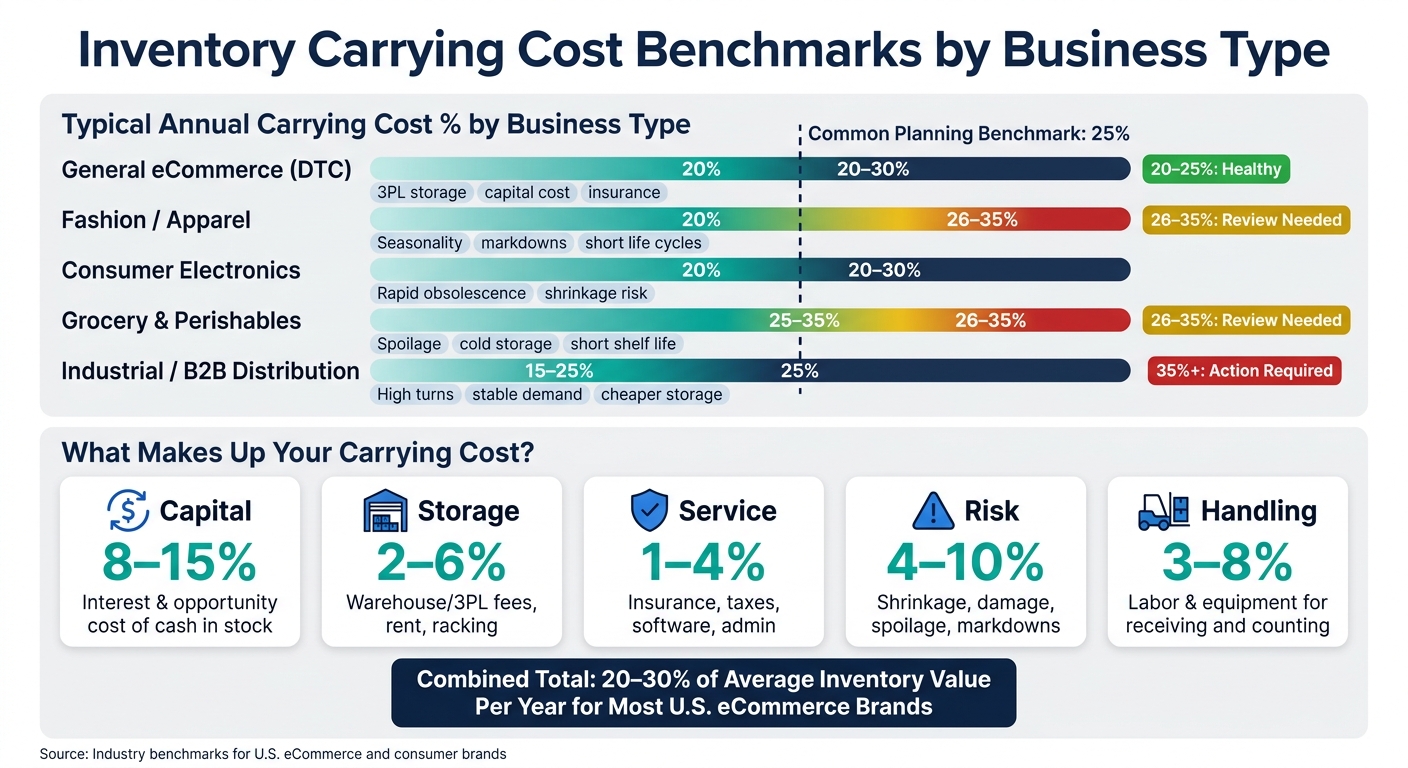
For many U.S. brands, capital cost is the biggest driver. This is the interest paid on inventory financing, or the cost of having cash tied up in stock instead of using it elsewhere. For most U.S. brands, this usually falls between 8–15% of average inventory value per year. So if a brand holds $500,000 in average inventory and uses a 12% capital rate, that works out to $60,000 per year in capital cost alone.
Storage costs cover warehouse rent or 3PL fees, utilities, racking, and facility upkeep. For eCommerce brands, these usually land around 2–6% of average inventory value each year.
Service costs include inventory insurance, inventory taxes like personal property tax in some states, software subscriptions, and admin overhead. That usually adds another 1–4% per year.
Shrinkage, damage, obsolescence, and handling
These costs are often less obvious on a P&L, but they can be some of the easiest to improve.
Shrinkage includes theft, mis-picks, and count errors. Damage covers units broken while in storage or returned in unsellable shape. Obsolescence is a big issue for brands with seasonal products, expiration dates, or fast-changing product lines. Think apparel, supplements, or consumer electronics accessories that go out of date before they sell.
These costs tend to climb when brands carry broad assortments, place oversized reorders, or sit on slow-moving stock. When inventory turnover slows down, damage, obsolescence, and markdown risk usually go up with them. That puts the spotlight on SKU discipline, reorder size, and inventory age.
The National Retail Security Survey 2023 found an average shrink rate of 1.6% of sales in FY 2022, up from 1.4% the year before, equal to $112.1 billion in losses across U.S. retail. For eCommerce brands, combined risk costs usually fall between 4–10% of average inventory value per year, though they can run much higher in fashion or seasonal categories.
Handling costs include labor and equipment for receiving, putaway, internal transfers, and cycle counts. They tend to creep up as SKU counts and inventory levels grow. For U.S. brands, these usually add 3–8% per year.
Carrying cost components and typical annual ranges
Use this table to line up your own cost buckets against common benchmark ranges. If one part is running well above the top end, that’s usually the first place to look.
| Component | What It Covers | Typical Annual % of Average Inventory Value |
|---|---|---|
| Capital | Interest on credit lines; opportunity cost of cash tied up in inventory | 8–15% |
| Storage | Warehouse/3PL storage fees, rent, utilities, racking, facility maintenance | 2–6% |
| Service | Inventory insurance, inventory-related taxes, software, admin overhead | 1–4% |
| Risk | Shrinkage (theft, miscounts), damage, spoilage, expiration, markdowns | 4–10% |
| Handling | Labor and equipment to receive, put away, move, and count stock | 3–8% |
Add those pieces together, and carrying cost will often land between 20–30% of average inventory value per year for U.S. eCommerce and consumer brands. These ranges help you spot the outlier before you work out your own total. Once you know which bucket is driving the number, you can move on to calculating your carrying cost.
Benchmarks and a Simple Example to Calculate Your Own Carrying Cost
Inventory Carrying Cost by Business Type: Benchmarks & Cost Drivers
Worked example: from raw costs to carrying cost percentage
This is what the math looks like in practice.
Say a Shopify apparel brand has an average inventory value of $200,000 for the year, based on monthly average inventory values. Its annual holding costs might look like this:
| Cost Component | Rate Applied | Annual Cost |
|---|---|---|
| Capital (cost of capital) | 10% | $20,000 |
| Storage (3PL storage, warehouse rent) | 5% | $10,000 |
| Service costs (insurance, taxes, software, admin) | 2% | $4,000 |
| Risk (shrinkage, damage, obsolescence) | 5% | $10,000 |
| Handling (warehouse labor, equipment) | 3% | $6,000 |
| Total annual holding cost | $50,000 |
The carrying cost percentage is:
$50,000 ÷ $200,000 × 100 = 25%.
Put simply, every $1 of inventory costs $0.25 per year to hold.
And here's the part that sneaks up on a lot of brands: if average inventory climbs to $300,000 and nothing else changes, annual holding cost rises to $75,000. Same rate. Much bigger dollar hit.
Typical carrying cost benchmarks by business type
After you have your rate, the next step is simple: compare it against normal ranges for your kind of business.
A common planning assumption is 25%. But that number isn't fixed in stone. Product mix, warehouse setup, and demand swings can push carrying cost well above or below that mark.
For many eCommerce and seasonal retail brands, carrying cost often falls between 22–35%. Some analyses put the high end at 40% when stock gets old fast or items move slowly.
Industrial and B2B distributors usually land closer to 15–25%. The main reason is simpler demand patterns and faster inventory turns.
How to tell if your carrying cost is healthy or high
The table below gives you a quick gut check. If your rate is above the top end for your category, that's often the first sign to dig into aging stock, safety stock levels, or storage spend.
| Business Type | Typical Carrying Cost % | What Usually Drives It |
|---|---|---|
| General eCommerce (DTC) | 20–30% | 3PL storage, capital cost, insurance, moderate obsolescence |
| Fashion / Apparel | 20–35% | Seasonality, short life cycles, markdowns, high returns |
| Consumer Electronics | 20–30% | Rapid obsolescence, shrinkage risk, mid-to-high capital cost |
| Grocery & Perishables | 25–35% | Spoilage risk, cold storage costs, short shelf life |
| Industrial / B2B Distribution | 15–25% | High inventory turns, stable demand, often cheaper storage |
A carrying cost in the 26–35% range deserves a closer look at slow-moving SKUs, safety stock rules for Shopify, and storage setup. Once you're above 35%, it's often a sign of deeper problems, like chronic overstock, aging inventory, or warehouse costs that no longer make sense.
How to Reduce Carrying Cost Without Creating Stockouts
Use carrying cost to adjust replenishment and safety stock
Use carrying cost to trim excess inventory without pushing yourself into stockouts.
If carrying cost is high, start with your safety stock assumptions. A lot of brands stretch lead times out of habit. That extra cushion can quietly push up safety stock across every SKU. A better move is to update lead times based on current supplier performance and recalculate safety stock using recent demand variability, not promo-driven spikes.
Once those inputs are current, adjust order frequency only when supplier reliability backs it up. For example, moving from monthly to biweekly orders can reduce average on-hand inventory. Smaller, more frequent orders bring down average inventory value, which lowers the dollar cost of holding that stock.
Find the biggest cost drivers by SKU, category, and warehouse
After replenishment rules are tighter, the next step is to see where carrying cost is piling up.
The most useful view breaks inventory into months on hand, sell-through rate, and storage location. SKUs with high months on hand and falling velocity are usually the first ones worth checking. At the category level, compare carrying cost percentage with gross margin. If holding cost is taking too much of the margin in a slow category, that’s a clear sign to tighten buying rules. At the warehouse level, compare storage fees, labor intensity, and transfer frequency to spot whether one node is holding inventory that costs more than it should.
Bring together sales, inventory, supplier, and warehouse data so slow movers, obsolete stock, and high-cost locations show up faster.
For aging stock that can still sell, use markdowns, bundles, or channel shifts to turn inventory into cash without changing replenishment for healthy SKUs. If items are plainly obsolete, stop reordering them, liquidate the units left, and remove them from forecast inputs so they no longer push safety stock higher than needed.
Conclusion: the numbers to track and the decisions they should change
Once you know the main cost drivers, turn that insight into weekly, monthly, and quarterly controls.
The formula is straightforward: total annual carrying costs ÷ average inventory value × 100. The point isn’t just to calculate the number. The point is to let it change decisions. When you track carrying cost in both percentage and dollar terms, you can spot when inventory is creeping up, when a category is getting too expensive to stock at current depth, or when a warehouse choice is adding cost without adding service. That’s when the math should shape an action: change a purchase quantity, reset reorder points to reduce stockouts, or rethink a storage setup, instead of just sitting in a report.
A simple review rhythm helps:
- Review stock health weekly.
- Review category and warehouse carrying cost monthly.
- Review lead times and storage footprint quarterly.
FAQs
What costs should I exclude from carrying cost?
Leave out costs that aren't tied directly to keeping inventory on hand.
That means ordering costs like admin work or shipping fees tied to new purchase orders. It also means stockout costs like lost sales or damage to your reputation when products run out.
Those costs still matter for inventory planning. They just don't belong under carrying costs. Carrying costs cover capital, storage, service, and risk expenses.
Should I use monthly averages or beginning-and-ending inventory?
Use the average of your beginning and ending inventory to get your average inventory value. Just add the inventory value at the start of the period to the value at the end, then divide by two.
If your business has big seasonal swings or sells perishable goods, this simple method may not tell the whole story. In that case, averaging monthly inventory figures across 12 months can give you a steadier and more accurate number.
How often should I recalculate carrying cost?
Review carrying cost on a regular schedule, like weekly or monthly, and track it alongside your inventory KPIs. Those steady check-ins make it easier to spot patterns early, avoid stockouts, and keep overstock from piling up.
Carrying cost is usually calculated as a yearly number. Even so, looking at it often helps you react faster when inventory levels shift or related costs start to creep up.
Keep reading
Try Forstock free for 14 days.
AI-powered demand forecasting and reorder automation for Shopify brands. No credit card required.