
What Is the Cash Conversion Cycle for a CPG Brand? (With a Worked Example)
CCC shows how long cash sits in inventory, invoices, and supplier payments—and which levers free working capital.

What Is the Cash Conversion Cycle for a CPG Brand? (With a Worked Example)
Cash conversion cycle tells me one thing fast: how many days my cash is stuck before it comes back. For a CPG brand, that usually means cash goes out for inventory, waits while product sits, waits again while wholesale invoices get paid, and only then returns.
Here’s the short version:
- CCC formula: Inventory Days + A/R Days − A/P Days
- High CCC = cash is tied up longer
- Low CCC = cash comes back sooner
- Negative CCC = I get paid before I pay suppliers
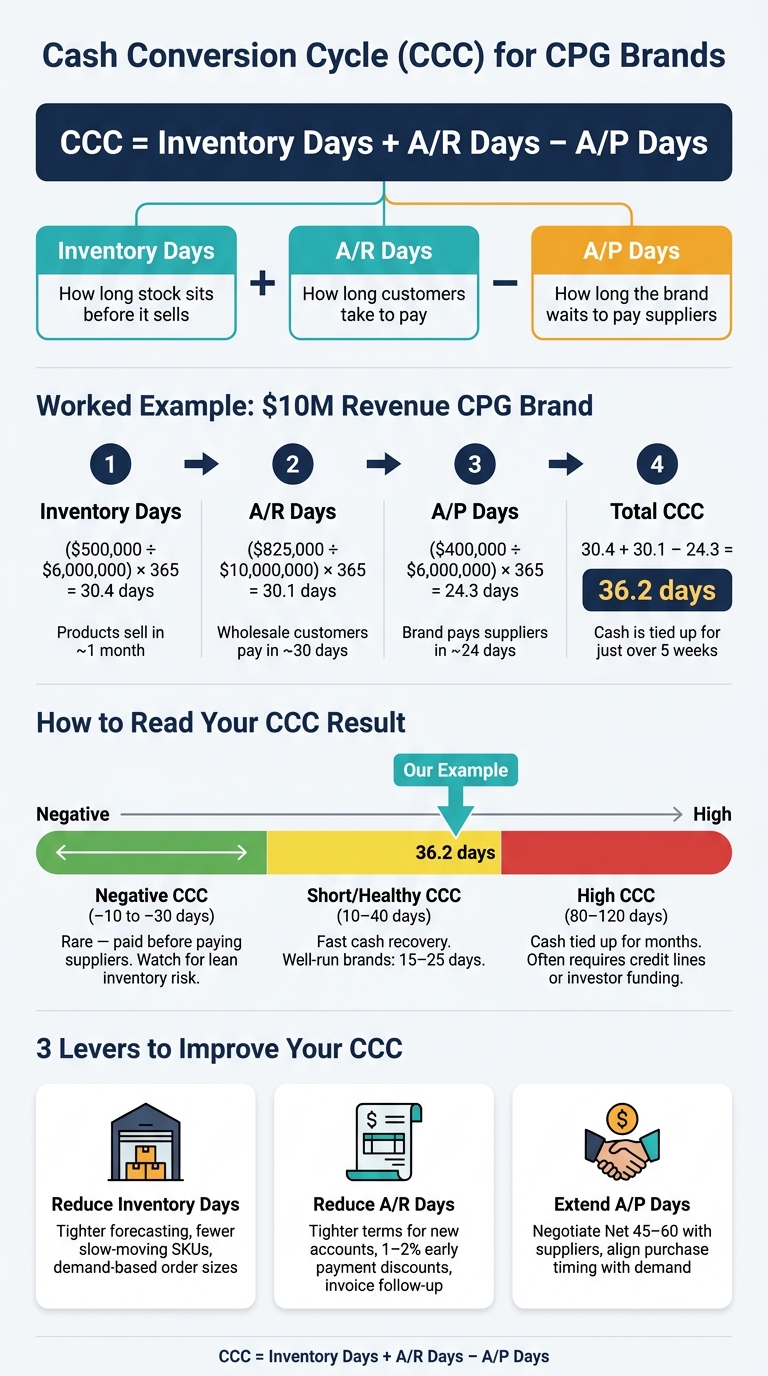
The worked example in the article lands at 36.2 days:
- Inventory days: 30.4
- A/R days: 30.1
- A/P days: 24.3
- Total CCC: 36.2 days
That means about five weeks pass between cash going out and cash coming back.
What drives the number:
- Inventory that sits too long
- Wholesale payment terms like Net 30 or Net 45
- Supplier terms that are shorter than customer terms
What I’d watch most:
- A short CCC often falls around 10 to 40 days
- A high CCC can stretch to 80 to 120 days
- DTC-heavy brands may collect cash fast, while wholesale-heavy brands often wait much longer
The main takeaway is simple: if I track CCC each month, I can see whether inventory, receivables, or payables are putting pressure on cash before I place the next big PO.
This article walks through the formula, the math, and a plain-English example using $10,000,000 in revenue and $6,000,000 in COGS.
Cash Conversion Cycle for CPG Brands: Formula, Example & Benchmarks
Cash Conversion Cycle - EXPLAINED
sbb-itb-f0fc809
How to calculate each part of the cash conversion cycle
For a CPG brand, CCC comes down to three moving parts: buying inventory, collecting customer payments, and paying suppliers. Use average balances from the same 12-month period for all three inputs so you're comparing like with like.
Inventory days: how long stock sits before it sells
Inventory days = (Average Inventory ÷ COGS) × 365
Use inventory value that ties back to COGS: finished goods, WIP, and fast-turn raw materials and packaging. In many cases, finished goods have the biggest effect because they already hold the material, labor, and overhead costs locked into the product.
Inventory days tend to climb when a brand buys too much, a retail SKU doesn't move, or the product mix gets too broad. When sell-through slows, more cash gets stuck in inventory, which pushes CCC up.
For fast-moving CPG products, a common target is 30–60 inventory days. Moderate-turn brands often fall in the 60–120 day range. Slow-moving or seasonal SKUs can go past 120 days and stretch the cash conversion cycle in a meaningful way.
Next, apply the same logic to customer invoices and supplier bills.
Accounts receivable days: how long customers take to pay
A/R days = (Average Accounts Receivable ÷ Revenue) × 365
This matters most for wholesale and retail payment terms. DTC card payments usually create under 10 A/R days. Wholesale-heavy brands with Net 30 to Net 45 terms often land in the 30–60 A/R days range, and that figure can move higher when retailers pay late or when deductions and chargebacks slow settlement.
If your business sells through both channels, calculate A/R days separately for wholesale and DTC. That makes it much easier to spot where the lag comes from.
That figure becomes the receivables input in the CCC formula.
Accounts payable days: how long the brand can wait to pay suppliers
A/P days = (Average Accounts Payable ÷ COGS) × 365
A/P includes what you owe to co-packers, ingredient vendors, contract manufacturers, and packaging suppliers. Use COGS as the denominator because A/P follows product-related costs.
Longer supplier terms lower your CCC directly. In the U.S., common supplier terms and their approximate A/P days look like this:
| Supplier terms | Approximate A/P days |
|---|---|
| Prepay or cash on delivery (COD) | 0–5 days |
| Net 15–Net 30 | 15–30 days |
| Net 45–Net 60 | 45–60 days |
Even a small extension can help. Moving from Net 30 to Net 45, for example, can offset some of the cash tied up in inventory and unpaid invoices.
These three inputs feed straight into the worked example below.
Worked example: calculating CCC step by step with realistic CPG numbers
Example inputs for a growing omnichannel CPG brand
Here’s a simple 365-day example using numbers for a hypothetical brand. The setup assumes a 40% gross margin, Net 30–45 wholesale collections, and supplier terms around Net 30.
| Input | Value |
|---|---|
| Annual revenue | $10,000,000 |
| Annual COGS | $6,000,000 |
| Average inventory | $500,000 |
| Average accounts receivable | $825,000 |
| Average accounts payable | $400,000 |
Steps 1 through 4: inventory days, receivable days, payable days, and total CCC
The process is pretty straightforward: calculate each part, then combine them. Just make sure you use the same 12-month period for revenue, COGS, inventory, receivables, and payables. If the time periods don’t line up, the result can get messy fast.
Step 1 - Inventory days: ($500,000 ÷ $6,000,000) × 365 = ≈ 30.4 days
That means inventory sits for about one month before it sells.
Step 2 - Receivable days: ($825,000 ÷ $10,000,000) × 365 = ≈ 30.1 days
This lines up with Net 30 terms, so customers are paying about when you’d expect.
Step 3 - Payable days: ($400,000 ÷ $6,000,000) × 365 = ≈ 24.3 days
In plain English, the brand is paying suppliers in about 24 days, which is shorter than many CPG payment terms.
Step 4 - Total CCC: 30.4 + 30.1 − 24.3 = ≈ 36.2 days
So the brand’s cash is tied up for a little over five weeks.
| Component | Formula | Result | Interpretation |
|---|---|---|---|
| Inventory days | ($500,000 ÷ $6,000,000) × 365 | ≈ 30.4 days | Products sell through in about one month |
| Receivable days | ($825,000 ÷ $10,000,000) × 365 | ≈ 30.1 days | Wholesale customers pay in roughly 30 days |
| Payable days | ($400,000 ÷ $6,000,000) × 365 | ≈ 24.3 days | Brand pays suppliers in about 24 days |
| Total CCC | 30.4 + 30.1 − 24.3 | ≈ 36.2 days | Cash is tied up for just over five weeks |
That 36.2-day figure gives you a starting point. It helps you judge whether cash is staying tied up too long and where the pressure is coming from, whether that’s inventory, collections, or supplier terms.
To run the same math for your business, swap in your own annual revenue, COGS, and average balances. For average balances, use:
(beginning balance + ending balance) ÷ 2
How to read the result and act on it
What high, low, and negative CCC values mean
Use the 36.2-day example as a starting point when you read your own CCC.
A high positive CCC - say, 80 to 120 days - means cash stays tied up for a long stretch before it comes back. In plain English, you’re often using credit lines or investor money to fund the next production run.
A short positive CCC, in the 10 to 40 day range, points to faster cash recovery. Well-run CPG brands often land around 15 to 25 days, while 40 to 60 days tends to show strain.
A negative CCC - for example, –10 to –30 days - is rare for inventory-heavy CPG brands. It can happen when a DTC brand gets paid at checkout but doesn’t have to pay suppliers until net 60 to 90. That can help growth. But there’s a catch: it may also mean inventory is too lean, or suppliers are being pushed in ways that add supply risk.
Start by comparing CCC against your own trend, then look at a benchmark. If CCC keeps climbing as revenue grows, working capital is getting stretched. That’s the signal. The next step is to break the number back into its parts: inventory, collections, and supplier terms.
The three main levers: sell-through speed, customer terms, and supplier terms
Each part of CCC connects to a lever you can pull.
Inventory days drop when products sell faster. Usually, that comes down to tighter forecasting, fewer slow-moving SKUs, and order sizes based on actual demand instead of best-case guesses. Set target days of supply by product type, then flag purchase orders that go past those limits.
Receivable days shrink when customers pay sooner. For wholesale-heavy brands, this is often where the biggest gains sit. If you cut average receivable days from 60 to 45, CCC drops by 15 days. At scale, that can cut financing needs by a lot. Simple moves can help:
- Tighten default terms for new, smaller accounts
- Offer a 1% to 2% discount for payment within 10 to 15 days
- Put a real follow-up process in place for overdue invoices
Payable days go up when you pay suppliers later. A modest term extension during contract renewal is often a sensible place to start, especially if growing order volume gives you leverage. Be selective. Focus on suppliers where term changes are less likely to disrupt operations, and protect ties with suppliers that are hard to replace. You can also line up purchase timing more closely with demand so the gap between cash going out and product selling gets smaller, even if payment terms don’t change.
How better inventory planning supports CCC decisions
Once you know which lever is moving CCC, track it every month. CCC changes with ordering patterns, timing, and account terms - and those calls happen all the time across retail POs, wholesale agreements, and SKU-level sell-through.
That’s where inventory planning tools like Forstock become useful in day-to-day work. When a platform combines demand forecasting, purchase order management, and inventory health monitoring, you can spot the working-capital effect of a decision before you lock it in.
For example, a snack brand might use such a platform to simulate a large seasonal buy for a national retailer; the tool could show that the purchase would push inventory days from 50 to 80 and CCC from 60 to 90, prompting the brand to negotiate staged deliveries or adjust quantities.
The goal isn’t to force CCC down by slashing inventory until shelves go empty or suppliers get squeezed. The goal is to treat CCC like a live operating metric - something you watch, test, and use in real decisions.
Conclusion: putting CCC to work in day-to-day operations
The main point from the example above is straightforward: CCC shows how long your cash stays tied up in inventory, receivables, and payables. For most CPG brands, inventory days make up the biggest part of that total because cash sits in product before that product sells.
That’s why even small improvements in inventory days, collections, or supplier terms can free up meaningful working capital. In plain English, you get more room to pay for production and inventory purchases without putting extra strain on cash.
Calculate CCC every month alongside your P&L and cash forecast. Before you approve a large purchase order or commit to a new retail account, estimate how that move will affect inventory days and your overall CCC. Then check that you have enough cash or credit to support the cycle if it gets longer.
Use CCC as a monthly operating metric, not just a finance number you glance at after the fact. Track the trend across sell-through, collections, and supplier terms, then use those patterns to guide purchasing decisions and supplier talks each quarter.
FAQs
How often should I calculate CCC?
Calculate your Cash Conversion Cycle and related inventory metrics at least weekly or monthly to keep cash flow in good shape.
A weekly check can help you spot patterns early, avoid stockouts, and make faster changes in day-to-day operations. If you sell perishable goods, tracking more often makes even more sense. Timing matters here: for clean numbers, make sure the periods you use for cost of goods sold and average inventory match.
What is a good CCC for a CPG brand?
A “good” cash conversion cycle (CCC) for a CPG brand is as low as your business model allows. The shorter your CCC, the less cash gets stuck in inventory and the faster you collect receivables.
In Forstock’s framework, that usually comes down to strong inventory efficiency and tight control over payment timing. As a practical benchmark, many retailers aim for inventory turnover of 5–10 times per year. That works out to about 37–73 days inventory outstanding.
Can my CCC be negative?
Yes. A negative Cash Conversion Cycle (CCC) means you get paid by customers before you need to pay suppliers for the inventory you sold.
Put simply, your suppliers are helping fund your day-to-day operations with interest-free capital. That’s usually a very efficient working-capital position because cash comes in before your bills are due.
Keep reading
Try Forstock free for 14 days.
AI-powered demand forecasting and reorder automation for Shopify brands. No credit card required.