
Why Your CPG Brand Sold Out and Still Ran Out of Cash
Stockouts, thin margins, and slow wholesale terms can leave CPG brands sold out but cash-poor — practical fixes for inventory and cash planning.

Why Your CPG Brand Sold Out and Still Ran Out of Cash
Selling out is not the win it looks like if cash lands too late. I can have strong sales, a positive P&L, and still run short on cash when money goes out for inventory, freight, and payroll weeks before wholesale payments arrive.
Here’s the short version:
- Sold out means inventory is gone
- Profit means sales were higher than costs on paper
- Cash means money is in the bank when bills are due
That gap usually comes from three things:
- Stockouts stop future sales while I’m still paying for the next run
- Low margins mean growth eats cash instead of adding to it
- Slow wholesale terms like Net 45 to Net 90+ delay collections
A few numbers show the problem fast:
- A brand can spend $33,000 before selling a single unit
- A 90-day cash conversion cycle on $3,000,000 in annual revenue can need about $740,000 in working capital
- DTC cash may arrive in about 2 days, while wholesale cash can take 45 to 90+ days
To fix it, I’d focus on a short checklist:
- Track cash conversion cycle
- Set reorder points and safety stock
- Forecast inventory in units and dollars
- Use open-to-buy limits
- Check every PO against a 13-week cash forecast
| Problem | What it does | What to check |
|---|---|---|
| Stockouts | Pause sales | Reorder timing, lead times, safety stock |
| Thin margins | Growth uses cash | SKU margin, channel mix, landed cost |
| Slow collections | Cash shows up late | DSO, retailer terms, AR follow-up |
In other words: sales do not fund the business unless margin, inventory, and payment timing stay lined up. That’s the lens I’d use before placing the next PO.
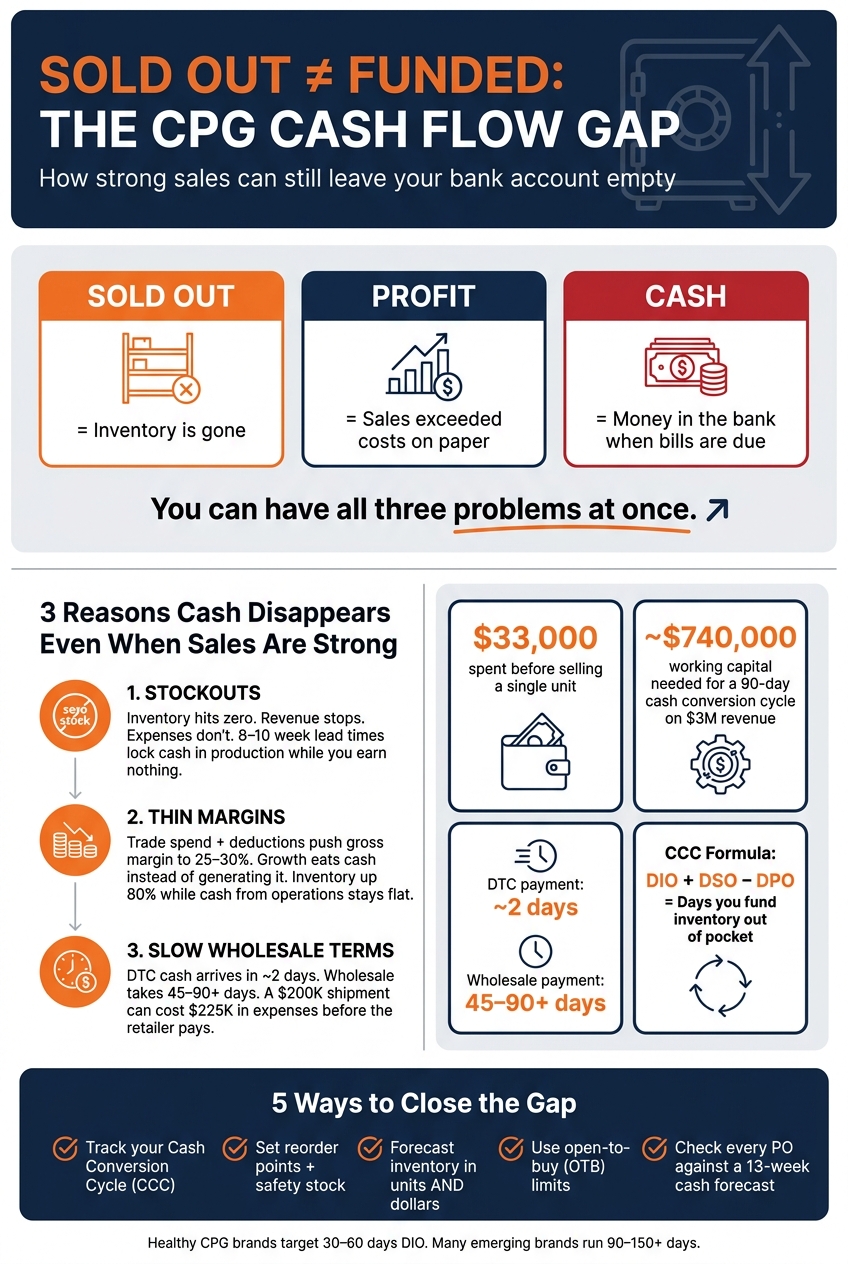
CPG Cash Flow Gap: Why Selling Out Doesn't Mean You're Funded
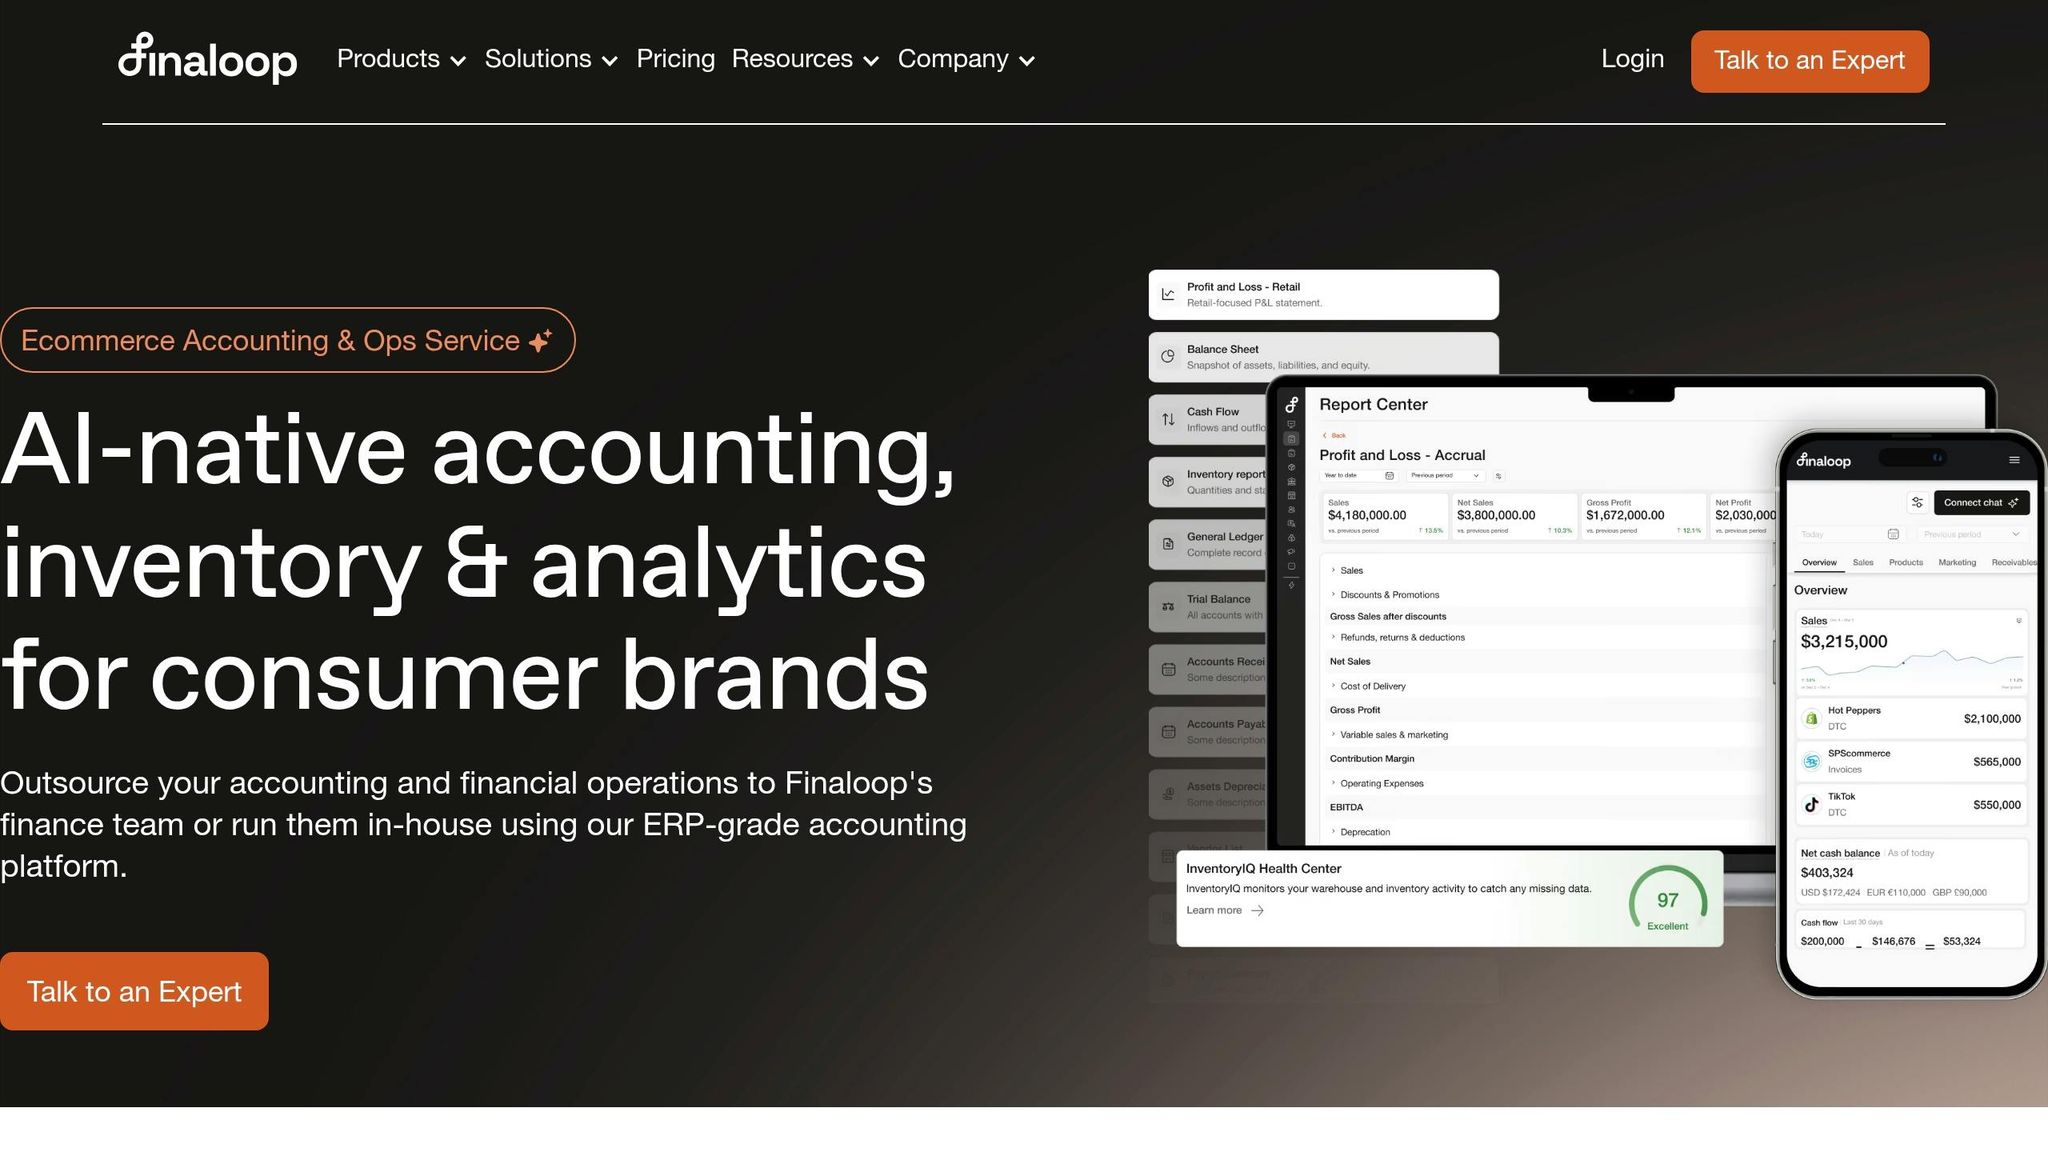
Boost Your Business’s Cash Flow: Working Capital 101 with Finaloop | Webinar
Why your brand sold out and still ran out of cash
Three things usually cause the squeeze: stockouts, thin margins, and slow wholesale payments. And they often land at the same time. That’s why a cash crunch can seem to come out of nowhere, even after months of strong sales.
Stockouts paused future revenue while reorders tied up cash
Once inventory hits zero, Shopify orders stop. Wholesale reorders stop too. But expenses keep coming.
For a brand making products overseas, 8–10 week lead times are common. Here’s the trap: a brand sells out in 3–4 weeks, but production still takes 8–10 weeks and the factory wants 50% upfront. So by week 3, a big chunk of cash is already locked into the next run. Then comes a 4–5 week stretch with little to no revenue. Cash is stuck in production, freight, and duties before the next unit is even ready to sell.
A simple way to estimate lost profit is:
average daily units sold × stockout days × contribution margin per unit
And when sales finally come back, the next inventory purchase can make the gap worse if margins are too thin.
Low-margin growth increased revenue but reduced available cash
More revenue doesn’t always mean more cash. In fact, it can do the opposite.
Trade spend, deductions, and landed costs can push effective gross margin down to 25%–30%. If inventory has to support 45–60 days of sales, growth can eat up more cash than the gross profit it brings in.
One number matters a lot here: inventory growth versus sales growth. If inventory is up 80% while cash from operations is flat or negative, the business is paying for growth that hasn’t started funding itself yet.
Then there’s the last pressure point: collections. In wholesale, cash often shows up after the next bill is already due.
Wholesale payment terms let expenses hit before cash arrives
DTC cash usually arrives in about 2 days. Wholesale often takes 45–90+ days, while co-packers, freight, and payroll need to be paid much sooner.
Take a brand that ships $200,000 of product to a national retailer on Net 60 terms. It may spend $225,000 on production, freight, and promo costs in the first 30 days, while the retailer’s payment is still another 30 days out. That mismatch hurts.
On a bigger scale, a 90-day cash conversion cycle with $3M in annual revenue can call for about $740,000 in working capital.
A short framework to diagnose where the cash went
Start by figuring out where cash is getting stuck: in inventory, in unpaid invoices, or in supplier payments that go out before customer money comes in. A brand can be selling fast and still hit a cash crunch if the next production bill shows up before the last sale turns into cash. That split gives you the fastest read on whether the issue is inventory levels, collection timing, or supplier timing.
Calculate your cash conversion cycle across inventory, receivables, and payables
The cash conversion cycle (CCC) shows how many days pass between paying for inventory and getting that cash back from customers:
CCC = Days Inventory Outstanding (DIO) + Days Sales Outstanding (DSO) − Days Payables Outstanding (DPO)
DIO = (Average Inventory ÷ COGS) × 365 - how long cash sits in inventory before a sale.
DSO = (Accounts Receivable ÷ Credit Sales) × 365 - how long it takes to collect after the sale.
DPO = (Accounts Payable ÷ COGS) × 365 - how long you take to pay suppliers.
If your DIO is 90 days, your DSO is 60 days, and your DPO is 30 days, your CCC is 120 days. In plain English, you're funding inventory for 4 months on every dollar spent. Healthy CPG brands often run 30–60 days of DIO, while many emerging brands sit at 90–150+. And if DSO runs above 1.5× your stated Net terms, that's a collections warning sign.
| CCC Component | Warning Sign | What It Signals |
|---|---|---|
| DIO > 90 days | Inventory sits too long | Overbuying, slow SKUs, or long lead times |
| DSO > 1.5× Net terms | Collections lag invoices | Retailer payment delays or weak AR follow-up |
| DPO much shorter than DSO | Paying faster than collecting | Persistent cash gap even with strong sell-through |
If your CCC is stretched, the next step is simple: check whether you're reordering too late, too early, or in the wrong quantity.
Check reorder timing, safety stock, and purchase order size
Once you have your CCC, dig into why DIO is high. In a lot of cases, the problem comes back to one thing: reordering that isn't tied closely enough to actual demand.
Reorder Point = (Average Daily Demand × Lead Time in Days) + Safety Stock
Let's say a SKU sells 47 units per day and total lead time is 23 days. You should place a new PO when on-hand inventory, plus firm inbound, falls to about 1,400 units (47 × 23 + 300 units of safety stock). Miss that point and you stock out. And stockouts don't just hurt sales. They often force a larger, pricier catch-up order later.
Large MOQs can make this even tougher. If a supplier sets a high minimum, you may end up buying several months of supply for a slow-moving SKU just to meet the threshold. That's where one-size-fits-all rules get you into trouble. Slow movers usually need tighter coverage, while top sellers can carry more room.
Review channel mix, SKU margin, and cash tied up in open POs
Channel revenue can look almost the same on a top-line report while the cash picture underneath tells a very different story. CPG DTC gross margins often land around 50–70% before customer acquisition costs, while wholesale net of trade spend and slotting can drop to 30–45%. So if your mix shifts toward wholesale, you can get squeezed on both margin and timing at the same time.
Also track the cash tied up in open POs. Inventory in transit is still cash that's out the door, even if it hasn't reached the warehouse yet. Finance and operations should look at on-hand inventory, inbound inventory, and open PO commitments as one cash number, not three separate buckets. Once that leak is clear, those numbers should drive the next purchase order.
sbb-itb-f0fc809
How to plan inventory without triggering another cash shortfall
If your cash conversion cycle is stretched, inventory planning is one of the best places to tighten it up. The goal is simple: don’t approve a PO based on demand alone. Check demand and cash at the same time.
The fastest way to do that is to connect your forecast, PO size, and cash position before you buy.
Forecast demand in both units and dollars before buying inventory
Forecast in both units and dollars. Units show how much to buy. Dollars show whether you can pay for it.
Start with at least 12–18 months of sales history by SKU and channel, broken out by week or month. From there, build a bottom-up unit forecast at the SKU level using past sales, then layer in known changes like new retail doors, planned promotions, and seasonality.
Next, build a top-down revenue target by channel and reconcile it against the SKU forecast. If the bottom-up SKU totals don’t get you to the top-down goal, you need a clear reason for the gap to close. That could be more doors, higher velocity, or a price increase. It should not be a vague growth assumption.
Once units are reconciled, multiply each SKU’s forecasted units by its landed cost. That gives you the dollar value of inventory you’ll need to purchase. And that’s the number that hits your bank account.
Once the forecast is in dollars, cap it with an open-to-buy budget and a 13-week cash view.
Use open-to-buy and a 13-week cash view before placing purchase orders
An open-to-buy (OTB) budget puts a dollar ceiling on what you can purchase in a given period:
OTB = (Planned Sales + Target Ending Inventory) − (Current Inventory + On-Order Inventory)
Set target ending inventory in weeks of supply, then convert it to dollars using landed cost. If cash is tighter than your OTB allows, give priority to high-margin, high-velocity SKUs and push the rest.
OTB works best when paired with a 13-week cash forecast. Map out supplier deposits, freight, duties, and final balances week by week. Then add expected inflows, like Shopify payouts and wholesale collections on Net 30 or Net 60 terms, and set a minimum cash floor, such as $50,000.
Before approving any large PO, run it through that forecast. This makes cash timing part of the buying decision instead of something you deal with later. If the order pushes cash below your floor in any week, you have a few options:
- Split the order
- Negotiate staggered payments
- Delay the timing until the numbers work
Adjust batch sizes, in-stock targets, and supplier terms to protect cash
Large MOQs can create sharp cash spikes. When you can, negotiate lower MOQs on core SKUs in exchange for a volume commitment. Even if your per-unit cost goes up a bit, that trade can still make sense if it cuts the cash tied up in each order.
It also helps to stop treating every SKU the same. Use ABC classification to set in-stock targets based on each item’s role in the business:
- A items: target 98–99% in-stock, with more safety stock and more frequent reorders
- B SKUs: target 95–97%
- C SKUs: target 90–93%, with very little safety stock
This shifts working capital away from slow movers and toward the products that drive sales.
On the supplier side, push for staggered payment terms. For example, try 30% on PO approval, 40% at shipment, and 30% Net 30 after arrival instead of one large upfront payment. Sharing a 12- to 18-month demand and purchase forecast with your supplier gives them a better view of your order rhythm, which can make them more open to extending terms.
Small changes in deposit size and payment timing can ease cash pressure in a big way. That turns your buying plan into something that protects cash instead of draining it.
Using Forstock to connect inventory plans with cash timing
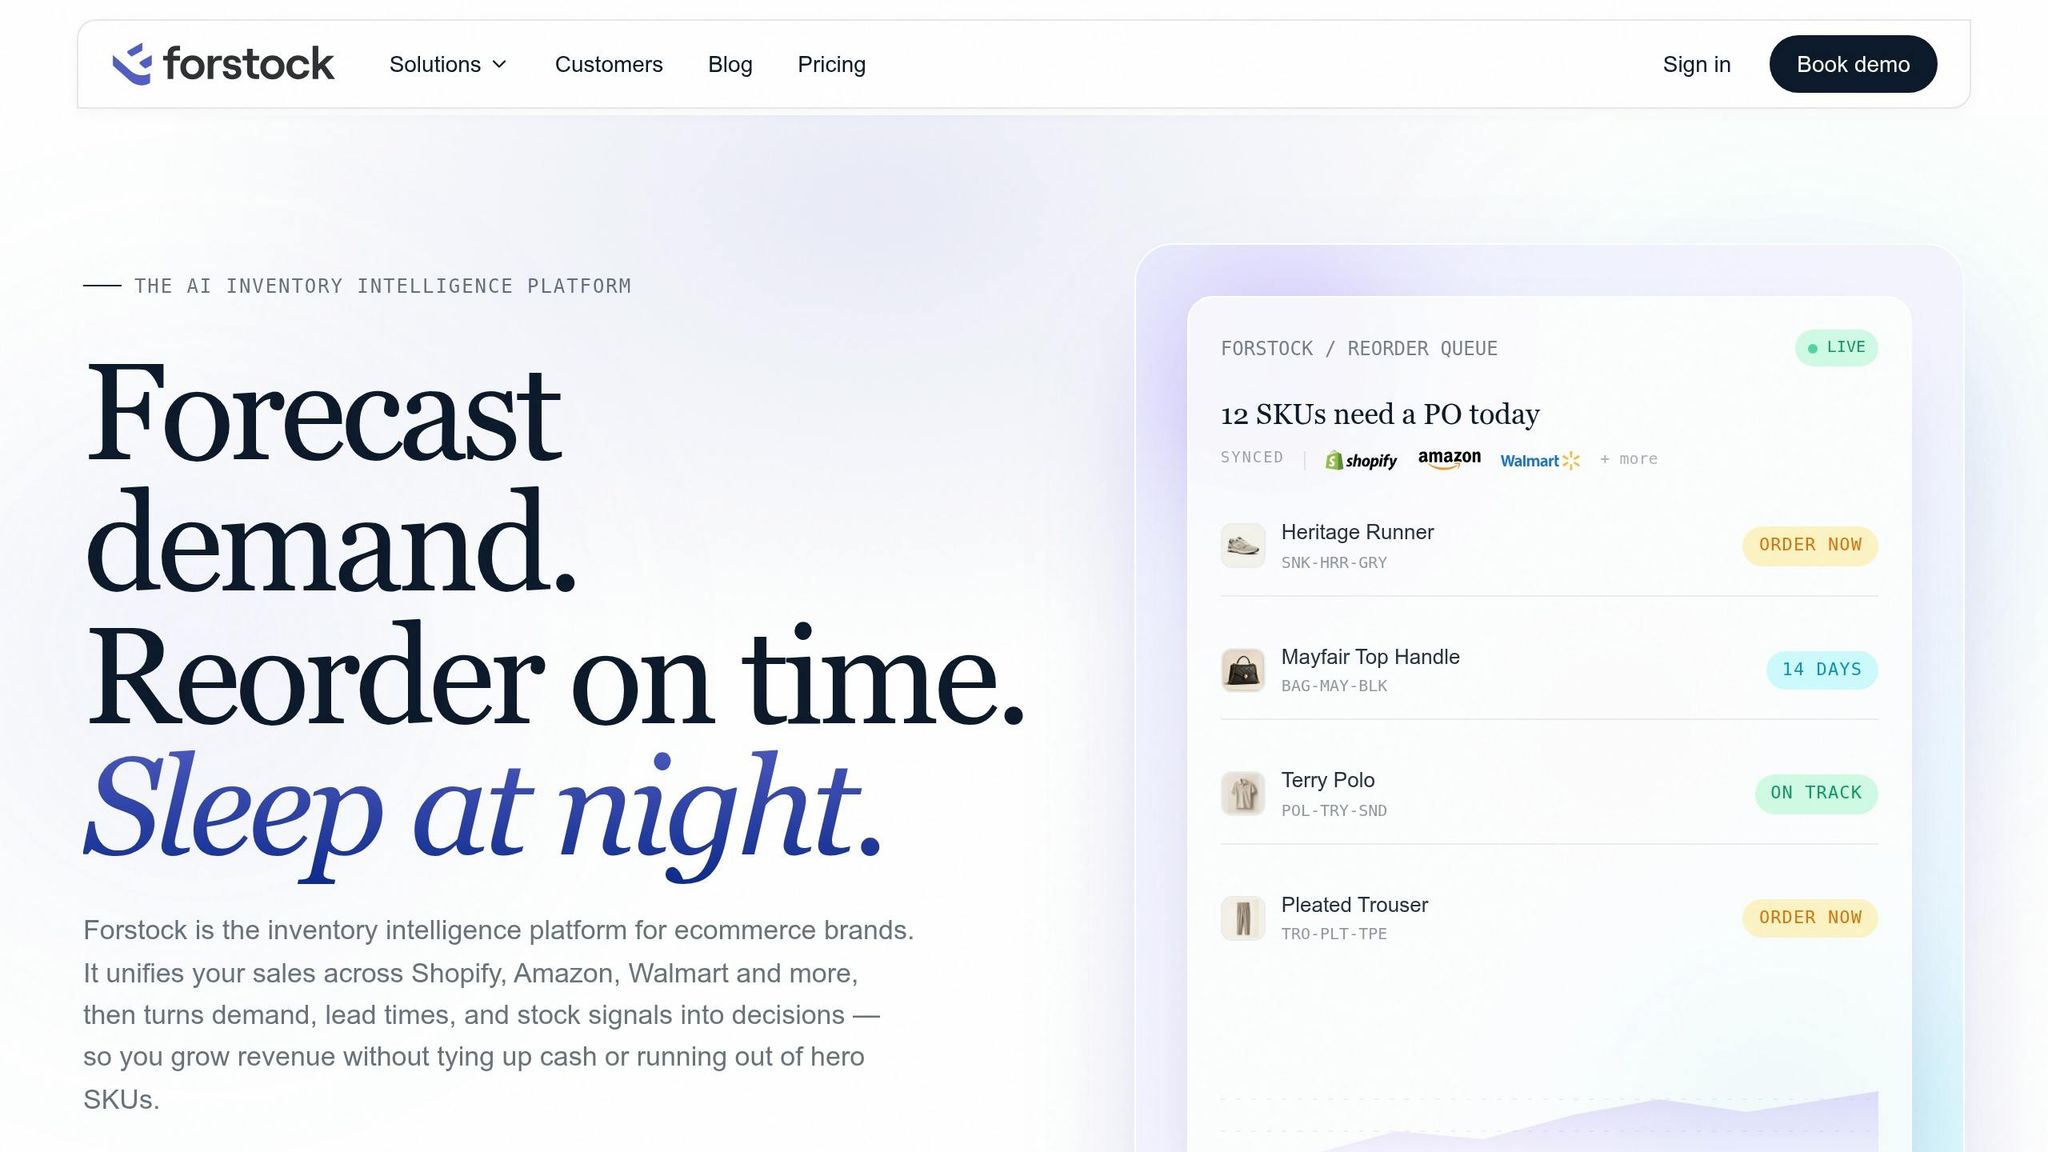
Once the planning rules are clear, the next step is putting them to work. Forstock turns OTB budgets and 13-week cash forecasts into a live planning system, so sales, purchasing, and cash move together as demand shifts. Spreadsheets get old fast when sales plans and purchase plans keep changing. Forstock keeps those inputs linked and up to date, turning cash planning from a static spreadsheet into a live buying constraint.
Turn Shopify and wholesale demand into replenishment plans that reflect cash limits

Forstock connects directly to Shopify and wholesale order systems to pull historical sales, open orders, returns, and seasonality patterns at the SKU level. It then turns unit forecasts into dollar needs by layering in COGS, lead times, MOQs, and supplier terms. The result is a cash-aware replenishment plan, not a blind PO.
Replenishment recommendations are screened against your cash limit. If cash gets tight, Forstock can surface a trade-off like: "Delay reorders for low-margin SKU X by two weeks and reallocate $10,000 to high-margin SKU Y to avoid a cash shortfall in week 9."
See stockout risk, excess inventory, and committed cash together
From there, the big win is visibility. Forstock puts on-hand inventory, inbound POs, stockout risk, and cash commitments in one dashboard, along with expected receipts tied to open POs and forecasted sales.
That mix matters because a brand can show 30% month-over-month revenue growth while 60% to 70% of its available cash is locked in open POs for slow-moving SKUs. When you can see stockout risk, excess inventory, and committed cash in the same place, you can ask the question that matters: which inventory is draining my cash, and which inventory is putting future revenue at risk?
Test growth scenarios before committing cash to a purchase order
That same visibility makes it much easier to test growth before you spend. Forstock lets you model the cash and inventory impact before you commit to a PO. A +40% unit lift tied to a national ad campaign or a new grocery chain's initial buy each gives you a side-by-side view of inventory coverage, stockout risk, and cash demand by week.
So you can approve the launch and push lower-priority buys later before cash is committed, which helps prevent the next round of stockouts and a scramble for liquidity.
Conclusion: Sell-through is only healthy when cash timing, margin, and inventory stay aligned
A sold-out SKU can still put pressure on cash. Selling out tells you demand is there. It does not tell you the business is funded. In CPG, cash goes out first through deposits, production, and freight. Wholesale cash often shows up later. That’s the core tension: sold out does not mean funded.
Thin margins make that gap worse. Every new order uses working capital before enough gross profit flows back in.
The fix starts with the same lens you used to spot the problem: units, margin, and cash timing. Forecast in units and dollars. Set safety stock based on demand swings. Cap buys with open-to-buy. And before you approve any PO, run it through a 13-week cash view.
For CPG brands on Shopify, inventory should be approved only when demand, margin, and cash all line up. Selling out should free cash, not drain it.
FAQs
Why can my brand be profitable but still run out of cash?
Profit on your P&L doesn't mean cash is sitting in the bank.
A lot of that cash gets stuck in inventory and badly timed purchase orders. So even if sell-through looks strong, you can still end up squeezed.
That happens when you:
- pay suppliers 30–90 days before the product sells
- keep slow-moving or seasonal stock on hand for too long
- miss reorder timing
- run into stockouts that lead to lost sales and rush replenishment costs
It's a common retail problem. On paper, things look fine. In practice, cash leaves early and comes back late.
What is a healthy cash conversion cycle for a CPG brand?
A healthy cash conversion cycle is as short as possible. It shows how long it takes to turn money tied up in inventory into cash from sales.
There’s no single benchmark that fits every business. Still, strong efficiency often looks like higher inventory turnover - usually 5 to 10 turns per year - along with low Days Inventory Outstanding (DIO).
When the cycle is shorter, a business keeps more cash on hand. That can help protect liquidity, keep day-to-day operations running smoothly, and free up money to put back into growth without running into cash flow gaps.
How do I know if a purchase order will create a cash shortfall?
Don’t rely on your P&L alone. Use a 13-week rolling cash forecast to line up expected inflows against committed outflows, including payment timing and seasonal swings.
Then look at the cash you’ll have left after fixed, variable, and one-off expenses. Compare that with your open PO obligations and the proposed order. Also, keep a close eye on your inventory position - on-hand plus inbound - not just what’s sitting on the shelf today.
Keep reading
Try Forstock free for 14 days.
AI-powered demand forecasting and reorder automation for Shopify brands. No credit card required.