How to Calculate Reorder Points for Shopify: Formula, Example, and Common Mistakes
Set Shopify reorder points using sales velocity, lead time, and safety stock—includes step-by-step example and common mistakes.
How to Calculate Reorder Points for Shopify: Formula, Example, and Common Mistakes
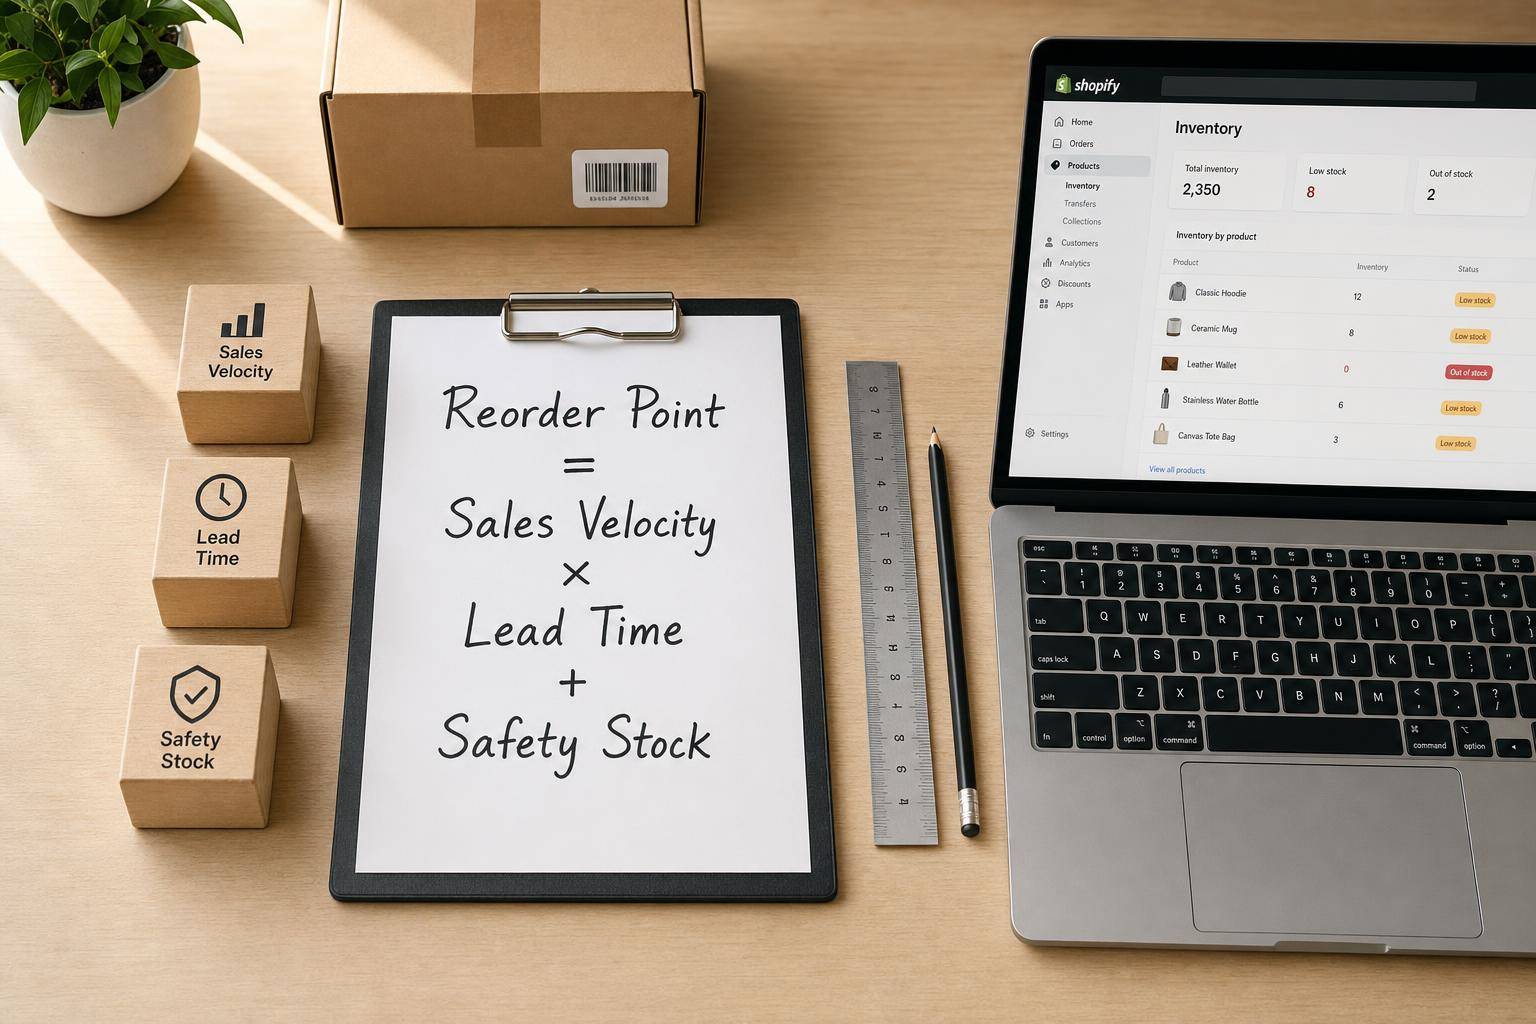
If you sell on Shopify, your reorder point is the stock level where you should place the next PO before you run out. I’d calculate it with this formula: (average daily sales × lead time in days) + safety stock.
Here’s the short version:
- Average daily sales = how many units one SKU sells per day
- Lead time = total days from PO to sellable stock
- Safety stock = extra units for demand spikes or supplier delays
- Reorder point = your reorder trigger for each variant
Why this matters:
- Stockouts cost retailers about 3% of annual revenue
- 43% of shoppers buy from a competitor after seeing an item is out of stock
- Carrying too much inventory can cost 20%–30% of average inventory value per year
So the goal is simple: order late enough to avoid tying up cash, but early enough to stay in stock.
A few points I’d keep in mind right away:
- Use one reorder point per SKU or variant
- Use actual PO history, not supplier estimates alone
- Remove out-of-stock days when figuring sales per day
- Check inventory position, not just on-hand units
- Update inputs every 90 days or sooner if demand or lead times shift
The article also shows a full SKU example, explains how to pull the right numbers from Shopify and suppliers, and points out mistakes that can throw off your reorder math.
How to Calculate Inventory Reorder Points and Safety Stock Values
sbb-itb-f0fc809
The reorder point formula for Shopify SKUs

Reorder Point Formula for Shopify: Step-by-Step Calculation
Once you have the three inputs, you can calculate the reorder point for each Shopify variant.
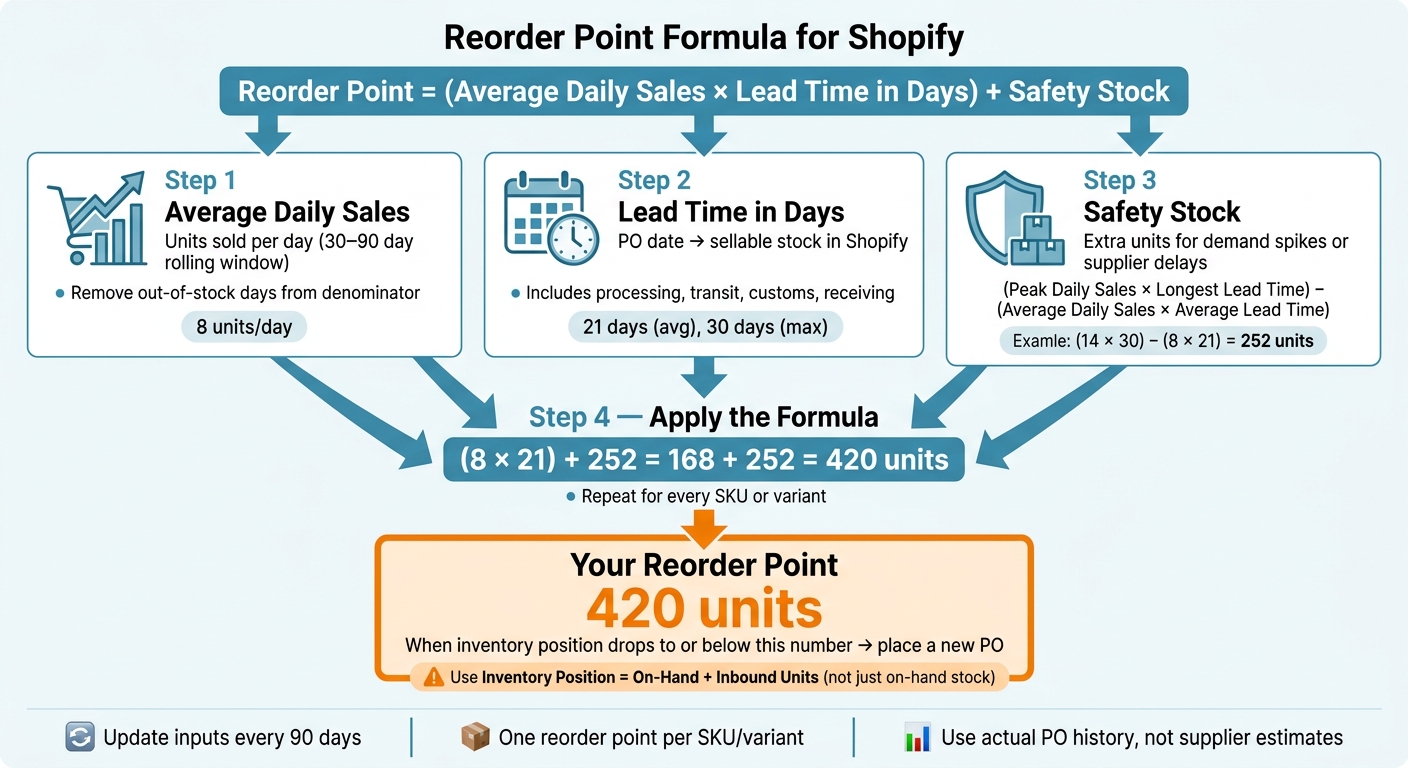
Reorder Point = (Average Daily Sales × Lead Time in Days) + Safety Stock
That number is your reorder trigger. When stock hits it, it’s time to reorder. From there, use actual Shopify sales history and supplier lead times to make the math match what’s happening in your store.
If you want a buffer based on risk, use this shortcut:
Safety Stock = (Peak Daily Sales × Longest Lead Time) − (Average Daily Sales × Average Lead Time)
How to define average daily sales, lead time, and safety stock
- Average daily sales: Use units sold per day from a recent 30-, 60-, or 90-day lookback.
- Lead time in days: Measure lead time from past purchase orders, from PO date to sellable receipt. That should include processing, transit, customs, and receiving.
- Safety stock: This is the extra buffer that covers demand spikes and supply delays, so you stay in stock without ordering too much (often managed via stockout alert tools).
For service-level-based safety stock, use 95% for most Shopify variants. For critical bestsellers, use 99%.
How to gather the right numbers from Shopify and suppliers
Now it’s time to pull the inputs from Shopify and your past purchase orders.
Calculate sales velocity from recent Shopify order history
Start by exporting unit sales by variant from Shopify. Then divide the units sold by the number of active days in your lookback window. The key here is consistency: use the same lookback window across all variants so your numbers line up.
For seasonal items, don’t lean on off-season averages. Use the same period from last year instead. That gives you a better read on demand as you head into a peak season.
Stockouts matter too. If a product was unavailable for part of the window, remove those out-of-stock days from the denominator. Say you sold 120 units over 30 days, but the item was out of stock for 10 of those days. In that case, divide by 20 days, not 30. That gives you a cleaner demand rate for each variant.
You’ll also want to filter out obvious outliers, such as:
- Promotional spikes
- Flash sales
- One-off bulk B2B orders
Those events can skew your normal daily sales rate and make your reorder numbers look better than they are.
Use that same mindset when you look at supplier timing.
Measure lead time from past purchase orders, not supplier promises
Supplier-quoted lead times are often 30% to 50% shorter than what happens in practice. So instead of relying on promises, measure the calendar days between placing the PO and having the inventory ready to sell in Shopify.
That full timeline should include supplier order processing, production if needed, transit, customs clearance, receiving, QC, and stock updates in Shopify. In plain English: don’t stop the clock when the shipment lands. Stop it when the product is actually sellable.
Track both the average lead time and the longest lead time for each supplier or SKU. That gives you a better base for setting safety stock. It also helps to review these numbers every 90 days using the last 6–12 months of PO history, since supplier performance and freight conditions can change over time.
If you’d rather not keep updating these inputs by hand, AI forecasting and automation can take that work off your plate.
Keep reorder inputs current with Forstock

Forstock connects directly to your Shopify store and pulls key reorder inputs into one place. That includes real-time sales data, supplier lead time tracking, reorder suggestions, safety stock, and 12-month demand planning.
Instead of jumping between spreadsheets and exports, you can keep Shopify sales, supplier lead times, reorder suggestions, and safety stock current in one system.
Worked example: Reorder point calculation from start to finish
Now let’s run the formula on one real SKU.
Step-by-step math for one Shopify variant
Take one Shopify variant with these past inputs:
- Average daily sales: 8 units
- Average lead time: 21 days
- Peak daily sales: 14 units
- Longest lead time: 30 days
First, calculate safety stock:
Safety stock = (14 × 30) − (8 × 21) = 252 units
Then drop that into the reorder point formula:
(Average daily sales × Average lead time) + Safety stock
(8 × 21) + 252 = 168 + 252 = 420 units
That means the reorder point for this variant is 420 units.
How to turn the result into a reorder decision
The math is only half the job. You still need to turn that number into a clear buying trigger.
When this variant’s inventory position reaches 420 units or drops below it, place a new purchase order. The key detail here is inventory position. Don’t look at on-hand stock by itself. Inventory position means on-hand stock plus any inbound units that are already on order but haven’t arrived yet.
Here’s a simple example: if you have 380 units on hand and 80 inbound, your inventory position is 460 units. That’s still above the reorder point, so you don’t need to reorder yet. Miss the inbound stock, and it’s easy to place duplicate orders and end up with too much inventory.
Manual vs. automated purchase orders: Forstock vs. spreadsheets
Doing this once for one SKU is pretty manageable.
The problem shows up when you try to repeat the same process across dozens or hundreds of variants. Spreadsheets can do the math, but they also need manual exports, manual formula setup, and regular refreshes. That’s where things start to slip.
Forstock handles the same process inside the system, with automatic Shopify sync and live updates as sales change.
| Factor | Manual Spreadsheet | Forstock |
|---|---|---|
| Data effort | High; requires manual exports and formula building | Low; automatic sync from Shopify |
| Update frequency | Requires periodic manual refreshes and often falls out of date | Continuous; updates in real time as sales come in |
| Error risk | High; prone to formula errors and missed updates | Low; logic is embedded and automated |
| Scalability across SKUs | Poor; difficult to manage beyond 20–50 SKUs | High; handles thousands of SKUs easily |
Next, review the mistakes that make reorder points unreliable.
Common mistakes to avoid and next steps
Mistakes that make reorder points unreliable
The formula itself is simple. Old inputs are what throw it off.
A common mistake is using a sales average that no longer matches current demand. Instead, use a 30- to 90-day rolling average and leave out one-time promotions so the number reflects normal sales.
Another trap is using stock on hand to estimate demand. When inventory drops, that approach makes demand look lower than it is.
Lead time causes trouble too. Supplier quotes are often shorter than the time you actually wait. Use your actual PO history, not the promised timeline. And make sure inbound stock is included, so you don’t reorder earlier than needed.
Not every SKU should get the same safety stock treatment. Slow-moving SKUs usually don’t need the same buffer as fast movers. Big buffers on slow movers can tie up cash, while buffers that are too small on high-margin SKUs can lead to stockouts.
How Forstock helps keep reorder points accurate
Keeping reorder points accurate is mostly about upkeep. If the inputs drift, the output drifts too.
Forstock keeps Shopify inventory dashboards live and uses current supplier history to keep those inputs up to date. It combines exponential smoothing and machine learning to choose the best forecasting method for each SKU, then adjusts safety stock based on lead-time variation and target service levels.
It also brings reorder suggestions, supplier management, and purchase-order creation into the same system. That means less lag between hitting a reorder trigger and placing the order.
Conclusion: The three-part formula to apply now
Calculate a reorder point for each variant using current daily sales, actual supplier lead times, and SKU-level safety stock. Then review each input at least every 90 days, and sooner if demand or supply changes in a big way.
FAQs
What is a good reorder point for a new SKU?
A good reorder point for a new SKU is:
(Estimated Daily Sales × Estimated Lead Time) + Safety Stock
Because the SKU is new, you’ll need to start with estimates. Use early sales data or industry benchmarks to gauge daily sales, plug in your supplier’s lead time, and then add a conservative safety stock buffer.
That gives you a practical starting point. As actual sales patterns and lead times come into focus, revisit the number and adjust it to help avoid stockouts or excess inventory.
How often should I recalculate reorder points?
Review reorder points on a regular schedule so they match current sales and supply conditions. A quarterly review, or every 90 days, is a common rule of thumb.
You should update them sooner when sales velocity shifts, supplier lead times move, or demand patterns change. For stable products, periodic reviews may be enough. Seasonal items or fast-moving products often need weekly or monthly updates.
Should I use on-hand stock or inventory position?
Use inventory position to decide your reorder point. It shows the stock you have available to sell, and it’s the number that tells you when it’s time to buy more.
To find your reorder point, use your sales velocity, lead time, and safety stock. Then compare that number to your inventory position. Once inventory falls to or below the reorder point, place a reorder.
Keep reading
Try Forstock free for 14 days.
AI-powered demand forecasting and reorder automation for Shopify brands. No credit card required.