
Your Supplier's Quoted Lead Time Is Lying to You. Here Is the Real Math
Use PO and receiving data to measure end-to-end lead time, compute variability, and set accurate reorder points and safety stock.

Your Supplier's Quoted Lead Time Is Lying to You. Here Is the Real Math
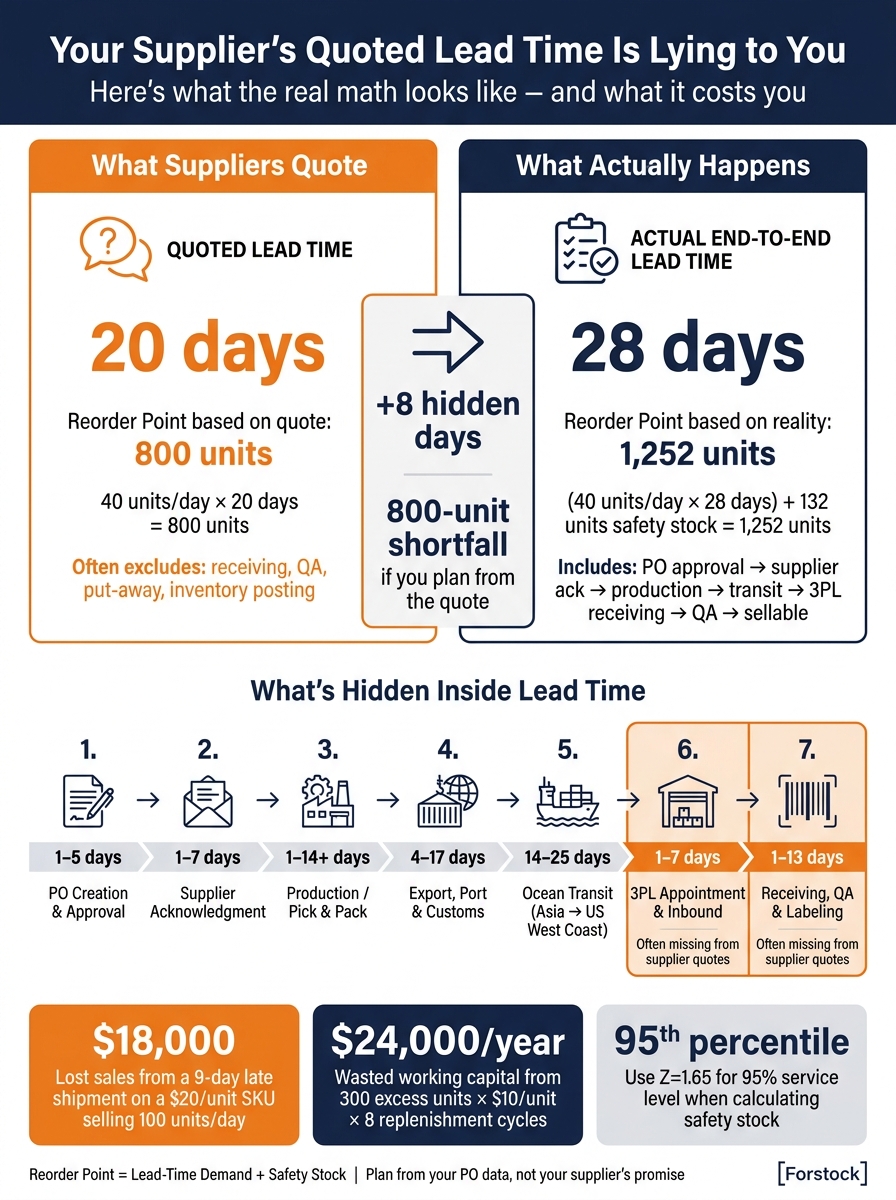
If you plan from a supplier’s quoted lead time, you may reorder too late or hold too much stock. What matters is the full time from PO release to inventory ready for sale. In the article’s examples, a quoted 20 days turns into 28 days in practice, and that gap can mean an 800-unit shortfall.
Here’s the short version:
- Quoted lead time is often incomplete. It may skip receiving, inspection, and inventory posting.
- Your planning input should be end-to-end lead time. That means PO to sellable inventory.
- Average lead time is not enough. You also need to track variation from one PO to the next.
- Reorder point = lead-time demand + safety stock.
- Safety stock should come from your own PO and sales data, not a guess.
- Review by SKU, supplier, and location. One number for the whole business can mislead you.
A simple example:
- Daily demand: 40 units
- Supplier quote: 20 days
- Quoted reorder point: 800 units
- Measured average lead time: 28 days
- Calculated reorder point: 1,252 units
That is the core point of the article: supplier quotes are a starting point, not a planning number. I’d use actual PO history, receipt dates, and sales data to set reorder points that match how inventory moves in the business.
| What to use | What it means | Why it matters |
|---|---|---|
| Quoted lead time | Supplier’s stated timing | Often leaves out part of the process |
| Actual average lead time | Mean days from PO to sellable stock | Gives a better baseline |
| Lead-time variation | How much PO timing moves | Helps set safety stock |
| Reorder point | Demand during lead time + buffer | Tells you when to reorder |
If I had to reduce the whole article to one line, it would be this: stop planning from the supplier’s promise and start planning from your own data.
Quoted vs. Actual Lead Time: The Hidden Inventory Gap
Where Quoted Lead Time Breaks Down in Real Operations
The days that go missing between PO and usable inventory
For imported goods, the gap between PO creation and sellable inventory in Shopify adds up fast.
For a U.S. brand importing finished goods, the path usually includes internal PO creation and approval (1–5 business days), supplier acknowledgment and scheduling (1–7 days), production or pick/pack (3–14+ days, though in-stock pick/pack can be 1–3 days), export prep, port handling, customs, and drayage (4–17 days combined), ocean transit (14–25 days from Asia to a U.S. West Coast port), inbound appointment scheduling at a 3PL (1–7 days during peak season), and receiving, put-away, QA, and labeling (1–13 days combined). Each step shifts based on SKU, supplier, shipping lane, and time of year.
And that’s the problem: the “lead time” on paper often skips a lot of the mess in the middle.
Seasonality adds even more drift. During Q4 or big promo windows, 3PL appointment slots get packed, production capacity leans toward larger customers, and port congestion can tack on extra days with no warning. A launch shipment by air may take 5–7 days door to door. The same SKU moved by ocean later in the year may take 25–35 days. If your plan uses one number for both, the math is already wrong.
How a single lead time number causes stockouts or overbuying
Once you count those hidden days, the inventory hit is hard to miss.
Say your hero SKU sells 100 units per day. You set your reorder point at 2,000 units based on a quoted 20-day lead time (100 × 20 days). When inventory hits that level, you place the PO. But if the shipment shows up on day 28, you’ve got 8 extra days of demand to cover, or 800 units. If you don’t have them, Shopify shows a sold-out page, ad spend keeps burning, and wholesale orders may come up short. If lead time stretches to 35 days, the shortfall jumps to 1,500 units.
The reverse problem shows up too. If a planner uses 35 days “just in case” when the real 95th-percentile lead time is 32 days, the reorder point becomes 3,500 units instead of a more defensible 3,200. That’s 300 extra units sitting in stock each cycle. At $10 per unit, that’s $3,000 tied up with no good reason. Across 8 replenishment cycles a year, that becomes $24,000. Spread that kind of padding across a larger catalog, and you can lock up hundreds of thousands of dollars in working capital.
"Static reorder points assume your supplier's lead time is constant. It never is." - Forstock
Why lead-time consistency matters more than the quoted number
The number that matters most isn’t the quote. It’s how much lead time changes from one PO to the next.
Lead-time variability matters more than the average itself. A supplier averaging 3 weeks but swinging from 2 to 6 weeks needs a lot more safety stock than one that stays close to 3 weeks. Two suppliers can post the same average lead time and still need very different reorder points if one is much less consistent.
It helps to think of lead time as a range, not a fixed number. The quote tells you the center. It doesn’t tell you the spread. And that spread is what drives how much safety stock buffer you need.
sbb-itb-f0fc809
Lead Time Variability Dashboard Excel Template | Improve Safety Stock Calculation & MRP Accuracy
The Math: Average Lead Time, Variability, Reorder Point, and Safety Stock
Once you have a lead-time range, the next step is turning it into reorder math. Your PO history fills in the gaps that a supplier quote usually skips.
How to calculate average lead time from PO history
Start with completed purchase orders and measure the actual calendar days for each one. Lead time per PO = receipt date − PO release date. Use the date when inventory becomes sellable in Shopify.
Then group the results by SKU–supplier pair or supplier–route pair and calculate the average. Here’s a plain example: if 12 POs for one supplier came in at 15, 18, 17, 16, 19, 18, 17, 20, 16, 18, 17, and 19 days, the total is 210 days. Divide 210 by 12, and the average lead time is 17.5 days. For planning, you’d round that to 18 days. Use 10–20 completed POs per SKU–supplier pair and update this every quarter.
How to measure lead-time variability
After you know the average, look at the spread. Four numbers matter here: minimum (fastest PO), maximum (slowest PO), range (max minus min), and standard deviation. Min, max, and range give you a quick snapshot. Standard deviation is what helps with planning.
Standard deviation (σ) shows how close lead times stay to the average. A supplier with a 20-day average and a standard deviation of 1.5 days is pretty steady. Another supplier might also average 20 days but have a standard deviation of 6–8 days. That second supplier carries a much higher stockout risk. On paper, both suppliers can look the same if you only track average lead time. In practice, they need very different safety stock.
Reorder point and safety stock formulas that reflect actual lead times
Use this formula:
Reorder Point = Lead-Time Demand + Safety Stock
Lead-time demand = D × LT. So if daily demand is 50 units and average lead time is 18 days, lead-time demand is 900 units. That’s your baseline. Safety stock sits above that as a buffer.
How much safety stock you need depends on how much variation you’re dealing with. Here’s the breakdown:
| Approach | Core Formula | Inputs Needed | Best Use Case |
|---|---|---|---|
| Simple days-of-cover | ROP = (D × LT) + (D × Extra Buffer Days) | Avg daily demand, avg lead time, chosen buffer days | Smaller teams, moderate variability, limited PO history |
| Lead-time variability only | SS = Z × D × σ_LT | Avg demand, lead-time std dev, service-level factor (Z) | Demand is stable; supplier timing fluctuates |
| Combined demand + lead-time variability | SS = Z × √(LT × σ_D² + D² × σ_LT²) | Avg demand, demand std dev, avg lead time, lead-time std dev, Z | Both demand and lead time vary |
The service-level factor (Z) connects safety stock to your target service level: 1.65 for 95% and 2.33 for 99%. For example, if demand is 50 units per day, lead-time standard deviation is 2 days, and you want a 95% service level, the lead-time-only formula gives you 165 units of safety stock. Add that to 900 units of lead-time demand, and your reorder point becomes 1,065 units instead of 900.
Use days-of-cover when you don’t have much history yet. Use the combined-variance formula when both demand and lead time move around and you have enough data to support it.
Next, apply these formulas to Shopify, PO, and receiving data.
Worked Examples Using Shopify, PO, and Receiving Data

Here’s how those formulas play out when you apply them to Shopify, PO, and receiving data.
Example 1: quoted 20 days vs. actual 28 days
Take a hypothetical DTC apparel brand on Shopify that sells a core T-shirt SKU. Average daily demand is 40 units. The supplier quotes 20 days, so the reorder point gets set at 800 units.
The issue shows up once you check PO history. Looking at 8 completed purchase orders - measured from PO creation date to the date inventory became available for sale in Shopify - the actual lead times were 26, 29, 28, 27, 30, 28, 28, and 29 days. That comes out to an average of 28 days, not 20.
That 8-day gap matters. The actual end-to-end lead time includes PO release, production, transit, and receiving. The supplier quote leaves out part of the picture, so the reorder point falls short.
At 800 units, the SKU runs out 8 days too soon. At 1,252 units, the reorder point lines up with measured lead time plus safety stock. Using the same safety stock method, the reorder trigger moves up to 1,252 units.
Lead time averages tell part of the story. The swing around that average is where the bigger risk sits.
Example 2: what happens when you ignore variability
Now think about a branded water bottle SKU during peak summer season. Average daily demand is 100 units. The supplier quotes 25 days, and the measured average lead time from PO history also lands at 25 days, so the team feels fine about it. The reorder point is set to 2,500 units (100 × 25).
But the average hides the problem. The last six POs arrived in 21, 24, 25, 29, 34, and 19 days. Same average, very different reality. A 19–34 day range means the SKU can behave very differently from one PO to the next.
That’s why two suppliers with the same average lead time may need very different safety stock. If one supplier swings more, the stock risk goes up. When a shipment takes 34 days instead of 25, the brand comes up short by 900 units (9 extra days × 100 units/day). At a selling price of $20 per unit, that’s $18,000 in lost sales.
The other side hurts too. If that overshoot leaves an average of 650 extra units sitting in the warehouse at a unit cost of $15, that’s $9,750 in excess inventory tying up cash with no clear return.
The answer isn’t to bump up reorder points across every SKU. It’s to add safety stock based on actual variability. Using the lead-time-only formula from the previous section, safety stock here would be 100 × σ_LT × 1.65. With a standard deviation of about 5 days, that comes out to roughly 825 units of safety stock, which brings the total reorder point to 3,325 units.
That buffer covers late arrivals without leaving stock permanently bloated.
What data to pull from your systems to run these calculations
Start by exporting PO dates, receipt dates, SKU, supplier, received quantity, and 60–90 days of sales history. Then calculate lead time as available-for-sale date minus PO creation date.
The minimum fields you need are:
- PO creation date
- PO release date
- Supplier promised date
- Actual ship date
- Warehouse receipt date
- Date available for sale (if different from receipt due to QC holds)
- Received quantity
- SKU
- Supplier name
- Sales history by SKU for the last 60–90 days
Join the data in Excel or Google Sheets with VLOOKUP or XLOOKUP on PO number, then add a calculated column for lead time. Once those fields are connected, the reorder point calculation stops being a guess and turns into a direct output.
With this setup, you can calculate average lead time, lead-time standard deviation, reorder point, and safety stock by SKU and supplier.
The table below shows what that output looks like and how it feeds straight into replenishment decisions:
| SKU / Supplier | Quoted Lead Time (days) | Actual Avg Lead Time (days) | Actual Max Lead Time (days) | Quoted Reorder Point (units) | Calculated Reorder Point (units) | Safety Stock (units) |
|---|---|---|---|---|---|---|
| T-Shirt / Supplier A | 20 | 28 | 31 | 800 | 1,252 | 132 |
| Water Bottle / Supplier B | 25 | 25 | 34 | 2,500 | 3,325 | 825 |
Use the calculated reorder point in your replenishment rules. Each row shows a different stock pattern, which is the whole point.
Build a Repeatable Replenishment Process With Measured Lead Times
Once you know your average lead time and how much it swings, the next step is simple: turn that data into a repeatable replenishment rule.
Set lead-time assumptions by SKU, supplier, and location
Using one lead time for the whole business is too blunt. Replenishment needs more detail than that.
The same SKU might take 18 days to arrive at a West Coast fulfillment center and 26 days to reach an East Coast warehouse. If you use one average for both, you wipe out that difference. And that can throw off reorder points for at least one location.
A better way is to track separate measured lead times for each SKU–supplier–location combination. That gives you planning numbers tied to how inventory actually moves through your network.
This matters even more when operations change during the year. A high-volume warehouse may move fine most of the time, then slow down during Q4 inbound surges. If your planning inputs don’t reflect that, your reorder logic can drift out of step fast.
Of course, these measured lead times aren’t something you set once and leave alone. They only help if you refresh them as supplier performance changes.
Review and update reorder points on a regular schedule
Measured lead times don’t stay accurate forever. Suppliers slip. Carriers change routes or service levels. Warehouse throughput shifts with the season. When those assumptions get old, the result is pretty predictable: overstock vs. stockouts.
A practical review cadence looks like this:
- Review volatile SKUs monthly
- Review stable SKUs quarterly
During each review, compare actual lead times against the lead times used in your reorder points. That side-by-side check tells you whether your planning numbers still match reality.
If a SKU is already running low by the time the reorder date hits, that’s a strong signal your lead-time assumption is too short.
For U.S. brands, peak season needs its own treatment. Q4 freight congestion, holiday receiving delays, and year-end warehouse slowdowns often push lead times past the annual average. In those cases, it makes more sense to use a separate peak-season lead time for those months instead of pretending the full-year average still applies. That small change can help prevent stockouts right when demand is at its highest.
Conclusion: replace supplier quotes with numbers you can measure
Measured lead times matter only when they shape reorder decisions. A supplier quote is a starting point. It is not your planning input.
The number that counts is the full end-to-end cycle: from PO creation to inventory available for sale, measured across actual purchase orders. Average lead time matters, but variation is what decides how often replenishment breaks down. When you combine lead-time demand with safety stock based on actual variance, your reorder point becomes a trigger you can trust.
Forstock centralizes Shopify sales data, supplier records, and receiving timestamps so teams can track average lead time, watch variance, and update reorder points by SKU and supplier. The aim is to replace optimistic supplier promises with numbers backed by your own data.
FAQs
What dates should I use to measure real lead time?
Use the date the purchase order is placed and the date the inventory is received, processed, and available for sale in your system.
Measure the full replenishment cycle from start to finish. That includes supplier processing, production, transit, customs clearance, receiving, quality checks, and the final stock update in your system.
And one more thing: base this on historical data from your last 10 to 20 purchase orders, not on supplier promises.
How much PO history do I need to set reorder points?
Look at the last 10 to 20 purchase orders for each supplier or SKU. That gives you your actual lead time, which often isn't the same as the supplier’s quoted number.
Measure lead time from the order date all the way to the point when inventory is received, processed, and ready for sale. Then review it every 90 days using the last 6 to 12 months of PO history so your numbers reflect shifts in freight conditions and supplier performance.
When should I update lead times and safety stock?
Review and update them at least every 90 days so they match current supplier performance, freight conditions, and sales trends. Use actual data from the last 6 to 12 months of purchase orders, measured from the day the order is placed until the product is ready to sell.
For seasonal items, increase safety stock 90 days before peak demand. If stockouts happen often or demand changes, update sooner.
Keep reading
Try Forstock free for 14 days.
AI-powered demand forecasting and reorder automation for Shopify brands. No credit card required.