How Supplier Metrics Impact Inventory Management
OTD, lead-time variability and defect rates directly affect stockouts, overstock and cash flow; track them to set better reorder points and safety stock.
How Supplier Metrics Impact Inventory Management
- Late deliveries lead to stockouts, halting production or sales.
- Inconsistent lead times force businesses to overstock, tying up cash.
- Supplier errors like defective goods or incorrect shipments disrupt operations.
By tracking key metrics like On-Time Delivery Rate (OTD), Lead Time Variability, and Defect Rate, businesses can make smarter decisions. This helps prevent stockouts, reduce excess inventory, and improve cash flow.
For example:
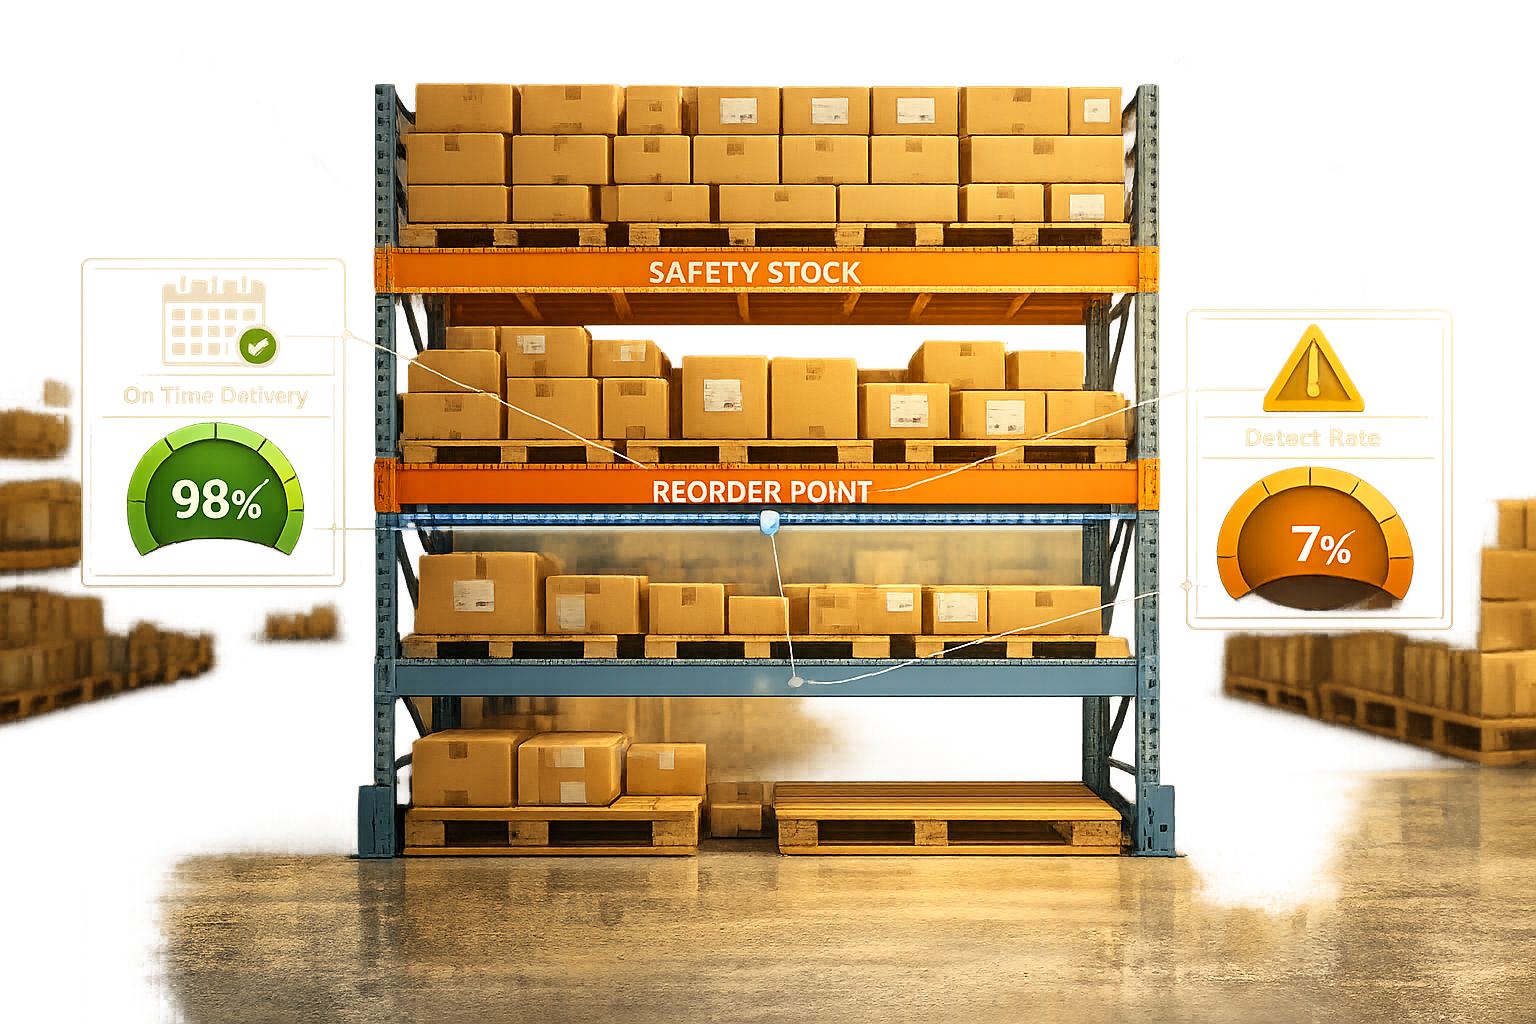
- An OTD below 85% signals immediate action is needed.
- High lead time variability forces higher safety stock, increasing costs.
- Defect rates above 2% erode margins due to returns and rework.
Tools like Forstock simplify this process, providing real-time dashboards, automated purchase orders, and AI-powered forecasting to turn supplier data into actionable inventory strategies. This ensures smoother operations and better profitability.
5 Best Metrics to Measure your Suppliers Performance
sbb-itb-f0fc809
Problems Caused by Poor Supplier Performance
When suppliers don’t deliver as promised, the ripple effects can disrupt your entire inventory system. Delays, errors, and inconsistencies lead to operational headaches and financial strain, ultimately jeopardizing your ability to meet customer expectations and maintain steady cash flow. Issues like late shipments or incorrect orders highlight why monitoring supplier performance metrics is so critical for effective inventory management.
Stockouts from Late Deliveries
When deliveries show up late, inventory levels can plummet, leading to stockouts before new orders arrive. In Just-in-Time systems, even small delays can halt production, forcing businesses to pay for expedited shipping or overtime labor to catch up. As the Planster Team puts it:
Every day you wait is a day closer to stockout. Start working the problem as soon as you learn about a delay.
The financial stakes are high - supply chain disruptions can slash up to 62% of a company’s profits. In fact, 87% of procurement professionals rank managing supplier risk as their top priority. To avoid stockouts, it’s crucial to assess inventory levels and communicate with teams as soon as delays occur.
Overstock from Inconsistent Lead Times
Unpredictable delivery schedules create a tough choice: order too little and risk stockouts, or over-order and tie up cash in excess inventory. Many businesses respond by increasing safety stock, but this approach can stifle growth by locking up funds that could be better used elsewhere. Delivery variability is a widespread issue - 67% of businesses sourcing from China report unpredictable lead times, compared to 56% of those sourcing domestically. As Netstock explains:
Delivery variability can cause uncertainty, adding risk to the supply chain. Businesses that battle inconsistent deliveries need bigger buffers.
When lead times fluctuate wildly, businesses may resort to costly air freight to meet deadlines. Quality issues can compound the problem, as returns often cost 2–3 times the original product value due to added expenses like shipping, labor, and customer service. Calculating safety stock using the coefficient of variation can help account for delivery inconsistencies.
Operational Problems from Supplier Errors
Supplier mistakes - like shipping the wrong SKUs, delivering defective goods, or sending incomplete orders - can wreak havoc on operations. These errors lead to inventory imbalances, such as too much of what you don’t need and not enough of what your customers demand. Milind Tailor, Global Head of Procurement at Diebold Nixdorf, shared a stark example in April 2025: a single missing component halted an entire electronics production line, causing immediate financial losses and missed deadlines. The fallout affected procurement, logistics, and customer service, making the issue even worse.
Defective products are another costly problem. For example, a direct-to-consumer brand generating $3 million in revenue discovered that a trusted supplier had an 8.3% defect rate - far above the 2% standard - leading to high return rates and eroded profit margins. Poor supplier data compounds these challenges, costing businesses an average of $15 million annually, with 97% of organizations struggling to track supply chain metrics effectively.
| Error Type | Impact on Inventory | Impact on Cash Flow |
|---|---|---|
| Incorrect SKUs | Overstock of wrong items; stockouts of needed items | Capital tied up in non-moving stock |
| Defective Goods | Reduced sellable inventory; production delays | Costs for rework, returns, and replacements |
| Incomplete Shipments | Lower fill rates; disrupted fulfillment schedules | Increased administrative and rush shipping fees |
| Poor Communication | Inaccurate forecasting; reliance on gut feel | Excess safety stock to mitigate risk |
Robust receiving inspections that document defects can save businesses thousands in downstream costs. Additionally, tracking order accuracy and calculating the total cost of ownership - including factors like shipping, quality failures, and administrative overhead - are essential to reducing the operational impact of supplier errors.
Key Supplier Metrics for Better Inventory Management
Key Supplier Metrics and Performance Thresholds for Inventory Management
Addressing supplier challenges starts with tracking the right metrics. Once you've identified the issues poor supplier performance can cause, the next step is focusing on data that matters. By monitoring key metrics, you can turn supplier performance into actionable insights. Below are three critical metrics that lay the groundwork for effective inventory planning.
On-Time Delivery Rate
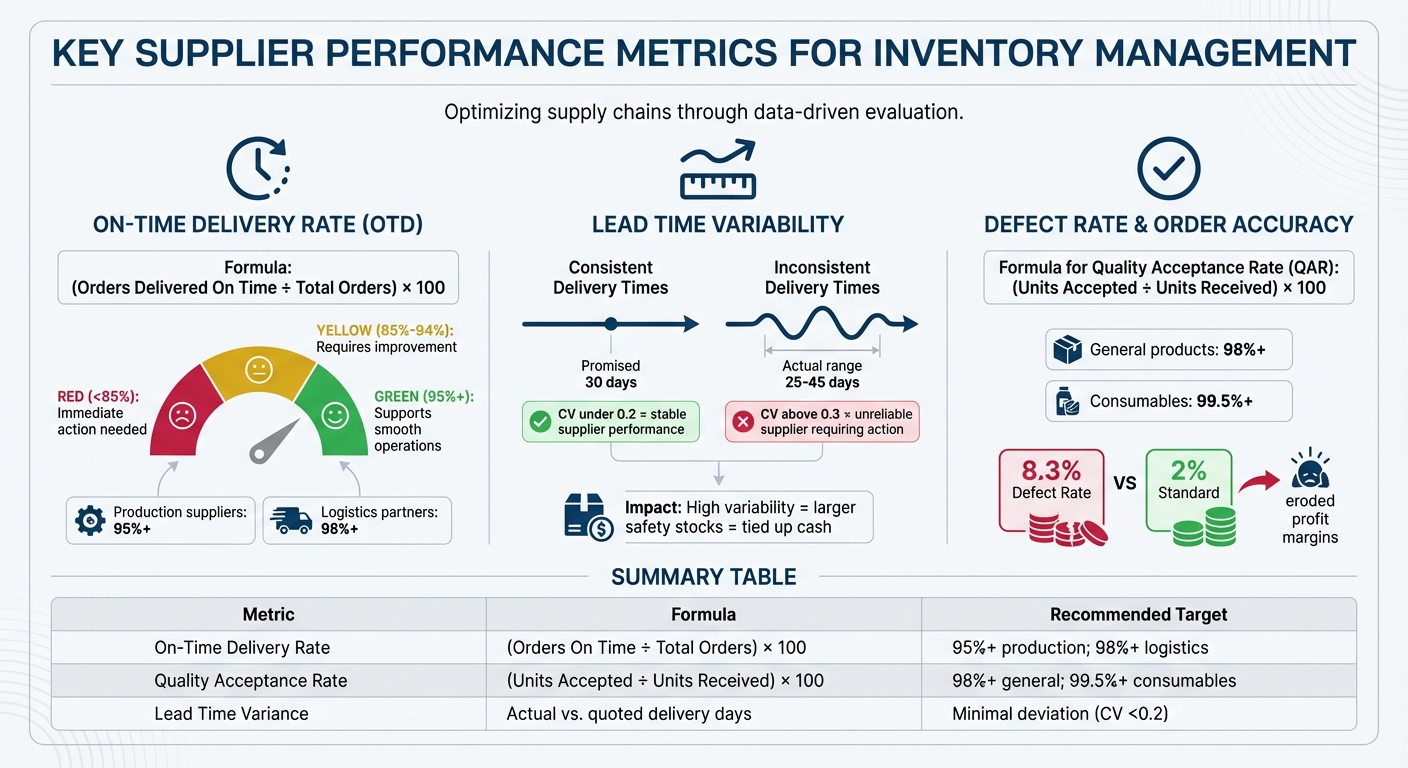
On-Time Delivery Rate (OTD) measures how often suppliers meet their promised delivery dates. The formula is straightforward: (Orders Delivered On Time ÷ Total Orders) × 100. A high OTD ensures your shelves stay stocked and production lines run without delays. For production suppliers, aim for an OTD of 95% or higher, and for logistics partners, set the bar at 98% or higher. Falling below 85% can lead to stockouts and expensive emergency reorders. Here's a quick breakdown:
- Below 85%: Immediate action needed to avoid disruptions.
- 85%-94%: Requires improvement efforts.
- 95%+: Supports smooth growth and operations.
Tracking OTD accurately helps you fine-tune inventory thresholds and avoid unnecessary risks.
Lead Time Variability
Lead time variability measures how consistent a supplier is with delivery times. For instance, if a supplier promises 30 days but delivers anywhere from 25 to 45 days, it creates planning headaches. Instead of relying on an average lead time, monitor it as a range. High variability forces you to maintain larger safety stocks, tying up cash that could be better used elsewhere. On the other hand, suppliers with consistent lead times allow you to operate more efficiently and cut down on carrying costs. Keeping a close eye on lead time variability directly improves reorder point accuracy and minimizes waste.
Defect Rate and Order Accuracy
Supplier errors can wreak havoc on operations, making quality metrics essential. Defect rate measures the percentage of products that fail to meet standards, while order accuracy tracks whether you received the correct SKUs and quantities. For quality, calculate the Quality Acceptance Rate (QAR) using (Units Accepted ÷ Units Received) × 100. Suggested targets are 98% or higher for general products and 99.5% or higher for consumables.
The consequences of poor quality can be severe. For example, in 2007, Mattel had to recall 18 million toys due to issues like lead paint and unsafe magnets from subcontractors. This incident resulted in $30 million in direct costs, a plummet in stock value, and a complete overhaul of supplier relationships. Order errors, meanwhile, can lead to emergency reorders and operational delays. By tracking and addressing these issues, you can prevent inventory imbalances and avoid costly disruptions.
| Metric | Formula | Recommended Target |
|---|---|---|
| On-Time Delivery Rate | (Orders Delivered On Time ÷ Total Orders) × 100 | 95%+ for production; 98%+ for logistics |
| Quality Acceptance Rate | (Units Accepted ÷ Units Received) × 100 | 98%+ general; 99.5%+ consumables |
| Lead Time Variance | Actual delivery days vs. quoted delivery days | Minimal deviation |
How to Use Supplier Metrics to Prevent Stockouts and Overstock
Supplier metrics are only useful if they lead to actionable inventory adjustments. By incorporating performance metrics into your inventory management, you can sidestep stockouts and avoid locking up cash in excess inventory. Here's how to turn these insights into effective inventory strategies.
Setting Performance Thresholds for Auto-Reorders
Automated reorder systems can leverage On-Time Delivery (OTD) rates to fine-tune reorder points. For instance, if a supplier's OTD rate falls below a set threshold, the system can automatically increase safety stock to cover potential delays.
One way to structure this is by creating three performance tiers:
- Green (OTD ≥95%): Maintain normal reorder points.
- Yellow (85–94% OTD): Increase safety stock and implement a 90-day improvement plan.
- Red (<85% OTD): Activate backup sourcing and take corrective action within 30 days.
Industries with tight synchronization, like automotive, often demand OTD rates as high as 98–99%, with delivery windows as precise as ±2 hours.
"Netstock has provided us with increased visibility and flexibility in decision-making. Our relationships with suppliers have significantly improved with clearer anticipated orders."
Real-time OTD tracking transforms inventory management from reactive to proactive. Additionally, using lead time data to refine safety stock levels can further optimize inventory control.
Adjusting Safety Stock Based on Lead Time Data
Variability in lead times often disrupts inventory more than the lead times themselves. When delivery times fluctuate, businesses are forced to maintain higher safety stock. A useful metric here is the coefficient of variation (CV), calculated as (Standard Deviation of Lead Time ÷ Average Lead Time). A CV under 0.2 suggests stable supplier performance.
Analyze a year's worth of purchase orders, focusing on high-spend suppliers with CVs above 0.3. Once unreliable suppliers are identified, conduct root-cause analyses to pinpoint issues like order processing delays, production bottlenecks, or customs slowdowns.
AI tools can model lead time patterns based on historical data and real-time logistics, helping predict future delays. These insights, combined with OTD adjustments, allow businesses to recalibrate safety stock through their ERP systems. Locking improved lead-time targets into Service Level Agreements ensures leaner operations and frees up working capital.
Using Supplier Audits and Scorecards
Supplier audits and scorecards replace assumptions with hard data. For example, a supplier perceived as reliable might actually have an OTD rate of just 62%. Misjudging supplier performance can lead to costly stockouts or excess inventory.
"Your supplier relationship is probably built on vibes... Feelings aren't data. And in DTC, where margins are tight and cash is king, you can't afford to manage suppliers by gut feeling."
- Lara, Move Supply Chain
Scorecards help pinpoint whether stockouts are due to planning errors, execution issues, or supplier performance. They also reveal the total cost of working with a supplier, including expedited shipping, returns, and lost sales - not just the price per unit. Poor supplier data can cost businesses an average of $15 million annually, making regular audits a critical practice.
To manage risk, evaluate critical suppliers monthly or quarterly, while standard suppliers can be reviewed annually. Involving suppliers in setting KPI targets ensures clarity and accountability. When suppliers see performance data and understand your expectations, they can plan more effectively and meet commitments more reliably.
"By having insights into our future orders, our suppliers have been able to plan better, so it's a win-win solution all around."
- Lauren Winn, Purchasing Manager, Bluesky Solutions
How Forstock Tracks Supplier Metrics and Controls Inventory
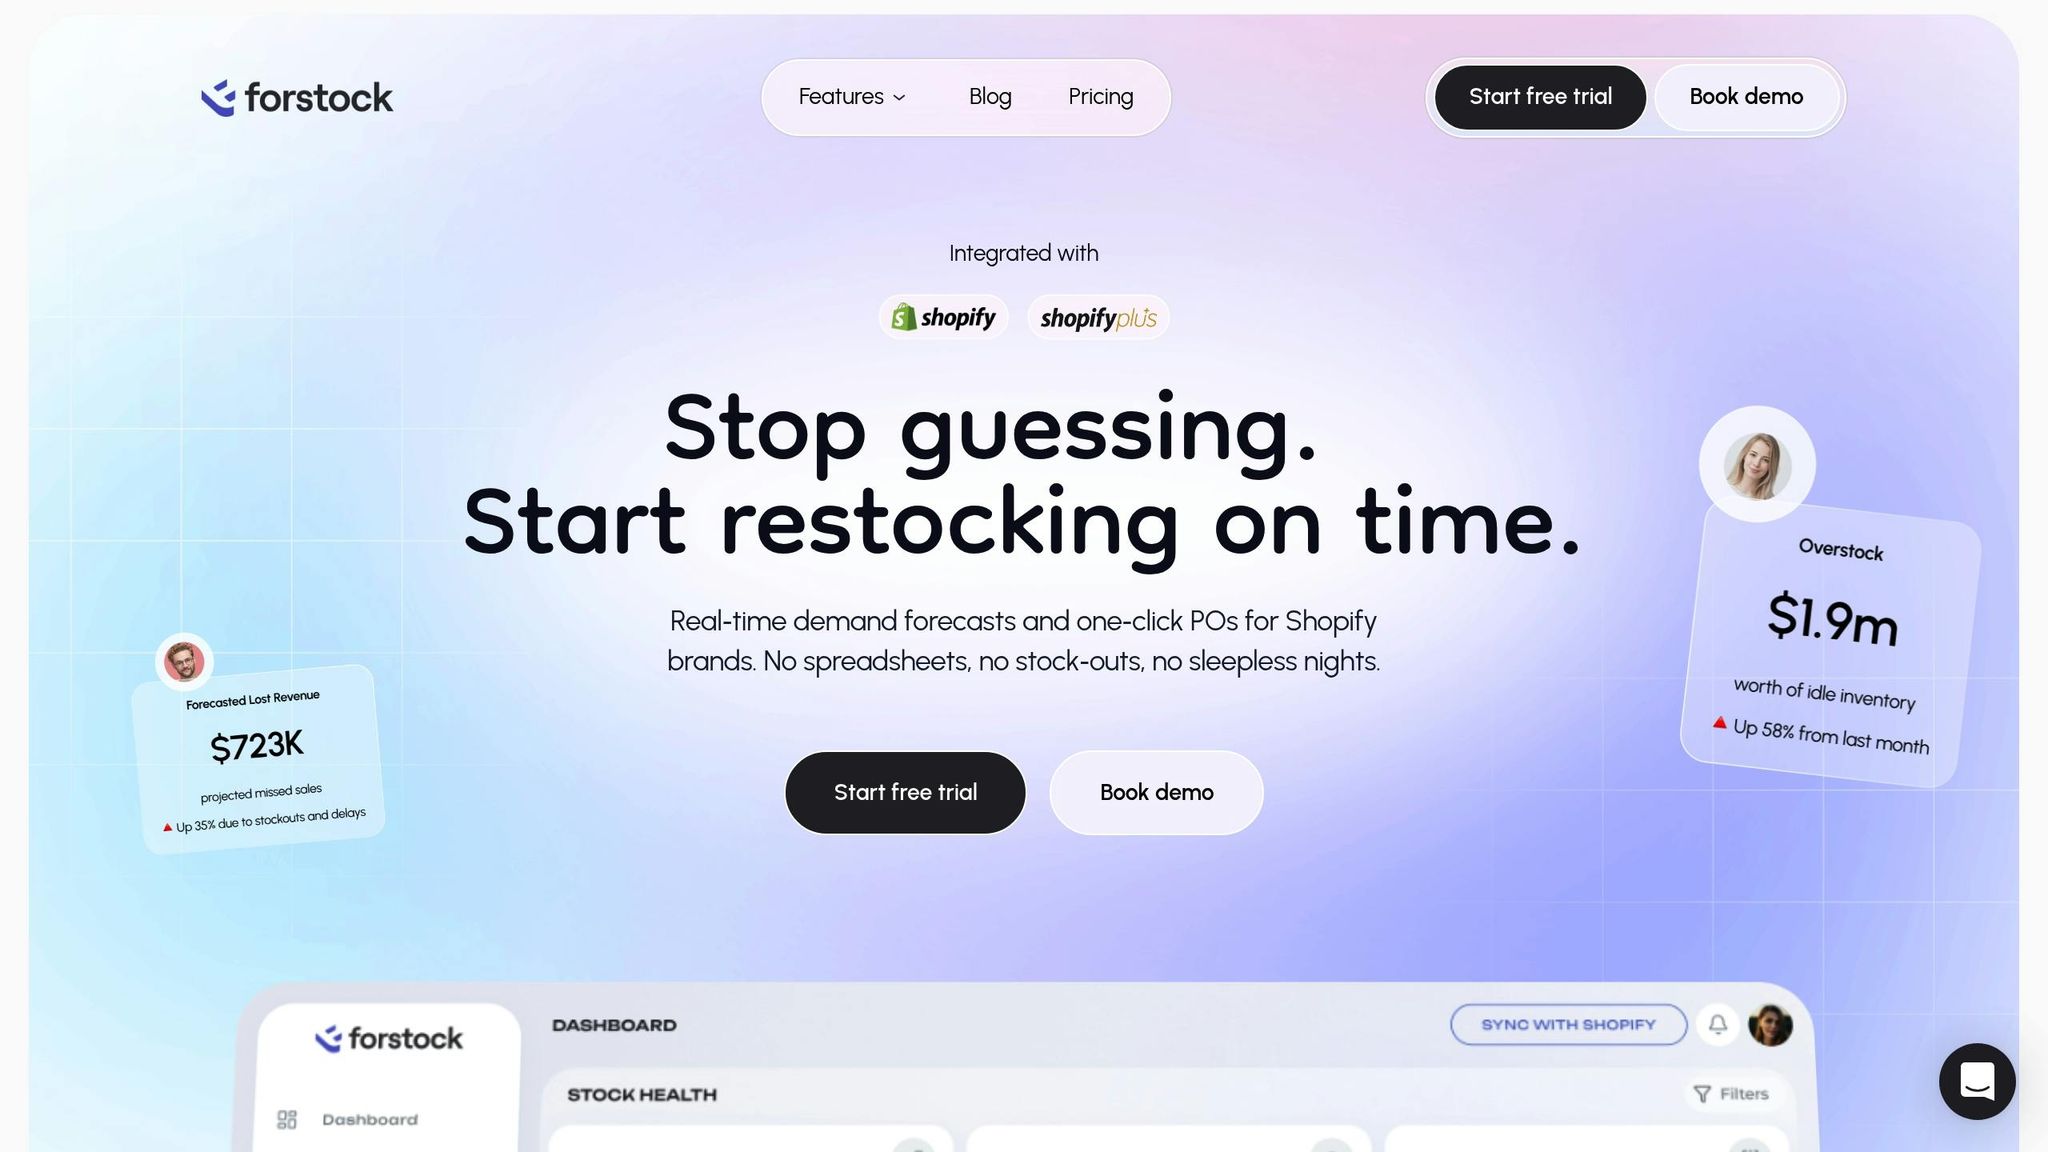
Managing supplier performance for Shopify brands can feel overwhelming - juggling endless spreadsheets or reacting to problems only after they snowball. Forstock simplifies this process by seamlessly integrating supplier metrics into inventory management. This gives merchants a clear, proactive way to avoid stockouts and overstock situations. By tackling supplier challenges head-on, Forstock turns key metrics into actionable insights that improve inventory control.
Real-Time Metric Dashboards
Forstock’s dashboard pulls together supplier performance data and inventory levels into one unified view. No more switching between systems or hunting for information. Merchants can track critical metrics like On-Time Delivery (OTD) rates, lead time consistency, and order accuracy all in one place. This setup makes it easier to spot potential issues early - whether it’s adjusting safety stock levels or activating backup suppliers - before customers notice empty shelves.
Here’s the kicker: poor supplier data costs businesses an average of $15 million annually. By using real-time dashboards, decisions are based on hard data, not guesswork. These dashboards don’t just provide visibility - they also connect to automated systems, making processes even smoother.
Automated Purchase Order Creation
Forstock takes the hassle out of purchase orders by automating the process. It uses demand forecasts, current stock levels, and actual supplier performance data - not just promised lead times - to generate orders. If a supplier’s lead times become less predictable, the system automatically adjusts reorder points to include buffer stock. For more reliable suppliers, leaner safety stock levels are maintained, freeing up cash that would otherwise be tied up in excess inventory.
This automation removes the guesswork from ordering and ensures that decisions are grounded in reliable data like lead time accuracy and order fill rates.
"By having insights into our future orders, our suppliers have been able to plan better, so it's a win-win solution all around."
- Lauren Winn, Purchasing Manager, Bluesky Solutions
AI-Powered Demand Forecasting
Forstock’s AI-powered forecasting takes inventory management to the next level by adapting to changes in supplier performance and market trends. It incorporates key supplier metrics - like delivery consistency and lead time variability - into its predictions, ensuring inventory strategies stay sharp. For example, if a supplier’s delivery windows start to fluctuate, the system pre-adjusts reorder points automatically to avoid disruptions.
This AI-driven approach also accounts for sales trends, seasonality, and proven supplier performance, creating forecasts that reflect what’s happening now - not outdated assumptions. By reducing the need for excessive "just in case" inventory padding, merchants can improve cash flow without sacrificing service levels. Considering 72% of small and mid-sized businesses struggle with unpredictable delivery times, this technology transforms supplier metrics into practical strategies for smoother inventory management.
Conclusion
Incorporating supplier metrics into inventory management can make a world of difference. By keeping an eye on critical indicators like on-time delivery rates, lead time variability, and order accuracy, businesses can gain the clarity they need to avoid stockouts and cut down on surplus inventory.
Using these metrics to fine-tune safety stock levels and reorder points - while holding suppliers accountable - helps reduce excess inventory and lower carrying costs, which often account for 15%–20% of inventory value.
For Shopify brands, tools like Forstock bring all these capabilities together in one place. With real-time dashboards, automated purchase orders, and AI-driven forecasting, Forstock turns raw supplier data into actionable insights. This eliminates the hassle of manual spreadsheet management, giving businesses more time to focus on growth. Its unified platform ensures every metric is put to work for smarter inventory decisions.
FAQs
Which supplier metrics should I track first?
To keep your inventory management and supply chain running smoothly, it’s crucial to focus on supplier metrics that matter most. Start with the on-time delivery rate - this ensures your shipments arrive when you need them, avoiding disruptions. Next, keep an eye on the quality defect rate to maintain product standards and reduce returns or rework.
Another critical metric is lead times, which can help you spot potential delays before they impact your operations. Don’t overlook price changes, as they directly affect your costs, and monitor supplier responsiveness to ensure quick and effective communication. Together, these metrics help you forecast demand more accurately, minimize stockouts, and keep your inventory under control.
How do I set safety stock using lead time variability?
To determine safety stock when lead time varies, you need to account for both changes in demand and lead time. A widely used formula is:
Safety Stock = (Max Daily Sales × Max Lead Time) − (Avg Daily Sales × Avg Lead Time).
For a more accurate calculation, you can incorporate statistical techniques, such as using standard deviation or Z-scores, to better capture variability. Reviewing historical data is crucial, and leveraging inventory management tools can automate the process, ensuring your safety stock adjusts dynamically to changing conditions.
When should I switch to a backup supplier?
If your current supplier is falling short - whether it's due to repeated late deliveries, inconsistent lead times, or ongoing quality problems - it might be time to consider a backup supplier. Other red flags include sudden price increases without discussion or a lack of responsiveness to your needs.
To stay ahead, keep a close eye on supplier performance metrics. For items that are critical to your operations, especially high-risk SKUs, having a backup supplier in place can be a game-changer. This approach helps you sidestep stockouts and keeps your supply chain steady, even during unexpected disruptions like natural disasters or supplier issues.
Keep reading
Try Forstock free for 14 days.
AI-powered demand forecasting and reorder automation for Shopify brands. No credit card required.