How to Plan Inventory for Seasonal Demand
Seasonal demand requires SKU-level forecasts, season-adjusted safety stock, timed purchases, and supplier coordination to prevent stockouts.

How to Plan Inventory for Seasonal Demand
Seasonal demand can make or break your inventory strategy. Whether it’s holiday shopping, back-to-school, or summer spikes, failing to prepare for these predictable sales surges can lead to costly stockouts or excess inventory. Here’s what you need to know to stay ahead:
- Stockouts cost North American retailers over $300 billion annually. Overestimating demand ties up cash, while underestimating it means lost sales.
- Yearly averages are misleading. Seasonal peaks can quadruple sales compared to regular periods, so planning by averages often results in understocking.
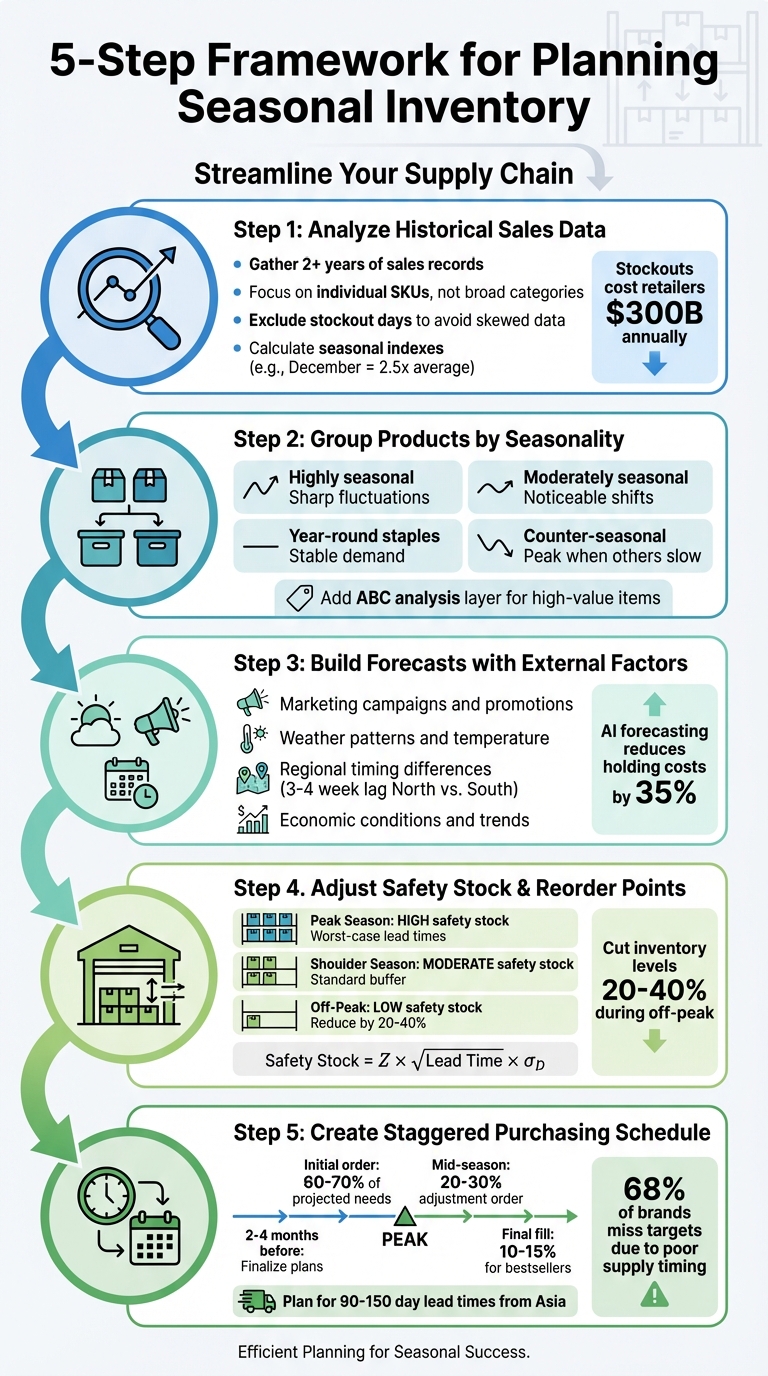
- Historical sales data is key. Analyze at least two years of sales records to identify trends, focusing on individual SKUs rather than broad categories.
- Group products by seasonality. Classify items into highly seasonal, moderately seasonal, year-round staples, or counter-seasonal categories for better resource allocation.
- Adjust safety stock and reorder points by season. Use higher thresholds during peak demand and reduce them during slower periods to control costs.
- Plan purchases early. Work backward from peak sales dates and account for supplier lead times, which often stretch during busy seasons.
- Incorporate external factors. Weather, marketing campaigns, and regional differences can significantly influence demand.
5-Step Seasonal Inventory Planning Framework for Retailers
Shopify Inventory Management: Dominate Peak Season With These Proven Strategies!

sbb-itb-f0fc809
Analyze Historical Sales Data to Find Patterns
Historical sales data can be a goldmine for identifying seasonal inventory needs. To get meaningful insights, gather at least two years of sales records. Structure this data into monthly or four-week intervals to uncover long-term trends, while also analyzing week-over-week data for holiday-related sales spikes.
Focus on individual SKUs rather than broad categories. Seasonality often impacts specific items differently. For instance, a clothing retailer using StockPerfect in February 2025 discovered multi-level seasonality in their cotton sweater sales. The data revealed sales were nearly four times higher in fall and winter compared to spring, with an additional 50% boost during back-to-school season and a threefold spike during promotions. Interestingly, Southern stores experienced peak sales 3–4 weeks later than their Northern counterparts.
To ensure accuracy, exclude or flag days when items were out of stock, as these can skew demand estimates. Tracking sales velocity (units sold per day) during peak periods can also provide valuable insight into inventory turnover metrics.
Once initial trends are identified, compare them year-over-year to confirm consistency.
Compare Year-Over-Year Trends
Expanding on your initial findings, analyze multiple years of data to validate recurring seasonal patterns. Use seasonal indexes to quantify deviations from the average. For example, if December sales are typically 250% of the monthly average, the seasonal index for December would be 2.5. Avoid relying on annual averages, as they can mask seasonal spikes, leading to understocking during busy times. Instead, focus on specific months - like November and December - and validate trends across different sales channels. Keep in mind that platforms like Amazon might experience seasonal surges earlier than direct-to-consumer websites.
These patterns are essential for setting accurate safety stock levels and reorder points.
Use Charts and Graphs to Visualize Data
Visual tools can make your findings clearer and help guide inventory decisions. Different charts serve different purposes:
- Line charts are ideal for tracking trends over time, highlighting seasonal peaks and dips. Plot multi-year sales data for each product and adjust the scale (daily, weekly, monthly) to reduce noise and emphasize key trends.
- Heat maps use color intensity to pinpoint the days or times of year with the highest order volumes.
- Bar charts are great for comparing sales across product categories or time blocks, such as different holiday seasons.
- Scatter plots can reveal how external factors, like weather or marketing campaigns, influence seasonal sales.
Here’s a quick reference for choosing the right visualization:
| Visualization Type | Best For | What It Shows |
|---|---|---|
| Line Chart | Tracking trends over multiple years | Seasonal peaks and troughs |
| Bar Chart | Comparing products or time periods | Which items dominate specific seasons |
| Heat Map | Spotting regional or time-based demand | High-volume periods at a glance |
| Scatter Plot | Analyzing external factor impact | Whether promotions drove higher sales volume |
Using these visual tools can make seasonal patterns and external influences much easier to interpret, allowing for smarter inventory planning.
Group Products by Seasonal Impact
Once you've identified seasonal trends, the next step is to group products based on how much seasonality affects them. Not every item experiences the same highs and lows, so applying a one-size-fits-all strategy can lead to stockouts or overstock issues.
Break your catalog into four main groups:
- Highly seasonal products: These experience sharp fluctuations, like swimwear or holiday decorations.
- Moderately seasonal items: These show noticeable shifts but maintain some baseline sales, like sweaters.
- Year-round staples: These have stable demand throughout the year, such as plain t-shirts.
- Counter-seasonal products: These peak when other items slow down, like indoor fitness gear during the winter.
This segmentation helps you allocate resources wisely and avoids the pitfalls of relying on annual averages, which can mask extreme peaks and dips.
To refine this further, layer an ABC analysis on top of your seasonal groupings. "A" items are your high-value, high-profit products that need the most attention during peak times. "B" items sit in the middle, while "C" items are lower-value or lower-priority products requiring less oversight. Focusing on "A" items during seasonal surges ensures your efforts are directed where they matter most. This approach also sets the stage for determining seasonal safety stock and reorder points later on.
Keep in mind that seasonality often impacts specific SKUs, colors, or sizes rather than entire product categories. For instance, a red winter coat might see a sales spike in November, while the beige version sells steadily year-round.
Identify Top-Selling Seasonal Products
Historical sales data is key to spotting recurring seasonal patterns. Aim to gather at least two to three years of records to separate true trends from one-off anomalies. For example, if a product doubles its sales every December over several years, that's a reliable trend. On the other hand, a spike caused by a viral moment or celebrity endorsement is less dependable for planning.
Use seasonal indexes to measure how much a product's demand deviates from its average. If December sales for a product are 250% of its monthly average, the seasonal index is 2.5. These indexes can guide purchasing decisions. Items with indexes above 2.0 during peak months should be prioritized for early supplier communication and boosted safety stock.
Different types of seasonality require different approaches:
- Volume-based seasonality: Changes in sales velocity during certain periods.
- Timing-based seasonality: Products with narrow peak windows, like Halloween costumes in September and October.
- SKU-level seasonality: Specific sizes, colors, or styles that see spikes.
Understanding these nuances allows you to fine-tune your purchasing and inventory strategies.
Sort Products by Demand Predictability
Seasonal products don't all behave the same way every year. Some follow consistent, predictable patterns, while others are influenced by less reliable factors like weather or changing consumer preferences. For products with stable multi-year trends, rely on quantitative forecasting (data-driven models). For newer or less predictable items, consider qualitative forecasting (expert opinions or market insights). For instance, classic holiday decorations tend to have steady seasonal patterns, while trendy seasonal apparel might require a more flexible approach.
To measure how strongly a product follows seasonal patterns, calculate its seasonal strength (Fs). If Fs is 0.6 or higher, the product has strong seasonality and benefits from tailored forecasting. If Fs is below 0.3, seasonality is weak, and general inventory methods may suffice.
It's also crucial to distinguish between seasonality and cyclicality. Seasonality refers to predictable, calendar-based patterns like back-to-school shopping in August. Cyclicality, on the other hand, involves broader, less predictable economic factors like recessions or global events. Products affected by cyclicality need a different planning approach than those driven by clear seasonal trends.
For predictable seasonal items, consider purchasing 60-70% of your projected stock early and reserving 20-30% for mid-season replenishment. By classifying products based on both their seasonal impact and predictability, you can develop a more precise purchasing strategy.
Build Forecasts That Include External Factors
Historical data provides a solid starting point, but forecasts become much more accurate when you account for external factors like marketing campaigns, economic changes, and weather. These elements can significantly impact demand. For instance, some retailers, such as gift shops, have seen demand surge by as much as 300% during seasonal peaks. Begin with a statistical projection based on past sales, then adjust for these external influences to refine your predictions.
Using causal models, like linear regression, you can measure how variables like consumer confidence, inflation, or local events influence sales patterns. This approach uncovers trends that historical data alone might miss. Incorporating such external factors into AI-driven forecasting has been shown to lower inventory holding costs by 35% and logistics expenses by 15%.
In addition to numerical data, qualitative insights - often referred to as "demand sensing" - can be invaluable. This involves consulting experts and tracking real-time trends, such as viral TikTok challenges or competitor flash sales, which are often unpredictable. With nearly 90% of companies facing supply chain disruptions in 2024, creating scenario plans with best-case and worst-case forecasts can help you navigate uncertainty more effectively.
It's also important to adjust forecasts for targeted marketing efforts and weather-driven demand shifts.
Factor in Marketing Campaigns
Marketing campaigns don’t just boost sales - they can also change when customers make purchases. A holiday email blast or an influencer partnership might pull future sales into the present, creating temporary spikes. To avoid mistaking these shifts for lasting trends, align your inventory planning with your promotional calendar from the start.
Look at historical data to understand how past campaigns have affected sales velocity and duration. For example, if a Black Friday deal typically doubles sales for a product, include that multiplier in your forecast and adjust your safety stock accordingly. The discount level also matters; a 30% off promotion will likely generate more demand than a 10% off sale. Coordinating with suppliers early ensures they can handle the increased order volumes tied to these campaigns.
While marketing strategies can shift purchase timing, weather patterns and regional differences offer additional layers of insight.
Consider Weather and Regional Differences
Weather is a major driver of demand, particularly for products like clothing, beverages, outdoor gear, and HVAC equipment. For example, a swimwear retailer might see 60% of its annual sales during the summer, with an unusually warm spring pushing demand earlier. Similarly, cold drinks often sell twice as much in summer compared to winter, and heat waves can cause immediate spikes in beverage purchases.
Regional timing adds another layer of complexity. In southern states, peak demand for winter apparel typically occurs 3–4 weeks later than in northern states. Adjusting purchasing schedules to reflect these regional variations can prevent overstock or shortages. Instead of relying on national averages, set location-specific safety stock levels. A warehouse in Minnesota, for instance, will likely need more winter coats than one in Georgia. For weather-sensitive products, integrating real-time weather data through APIs can help you fine-tune forecasts to account for sudden climate changes.
| Weather Factor | Impact on Demand | Example Products |
|---|---|---|
| Temperature | High sensitivity; shifts seasons | Sweaters, HVAC units, ice cream, cold/flu medicine |
| Precipitation | Immediate, localized spikes | Umbrellas, rain boots, indoor entertainment |
| Regional Timing | 3–4 week lag North vs. South | Winter apparel, gardening supplies |
| Extreme Events | Sudden, high-volume surges | Hurricane prep kits, snow shovels, generators |
Set Safety Stock and Reorder Points That Adjust by Season
Once you've analyzed seasonal demand patterns, it's time to fine-tune your safety stock and reorder points to align with peak, shoulder, and off-peak periods. Sticking to the same safety stock and reorder point settings all year can lead to expensive stockouts during busy times or excess inventory during slower periods. The better approach? Calculate separate values for each season - higher thresholds for peak demand and lower ones for quieter times.
Here’s the formula for calculating safety stock: Z × √Lead Time × σD. In this equation, Z represents the service level (1.65 for 95% service), Lead Time is the supplier's delivery time, and σD is the standard deviation of daily demand. Add this to your lead time demand (Average Daily Demand × Lead Time) to determine your reorder point. The trick is to run these calculations individually for each season instead of relying on a single, static number.
By adopting a dual-season approach, you could cut your average inventory levels by 20% to 40% during off-peak periods. That’s a big deal when you consider that inventory holding costs typically consume 20% to 30% of your total inventory value annually. The trade-off? You’ll need to segment historical data and set reminders to adjust these settings before seasonal shifts occur.
Adjust Safety Stock for Different Seasons
Safety stock isn’t one-size-fits-all - it should flex depending on demand volatility and supplier reliability. For example, during peak seasons, demand can spike unpredictably, and suppliers might struggle to keep up, making higher buffers essential. In contrast, during off-peak periods, you can afford to minimize safety stock to save on holding costs.
| Season Type | Demand Volatility | Safety Stock Level | Primary Goal | Typical Adjustment |
|---|---|---|---|---|
| Peak | High | High | Prevent stockouts during critical sales windows | Use worst-case lead times to set a higher buffer |
| Shoulder | Moderate | Moderate | Manage transitions smoothly | Standard calculations with a slight buffer |
| Off-Peak | Low | Low | Minimize holding costs and free up cash flow | Reduce buffer by 20-40% |
For seasonal businesses, aim to keep a minimum inventory reserve of about 70% of your maximum busy-season inventory to handle unexpected demand spikes. This baseline ensures you’re not scrambling if demand outpaces your forecasts. Using AI inventory forecasting can further refine these buffers by identifying patterns humans might miss.
Once you've tailored safety stock for each season, the next step is adjusting for supplier lead times, which can vary significantly throughout the year.
Track Supplier Lead Times
Supplier lead times are rarely consistent. They often stretch during peak seasons when suppliers are overwhelmed with orders. If you rely on "average" annual lead times for your calculations during busy periods, you risk stockouts because actual delivery times might exceed your buffer. For instance, a supplier with a typical 10-day lead time might extend to 14 days in November, throwing your reorder point off completely.
To avoid this, factor in extended lead times during peak seasons. Start planning your seasonal inventory at least one full supplier lead-time cycle before demand picks up - typically two to four months ahead. A staggered ordering strategy can help: secure 60–70% of your projected needs early and adjust with 20–30% mid-season based on actual demand. This approach gives you flexibility to manage unexpected shifts while ensuring your inventory arrives before supplier capacity tightens.
"Product lead time accuracy was crucial for keeping our shelves well stocked." - Sylvia Fountaine, Owner and Founder, Feasting at Home
To further safeguard your inventory, negotiate with suppliers to reserve production capacity during peak periods. You can also arrange for partial shipments to spread out arrivals. This strategy helps prevent cash flow issues from receiving everything at once and reduces the risk of stockouts caused by delayed deliveries.
Create a Seasonal Purchasing Schedule
Once you've refined your safety stock and reorder points, it's time to build a purchasing schedule that matches seasonal demand. A staggered approach works best, ensuring inventory arrives before demand surges without tying up all your capital at once. Start by working backward from your peak sales date, mapping out every step of your supply chain - from production and shipping to customs and warehouse delivery.
Plan ahead - ideally 2–4 months before the season begins - to account for potential delays in production or shipping. For example, sourcing from Asia to the U.S. typically takes anywhere from 63 to 118 days, with a median of 90 days. This explains why 68% of CPG brands miss revenue targets, not because they misjudge demand, but due to poor timing on the supply side.
"Most brands fail at demand planning not because they can't forecast demand, but because they ignore the supply-side constraints until it's too late." - Bindiya Vakil, CEO, Resilinc
To manage seasonal inventory effectively, split your orders into three phases:
- Initial purchase: Covering 60–70% of your projected needs.
- Mid-season replenishment: Adjusting with 20–30% based on early sales performance.
- Final fill-in: Topping off with 10–15% for bestsellers.
This tiered strategy minimizes the risk of overstocking if trends shift and avoids locking up cash in slow-moving items. For a Q4 peak, your schedule might look like this: finalize plans in March, place initial orders in April–May for fall delivery, complete remaining orders by June for winter delivery, and monitor production and shipping from July through September. This timeline ensures your products arrive before the demand window opens, not after it closes.
Time Purchases to Match Demand Peaks
A staggered schedule is just the beginning. The key is to time your orders so they arrive right before demand peaks. This prevents excess holding costs and avoids stockouts. To calculate lead time demand, multiply your average lead time (in days) by your average daily sales, then add seasonal safety stock to determine reorder points.
However, relying solely on average lead times can be risky. Suppliers often face capacity crunches during peak seasons. To avoid running short, plan for worst-case lead times instead of averages. For instance, if your supplier usually delivers in 30 days but stretches to 45 days in October, planning around the 30-day average could leave you short of inventory when you need it most.
Every step in the process matters: sourcing materials, production, quality checks, transit, freight, customs clearance, and warehouse delivery. During peak seasons, add a 15–30 day buffer to account for congestion. Also, keep track of supplier-specific holidays, like Lunar New Year, which can halt production for weeks. Confirm reorder cut-off dates with your suppliers well in advance to ensure they can meet your schedule.
"One way I manage seasonal inventory is by offering presales. It allows me to have cash flow before investing in the inventory and shows me what the customers are most eager to purchase." - Meredith Dew, Owner, Wild Melon
Communicate Early with Suppliers on Seasonal Orders
Share your seasonal demand forecasts with suppliers as early as possible - ideally 90–150 days before your peak season. This gives them time to plan their raw materials and labor needs. Early communication ensures they can reserve production capacity for your orders, reducing the risk of delays caused by overbooked schedules.
Negotiate with suppliers to secure production slots during their busiest periods, even if you haven’t finalized your purchase orders yet. Reserved capacity acts as a safety net, ensuring your orders aren’t pushed back. You can also arrange partial shipments to stagger arrivals and ease cash flow pressures.
"Knowing which products sell out right away versus sit on our shelves for months until Christmas is important, so we can not only have adequate and appropriate inventory, but are able to order ahead so artisans have time to produce inventory." - Sylvia Fountaine, Owner and Founder, Feasting at Home
Additionally, negotiate seasonal payment terms that align with your cash flow. Instead of standard Net 30 terms, aim for Net 60 or Net 90, timed to when your inventory starts converting into sales. For businesses where Q4 accounts for 40% to 50% of annual sales, this kind of flexibility can make a big difference in managing working capital effectively.
Use Forstock for AI-Powered Forecasting and Automation
Forstock takes your purchasing schedule to the next level by automating and streamlining forecasting and ordering. Seasonal demand can be unpredictable, and manual spreadsheets or gut-based decisions often fall short. Forstock replaces these outdated methods with an AI-driven system that tracks inventory in real time and predicts exactly when and how much to reorder. By connecting directly to your Shopify store, the platform analyzes 12–24 months of sales data to uncover recurring seasonal patterns at the SKU level.
What sets Forstock apart is its ability to identify seasonal trends across multiple layers - yearly, monthly, and even weekly - while factoring in external influences like weather changes, economic conditions, and social media activity. It also flags past stockout periods to ensure the AI doesn't confuse a supply issue with a lack of demand.
"The challenge isn't knowing that seasonality exists, it's planning for it without relying on gut instinct." - Bhoomi Singh, Sumtracker
By leveraging AI, businesses can reduce inventory levels by 20% to 30% and avoid costly stockouts. Forstock dynamically adjusts reorder points and safety stock, increasing buffers during peak times and scaling back during slower periods to control carrying costs.
Use Real-Time Demand Forecasting
Forstock's AI models dive into your Shopify sales history to create demand forecasts that adapt to seasonal shifts, growth trends, and sales velocity. Using advanced algorithms, the system generates "seasonal indexes" for each SKU, showing how demand deviates from the average during specific times. This means you're not guessing how much to stock for a busy season - you’re making decisions based on precise, data-backed projections.
The platform continuously refines its forecasts as it processes new data, improving accuracy over time. For long-term seasonal modeling, 2–3 years of historical data is ideal, but even with less, the AI can identify meaningful patterns and offer actionable insights. It tracks daily sales rather than just raw volume, helping you spot early signs of seasonal surges and reorder before demand peaks.
Additionally, Forstock accounts for supplier lead times, ensuring your inventory arrives exactly when you need it.
Automate Purchase Orders and Supplier Communication
Forstock simplifies purchase order creation by building them directly from its demand forecasts and inventory data. With just one click, you can send orders to vendors, eliminating the hassle of manual calculations and spreadsheets. You can also input specific lead times for each supplier or product, allowing the platform to adjust restocking alerts accordingly. Reorder points are dynamic, adapting to seasonal demand instead of relying on static averages. For example, if the AI detects an upcoming seasonal spike, it will trigger earlier reorders and adjust safety stock to avoid stockouts. You can even tweak forecasts manually to account for planned promotions or influencer-driven sales surges.
Supplier communication is centralized within the platform, letting you share forecasts months in advance to secure production slots and materials ahead of peak seasons. Real-time dashboards provide visibility into purchase order progress, enabling mid-season adjustments if actual sales deviate from initial projections. This adaptability is key during volatile demand periods, such as the 51% year-over-year increase in home goods demand seen in 2020.
"I open the dashboard in the morning and instantly know what needs reordering, what is overstocked, and what to focus on. It is one of the few SaaS tools I would call essential for scaling." - Emily, Inventory Manager
Track Inventory with a Single Dashboard
Forstock offers a unified dashboard that consolidates real-time inventory data, supplier performance metrics, and purchase order statuses in one place. The system syncs your listings, orders, and inventory across all sales channels and locations, ensuring consistent data.
The dashboard provides instant insights into inventory turnover and stock value, helping you identify fast-moving items and spot potential dead stock before the season ends. You can create, split, and track purchase orders directly within the platform, moving from draft to delivery in minutes. AI-driven insights, powered by historical Shopify data, offer demand forecasts that account for seasonality, growth, and trends.
For businesses managing multiple locations or sales channels, this centralized visibility is invaluable. Instead of checking stock levels at each warehouse manually, you can monitor everything from one screen and set up alerts to flag potential stockouts before they occur. This proactive approach ensures timely supplier communication and helps prevent revenue losses caused by unmet seasonal demand.
"What I love about Forstock is how approachable it is. Most inventory platforms are overbuilt and confusing, but this one just works. The forecasts are accurate, the purchase order flow is seamless, and my team actually enjoys using it." - Liam, Operations Director
This streamlined system integrates seamlessly with the broader seasonal planning strategy, creating a cohesive and efficient process for managing inventory.
Conclusion
Inventory planning for seasonal demand thrives on a data-driven approach. To get it right, you need to follow a few essential steps: review historical sales data, group products based on seasonality, incorporate external factors into your forecasts, adjust safety stock levels, and time your purchases carefully to match supplier lead times. These steps create a solid framework for managing inventory during seasonal shifts.
Why does this matter? Because stockouts are expensive - North American retailers lose over $300 billion annually due to them. On the flip side, businesses leveraging AI-based forecasting tools can cut inventory levels by 20% to 30%. Real-time demand sensing transforms seasonal spikes into opportunities for growth rather than moments of panic.
This shift in thinking is gaining traction across industries:
"When inventory decisions are based on real demand signals instead of gut instinct, seasonal peaks become opportunities, not stress tests." - Sumtracker
Forstock simplifies this process by identifying seasonal trends, calculating the perfect purchase quantities, and dynamically adjusting reorder points. Instead of juggling spreadsheets or manually tracking inventory across locations, you get a centralized dashboard that tells you exactly when and what to reorder. With AI continuously refining forecasts, your purchasing decisions stay on target. By aligning your inventory strategy with real-time data, you can maintain consistent results, no matter the season.
FAQs
How far ahead should I order for peak season?
Ordering 2 to 3 months in advance of peak season is a smart way to maintain steady operations. By planning ahead, you can avoid stockouts during high-demand periods and account for potential lead times. This ensures your shelves stay stocked and your business runs smoothly when it matters most.
How do I set seasonal safety stock and reorder points?
To determine seasonal safety stock and reorder points, start by analyzing historical sales data to uncover seasonal trends. Consider external influences like holidays, promotional events, or even weather conditions that could impact demand.
For safety stock, adjust your buffer levels based on demand fluctuations - build up extra stock ahead of busy seasons and scale it back during slower periods. When setting reorder points, factor in both lead times and peak demand to ensure your inventory replenishment stays on track.
Rely on demand forecasts that incorporate seasonality to help you maintain the right stock levels throughout the year. This approach keeps your inventory aligned with customer needs while minimizing overstock or shortages.
What should I do if I don’t have enough seasonal sales data?
If you don’t have enough seasonal sales data, take a look at at least two years of historical sales records. This can help you spot patterns like holiday surges or recurring monthly trends. Don’t stop there - factor in external influences like holidays, weather conditions, or even broader trends to make your forecasts more accurate. To fill in any gaps, consider using qualitative insights or leveraging AI tools. These can help you predict demand more effectively and ensure smarter inventory planning, even if your internal data is limited.
Keep reading
Try Forstock free for 14 days.
AI-powered demand forecasting and reorder automation for Shopify brands. No credit card required.