
Inventory Planning for CPG Brands on Shopify: The Complete Guide
By Forstock Team · Last updated July 14, 2026
SKU-level forecasts, reorder points, and channel reservations to optimize Shopify CPG inventory and free up cash.
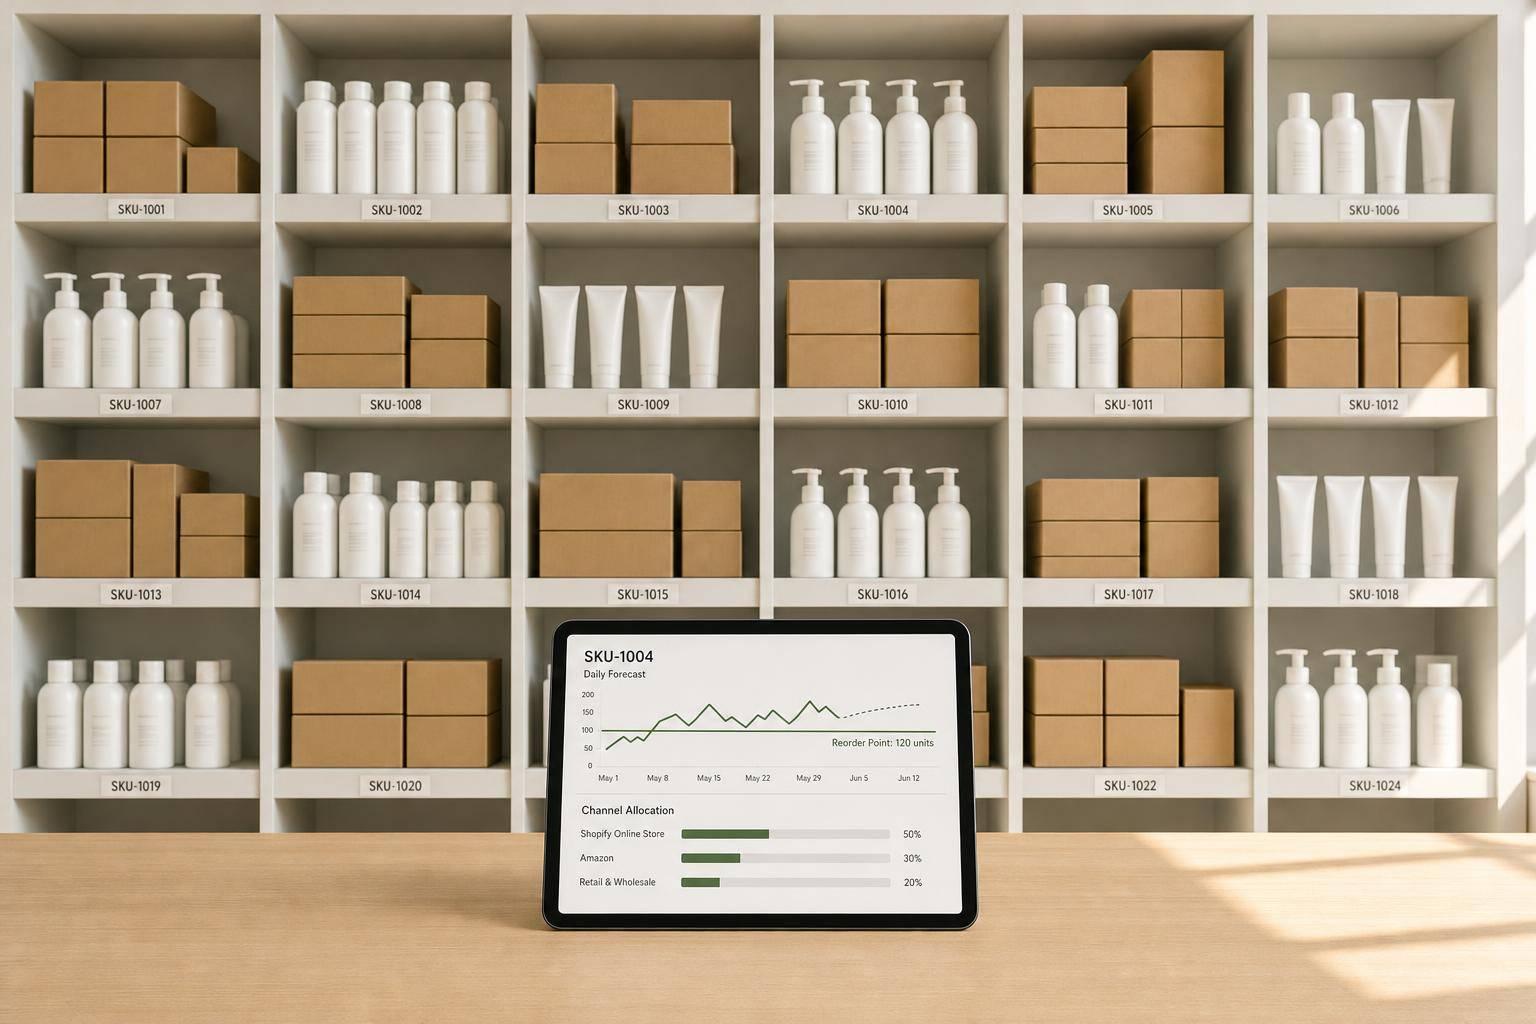
If I had to sum it up in one line: Shopify CPG inventory works best when I plan each SKU by location and channel, then turn that forecast into reorder points, safety stock, purchase orders, and weekly checks.
If I plan too high-level, I miss what matters. A hero SKU can stock out during a promo, while a slow item sits in storage and ties up cash. That problem gets worse when inventory is split across a 3PL, a warehouse, retail, and DTC.
Here’s the short version of what matters most:
- Forecast at the SKU level, not just by product or category
- Fix stockout-distorted sales data so demand is not understated
- Add promo, seasonality, and launch effects into the forecast
- Set reorder points and safety stock using demand and lead time
- Check MOQs, cash, and storage limits before placing POs
- Plan inventory by location, bundle component, and channel
- Protect subscriptions and committed wholesale orders first
- Track DIO, aging stock, fill rate, and cash tied up in inventory
- Move past spreadsheets once SKU count, channels, and reorders start piling up
A few numbers from the piece make the stakes clear: brands may end up with $80,000 in aging stock, target 45 to 75 days of cover for many DTC consumables, and watch inventory drift create losses like $140,000 per year before fixing the process.
I’d read this guide as a simple system:
- Forecast demand
- Convert it into buy timing and quantities
- Place inventory in the right nodes
- Reserve stock for the right channels
- Review risk and cash every week
That’s the core idea of the article, and the rest explains how to do each step without guessing.
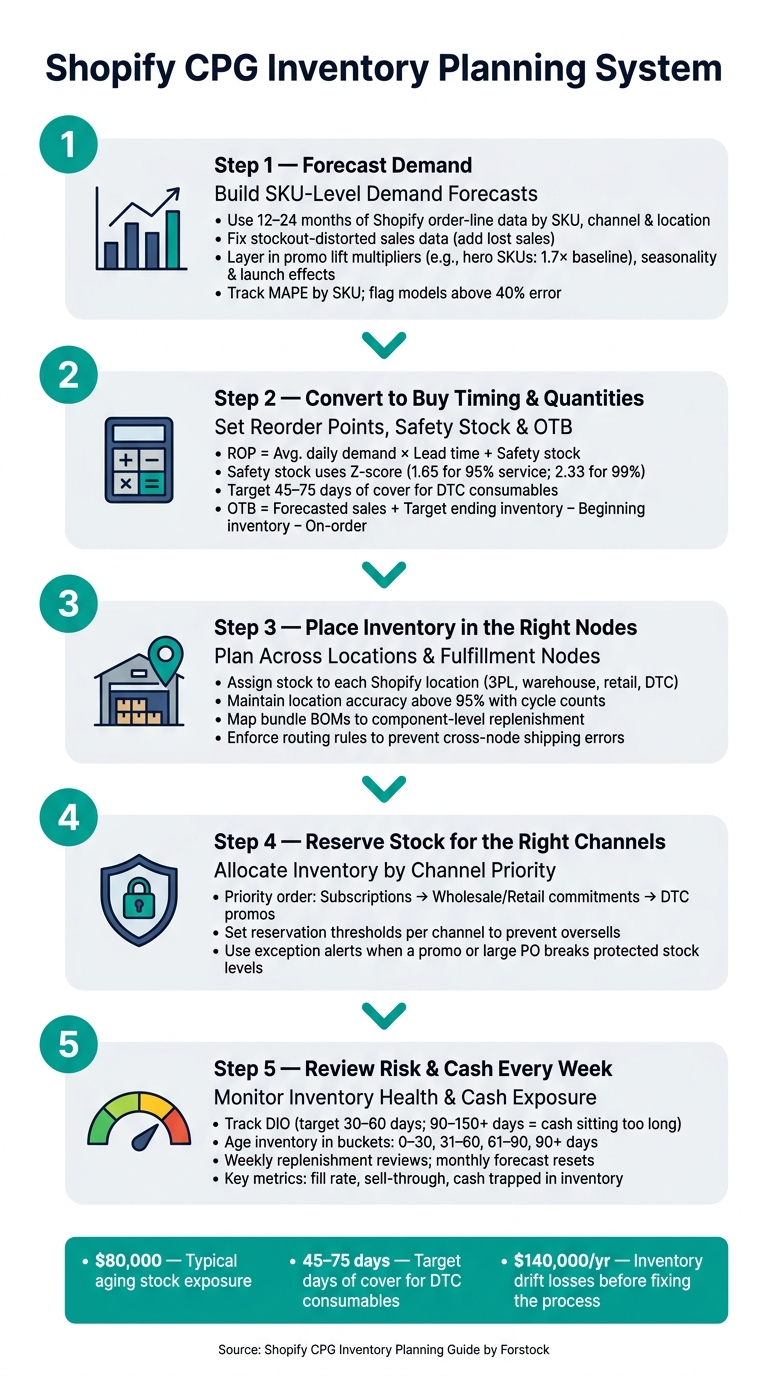
Shopify CPG Inventory Planning: 5-Step System from Forecast to Replenishment
Shopify and Inventory Planner integration | Demand Forecast | Inventory Planning | eCommerce stock

sbb-itb-f0fc809
Build SKU-level demand forecasts you can actually use for purchasing
Category-level forecasts don't help much when it's time to cut a purchase order. You buy and receive inventory at the SKU and channel level, so that's where the forecast needs to live.
Start with 12–24 months of Shopify order-line data by SKU, channel, and location. Then clean it up for periods when stockouts held sales back. That part matters a lot. If a product was out of stock, completed orders show only what you could sell with limited inventory on hand, not what shoppers actually wanted to buy. So include lost sales from stockouts, not just shipped or completed orders. That gives you a demand view that's much closer to the truth, and one you can use for purchasing.
Use top-down and bottom-up forecasting together
Top-down planning begins with channel revenue targets, then converts those targets into units using ASP and past channel mix.
Say your beverage SKUs average $3.99 on Shopify. Divide the revenue target by that ASP, and you get unit demand by SKU. From there, spread those units across products based on each SKU's share of category volume.
Bottom-up forecasting works in the other direction. You project units for each SKU from its own sales history, then roll those numbers up to see the revenue they would produce.
When bottom-up demand comes in below the target, don't ignore it. That's the point where the team needs to talk through what would close the gap:
- a major promotion
- a new retail account
- a price increase
- a new launch
If that step gets skipped, purchase orders end up tied to targets that SKU-level history just doesn't back up. Once the baseline is set, layer in promo and seasonality effects.
Adjust forecasts for promotions, seasonality, and new products
A plain baseline forecast misses too much. Promotions can drive sharp spikes, and weather or seasonal buying patterns can shift demand fast. Those effects need to be added on purpose.
Tag past Shopify orders by discount code and promo window. Then measure how much each promo lifted units above baseline for each SKU type. For example, hero SKUs in a major DTC sale with email and paid social support might run at 1.7× baseline, while long-tail SKUs might see only 1.2×. Those multipliers should live in the forecast, not in someone's memory a few days before launch.
Catalog segmentation keeps this from turning into a mess. Hero SKUs often drive most revenue, so they need weekly review and tighter promo modeling. Seasonal SKUs should be tied to specific calendar windows using prior-year curves. Long-tail SKUs can usually run on a simple trailing 3–6 month average reviewed monthly. Launch SKUs should borrow patterns from similar items and planned distribution. Track MAPE by SKU and channel; above 40% usually means the model needs work.
How Forstock builds rolling forecasts from Shopify and channel data
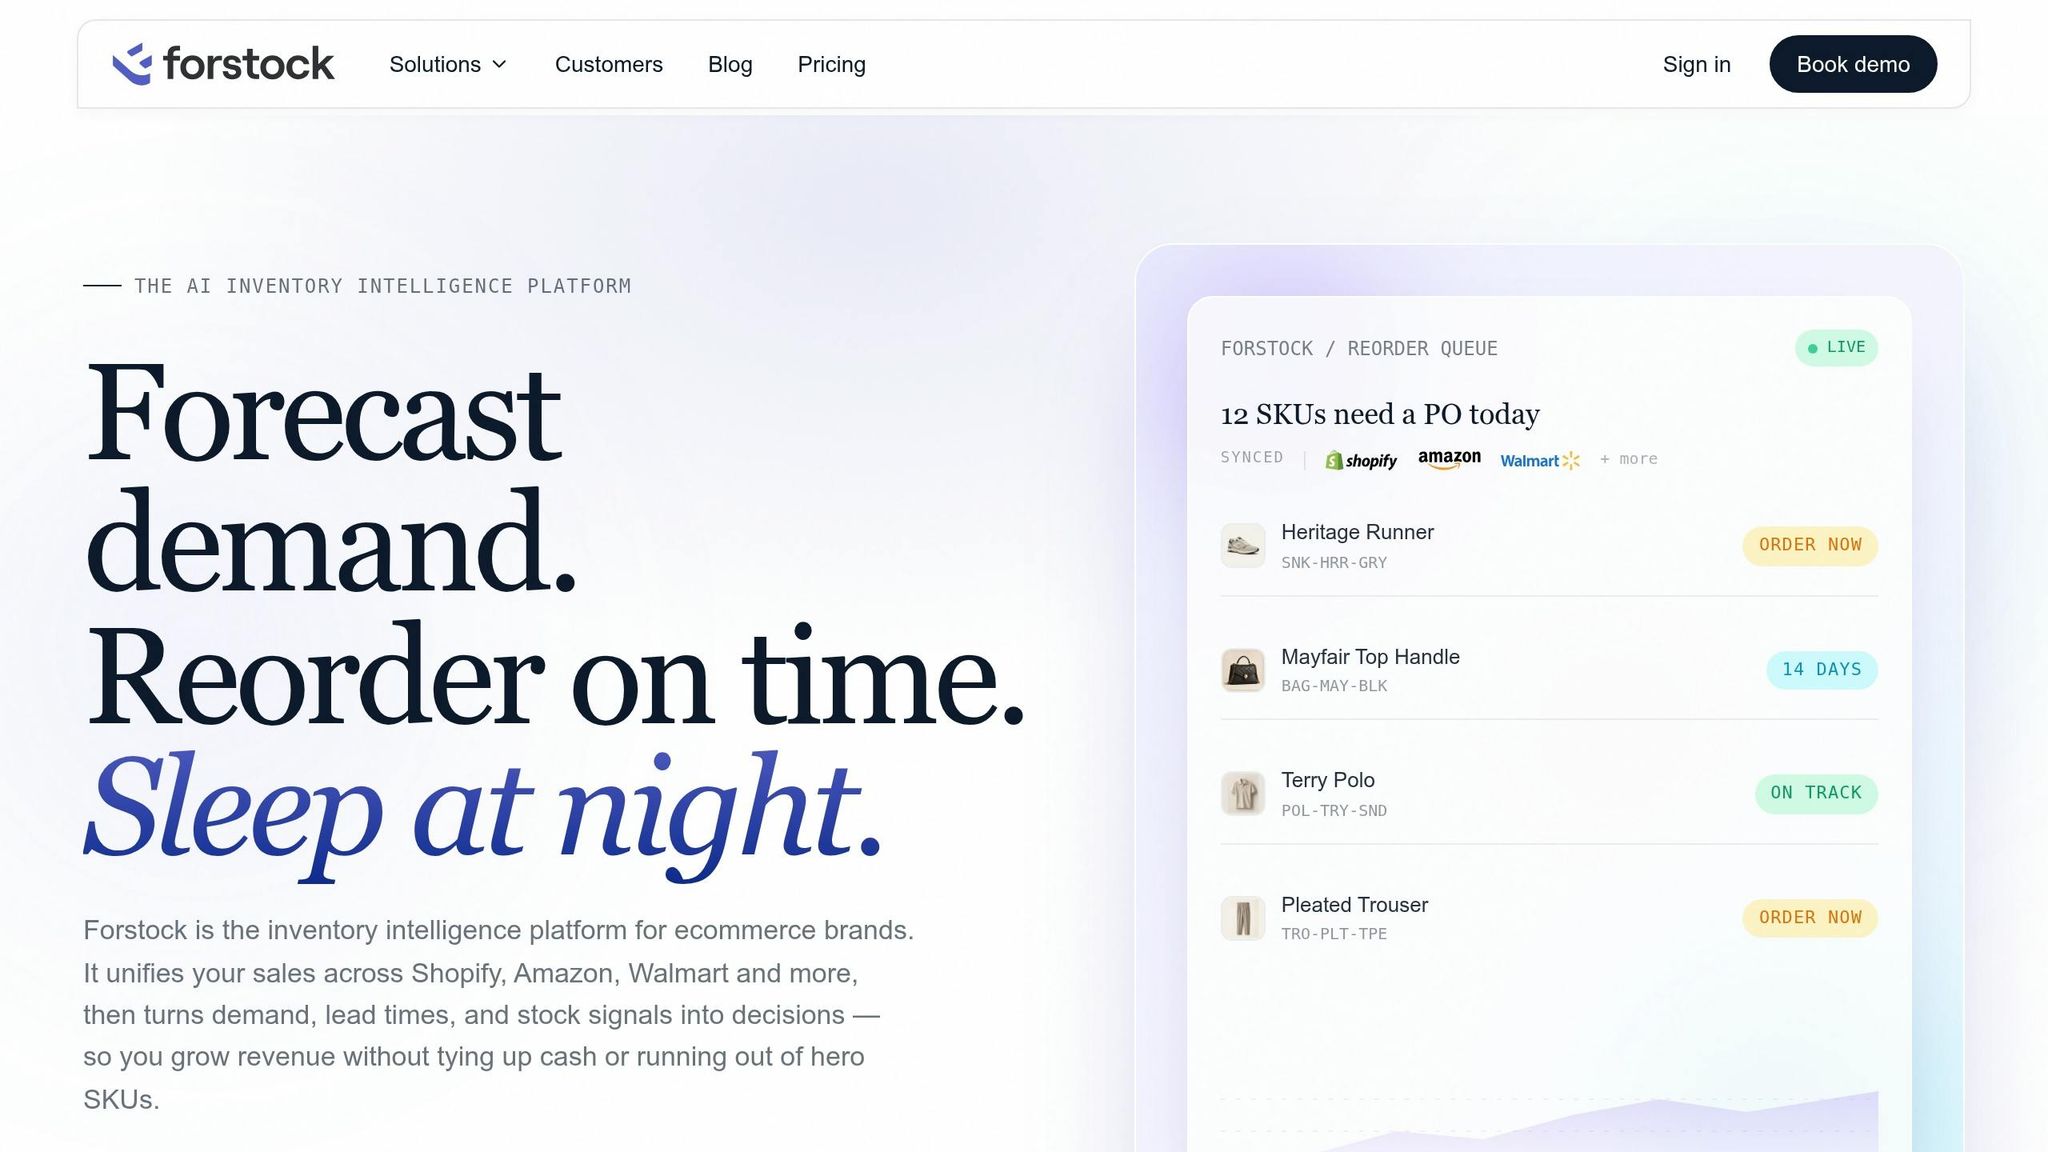
Forstock pulls Shopify order-line data by SKU and channel, then builds rolling 12-month forecasts that update as sales data changes. That cuts out manual spreadsheet work.
The platform supports both top-down and bottom-up planning, and it lets teams compare the two before they turn into purchase orders. So if finance sets a revenue target that SKU-level history doesn't support, that mismatch shows up in the plan early. Forecast accuracy is tracked by SKU and channel with metrics like MAPE, which gives planners a direct read on where the model holds up and where assumptions need to be tightened. That forecast then feeds reorder points, safety stock, and purchase timing.
Turn forecasts into reorder points, safety stock, and purchase plans
Once the SKU forecast is set, you can turn it into reorder points, safety stock, and a purchase budget. Those three numbers drive replenishment at the SKU-location level.
Set reorder points and safety stock using lead times and demand variability
The reorder point (ROP) is the inventory level that tells you it's time to place a new purchase order. You calculate it at the SKU-location level using this formula:
ROP = Average daily demand × Lead time in days + Safety stock
If you place orders every two weeks, add that review window into the reorder point. Otherwise, you can hit zero before the next PO even goes out.
Here’s a simple example. Say a beverage SKU sells 40 units per day and your total lead time is 21 days:
- Co-packer production: 10 days
- Transit to your New Jersey 3PL: 5 days
- Receiving and quality inspection: 6 days
That gives you 840 units of lead-time demand. Then you add safety stock on top. That total becomes your reorder trigger.
Safety stock is the buffer that protects you when demand jumps or a shipment shows up late. A variability-based method accounts for changes in both demand and lead time:
Safety stock = Z × √(Avg. lead time × σ²_demand + Avg. demand² × σ²_lead time)
Here, Z is the service-level factor:
- 1.65 for 95% service
- 2.33 for 99%
That jump from 95% to 99% is not small. It takes a lot more stock to get there, which means a lot more cash sitting on the shelf.
Days of cover helps you sanity-check the result:
On-hand inventory ÷ Average daily demand
If you have 2,000 units on hand and sell 40 per day, you have 50 days of cover. For D2C consumables, a common target is 45 to 75 days of cover.
The best move is usually the simplest one that still fits your demand pattern. And there’s one practical wrinkle you can’t ignore: MOQs often beat the math. If your variability-based safety stock says 300 units but your co-packer requires a full pallet of 1,200, you’re going to carry more than the formula says. In that case, treat the calculated safety stock as the floor and the MOQ as the order limit, then check both against cash on hand and available storage.
Those formulas set the inventory floor. Open-to-buy sets the spending cap.
Use different inventory policies for hero, seasonal, and low-priority SKUs
Not every SKU needs the same buffer. If you hold 99% service-level stock across the whole catalog, you can tie up far more working capital than most brands can afford.
A practical setup for U.S. Shopify CPG brands looks like this. Hero SKUs - your top revenue drivers and DTC best-sellers - usually justify 97% to 99% service levels, 25 to 40 days of cover, and variability-based safety stock. If a hero SKU goes out of stock during a promotion or a social push, the hit can sting.
Seasonal SKUs need high service levels during the selling window, usually 95% to 98%, but they should be wound down hard after peak. Otherwise, you end up sitting on post-season overstock.
Long-tail SKUs can run much leaner: 85% to 92% service levels, 10 to 15 days of cover, and simple time-based buffers reviewed monthly.
At the end of the day, this is a cash decision wearing an inventory hat. Higher service levels protect sales, but they also lock up working capital.
Build open-to-buy plans and convert them into purchase orders with Forstock
Once SKU-level replenishment needs are set, the next step is to roll them up into a category-level buy plan.
Open-to-buy (OTB) planning answers a plain question: How much inventory can we afford to receive this period without going over budget?
The formula is:
Planned receipts = Forecasted sales + Target ending inventory − Beginning inventory − On-order
For example, say your beverage category is forecast to sell $300,000 in Q4. You want to end the quarter with $100,000 of inventory at cost. You’re starting with $80,000 on hand, and you already have $60,000 on order. That gives you an OTB of $260,000 in planned receipts. From there, you can split the budget across SKUs based on forecast share and priority.
Forstock turns SKU-level forecasts into weekly replenishment recommendations and shows them in an open-to-buy dashboard with planned receipts, budget limits, and cash tied up in inventory by category. When a recommendation gets approved, Forstock creates the purchase order directly, with vendor, quantity, and timing already filled in. So instead of rebuilding spreadsheets every time the forecast changes, the team reviews the recommendations and moves.
Manage inventory across locations, bundles, promotions, and channels
Once the purchase plan is set, the next step is deciding where stock should sit and which channel can use it.
Plan inventory across Shopify locations and fulfillment nodes
Shopify tracks inventory by location. That means stock in one warehouse or 3PL does not cover another location automatically. You need to add inventory, assign it to the right location, and transfer it by node so routing and product availability stay correct.
That sounds basic, but it can go sideways fast. In one case, routing rules weren't updated across two nodes, so West Coast orders were sent to the East Coast. After the team enforced routing rules and daily inventory syncs across both nodes, late shipments fell by 30%, and stockout-related support tickets dropped sharply.
A good rule of thumb is to keep location accuracy above 95% with cycle counts: daily for top SKUs, weekly for the next tier, and monthly for slow movers. Every transfer, receipt, and inventory adjustment needs to hit the system fast, or Shopify drifts away from what is physically on the shelf.
As brands grow, most setups fall into a few common patterns:
| Strategy | Operational Impact | Stockout Risk | Complexity |
|---|---|---|---|
| Single location | Simple processes, one source of truth | Higher for geographically dispersed customers | Low |
| Multi-location (East/West DCs + 3PL) | Regional availability, faster shipping | Lower regionally, higher if balancing fails | High |
| Channel-specific segregated stock | Protects wholesale and retail commitments | Localized stockouts if pools aren't redistributed | Medium–High |
| Shared inventory pool | Simpler planning, lower total safety stock | One channel spike can starve another | Medium |
A practical place to start is one primary node plus one regional node. Shared pools usually work while volume is still small. Then, once wholesale or retail makes up more than 30–40% of total units, it makes sense to add channel-specific reservations.
After node-level stock is right, the next job is mapping bundled SKUs to the parts they consume.
Account for bundles, kits, and component demand
Bundle demand has to roll down into component demand. That's the part teams often miss.
A bundle SKU can make demand look clean in Shopify, but replenishment doesn't happen at the finished-bundle level. It happens at the level of the items inside the bundle. If you only track the finished kit, you're flying half-blind.
One hydration brand learned that the hard way. It tracked only finished kits and single-flavor boxes, so one popular flavor kept going out of stock during campaigns. Once the team modeled every kit order as component demand, it increased purchases of that flavor by 25% and eliminated kit stockouts.
This is where bills of materials (BOMs) matter. A BOM for a 12-pack variety case might call for 3 units of flavor A, 3 of flavor B, and 6 of flavor C. Without that map, a forecast of 10,000 cases can't turn into a sound purchase plan for each flavor.
Forstock uses BOMs and bundle mapping to turn SKU-level forecasts into component-level requirements automatically. So when a popular bundle is expected to spike, the system pushes the right upstream purchase orders before inventory runs dry, not after.
That component view also helps stop one channel from quietly eating stock another channel was counting on.
Allocate inventory across DTC, wholesale, retail, and promotions
Protecting channel commitments is how you avoid oversells without stuffing every inventory pool with extra stock.
If a team plans from one total on-hand number, trouble can sneak in. A DTC flash sale can drain units needed for a confirmed wholesale PO. A wholesale reorder can wipe out stock set aside for a retail planogram reset. And when those commitments are missed, the fallout is real: retailer fines, delistings, and lost shelf space.
The fix is channel reservation rules. Start by protecting the commitments that matter most. In practice, that means reserving stock in this order:
- Subscriptions
- Confirmed wholesale and retail commitments
- DTC promotions and marketplaces
A skincare brand using this setup cut missed subscription shipments to near zero while still keeping campaign windows profitable.
Forstock gives planners multi-channel and multi-warehouse visibility, so they can see per-channel stock coverage in days, set reservation thresholds, and get exception alerts when a promotion or large PO would break a protected stock level. Instead of finding out after an order ships late, the team sees the conflict during planning, when it can still shift the promo window, expedite a shipment, or move units from a lower-priority channel.
Those reservations then become the baseline for the inventory health metrics in the next section.
Monitor inventory health, cash exposure, and move beyond spreadsheets
Track stock risk, aging inventory, seasonality, and cash impact
Once replenishment is in place, inventory health shows whether the plan is holding up or starting to slip.
Track weekly turnover, DIO, sell-through, months on hand, fill rate, inventory value, and cash trapped in inventory at the SKU level first, then roll that up by brand, channel, and warehouse. Fill rate tells you how often orders ship complete on the first try. Inventory value and cash trapped in inventory turn unit counts into a working-capital view. Put those together, and you can see whether cash is pulling its weight or just sitting there. That makes it easier to decide what to reorder, what to slow down, and where cash is getting stuck.
Target 30–60 days of DIO. At 90–150+ days, cash is sitting too long.
Aging inventory needs its own lens. Track stock in buckets - 0–30, 31–60, 61–90, and 90+ days - to spot deadstock early. If the product has shelf-life limits, you need even tighter tracking. A SKU sitting in the 90+ day bucket with falling sell-through isn't just slow-moving stock. It's cash tied up with no good reason.
There’s always a tradeoff here. Higher buffers can cut stockouts, but they also add carrying cost. Leaner inventory frees up cash, but it leaves less room for error.
A practical rhythm looks like this:
- Daily exception checks
- Weekly replenishment reviews
- Monthly resets for inventory value and forecast assumptions
That monthly reset matters more than it may seem. Seasonality shifts. Supplier performance changes. If the team doesn’t adjust, the plan can drift quietly until it turns into a mess.
Why spreadsheet planning breaks down as Shopify CPG operations grow
When teams track these metrics by hand, things can fall apart fast.
Spreadsheets rely on manual exports, formula fixes, and version control. Someone exports a CSV from Shopify, pastes it into a tracker, tweaks a formula, and emails the file around. By the time the next person opens it, the numbers are already old. Then two people edit two different versions, and suddenly there are two "right" answers. That's where confusion starts.
One Shopify Plus CPG brand cut manual order processing from 40 to 6 hours a week, reduced fulfillment time from 3–5 days to 1 day, and dropped inventory that exists in the file but not on the shelf from $140,000 to $8,000 a year.
The signs that a brand has outgrown spreadsheets are usually plain to see: duplicate purchase orders, stale inventory counts, missed transfer needs, and Shopify stockout fire drills that should've been spotted a week earlier. Planning also starts to depend on one or two people who know how the file works. If they're out, the whole process slows down.
Conclusion: Build one planning system from forecast to replenishment
The goal of the full process is simple: stop firefighting and run one connected system from forecast to replenishment.
Forstock brings those pieces together in one place. Forecasts feed replenishment plans. Replenishment plans generate purchase orders. Inventory health metrics show risk before it turns into stockouts or write-offs. The full workflow runs forecast → replenishment plan → purchase order → inventory health review and stays current as Shopify sales data, warehouse counts, and supplier lead times change.
The gap between spreadsheets and a centralized system shows up most when the business is moving fast:
| Spreadsheet Planning | Forstock Planning | |
|---|---|---|
| Planning Effort | High - manual exports, formula upkeep, version reconciliation | Low - data syncs automatically |
| Forecast Accuracy | Variable - assumptions drift across SKUs | Higher - SKU-level, seasonality-adjusted |
| Channel Visibility | Fragmented - separate files per channel | Unified - DTC, wholesale, retail, warehouses |
| Speed to PO | Slow - days of manual steps | Fast - exceptions flagged, POs generated in one workflow |
| Cash-Flow Control | Weak - inventory value tracked manually | Strong - DIO and coverage tracked by SKU |
Spreadsheet planning can work when the SKU count is small and reorder volume is light. But once a brand is juggling dozens of SKUs, multiple channels, and frequent reorders, the manual work piles up. Teams end up making calls on stale data, and too much time goes into maintaining the plan instead of using it.
A single planning system - from forecast to purchase order to inventory health - is what lets a CPG brand grow without losing control of stock or cash.
FAQs
How do I forecast demand for new SKUs with limited sales history?
Forecasting demand for new SKUs is tough when you don’t have much sales history to work with. At that stage, you need a starting point built from judgment and outside signals, not just past numbers.
A good baseline can come from a mix of sources, such as:
- input from your sales team
- market research
- survey data
- external trend data
- social media signals
Then, once sales start coming in, use that real-time data to adjust your plan and sharpen future forecasts.
When should I reserve inventory by channel instead of using a shared pool?
Reserve inventory by channel when you need to protect a specific platform from stockouts caused by demand spikes on other channels.
In most cases, a shared inventory pool works better. It cuts down on fragmented data and lowers the risk of overselling because you can see stock across sources like Shopify, Amazon, and TikTok Shop in one place.
That said, there are times when dedicated stock makes more sense. If a channel has its own fulfillment rules, strict service-level agreements, or high-priority customers, setting inventory aside can help you protect those commitments.
What are the signs that my inventory planning has outgrown spreadsheets?
Inventory planning has likely outgrown spreadsheets when manual updates start dragging things down. At that point, they become slow, error-prone, and tough to keep in shape.
A few signs tend to show up at the same time. Data gets fragmented across Shopify, sales channels, and 3PLs. Operations get more complex once you’re dealing with 500+ SKUs or three or more locations. Visibility is often limited to the next 90 days, and lot or serial tracking becomes hard to manage.
You may also see more stockouts, too much inventory sitting on shelves, or both at once. Forecasting can get messy as lead times shift and seasonality or promotions start affecting demand in less predictable ways.
Keep reading
Try Forstock free for 14 days.
AI-powered demand forecasting and reorder automation for Shopify brands. No credit card required.