
Demand Forecasting for Subscription Brands: Why Your Shopify Sales History Lies to You
By Forstock Team · Last updated July 21, 2026
Stop using raw Shopify orders—split renewals, new orders, and exceptions; adjust for skips, churn, and convert bundles to SKU-level forecasts.
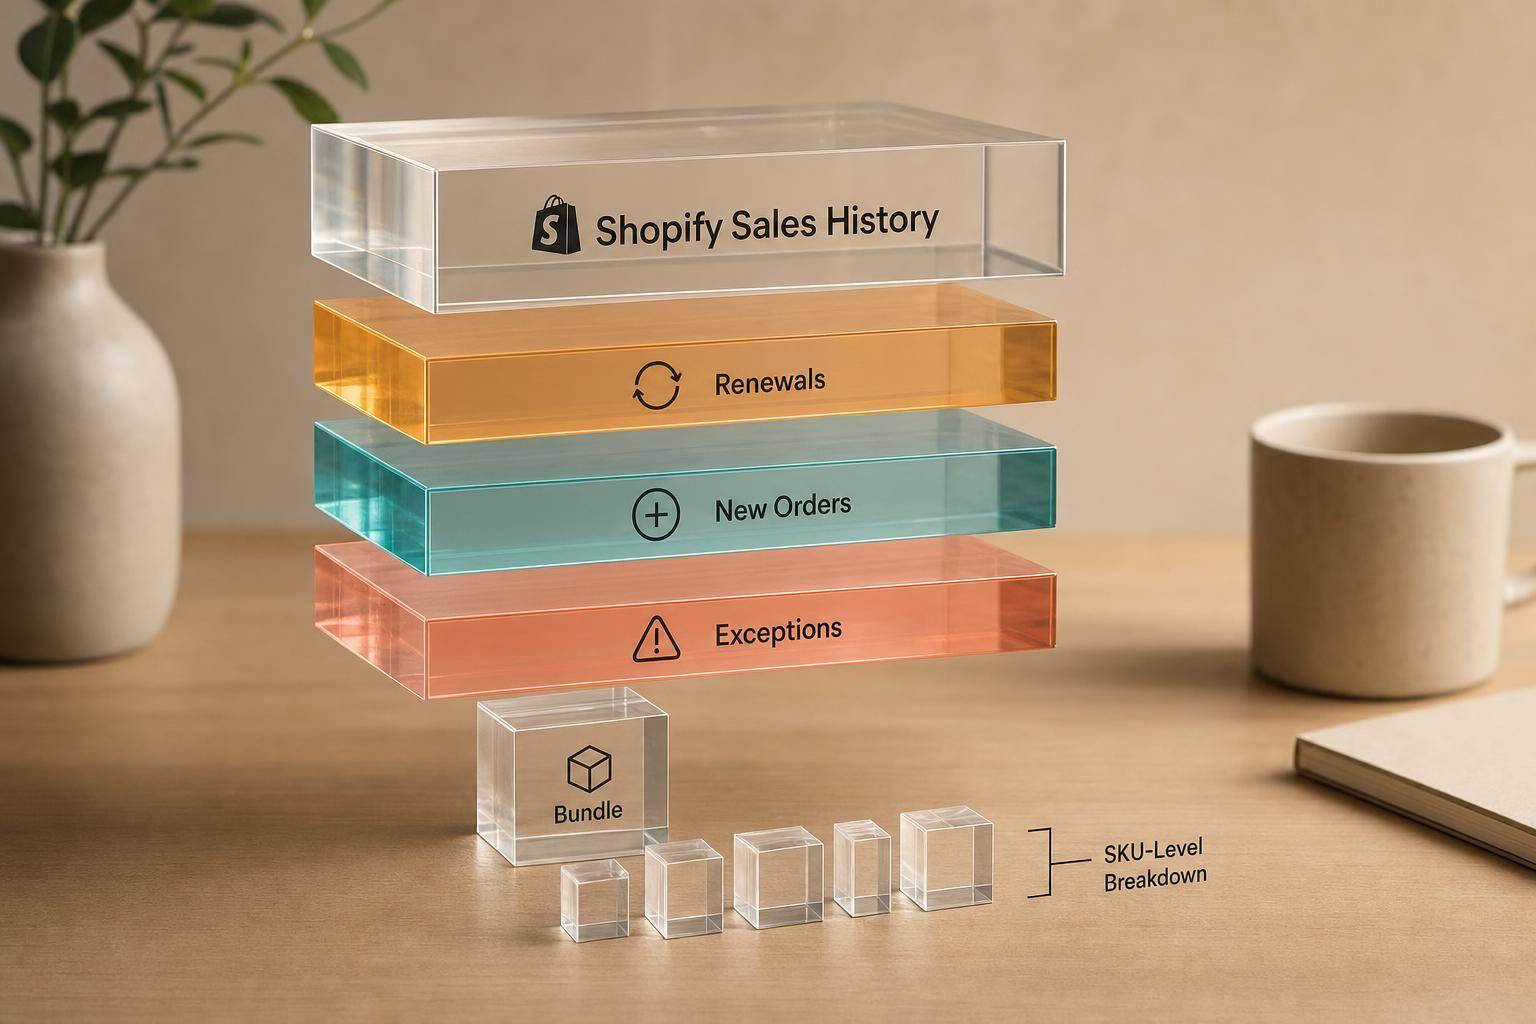
Your Shopify sales history is not a clean demand forecast. If you sell subscriptions, raw order data mixes renewals, first orders, skips, pauses, prepaid plans, swaps, and promo spikes into one line. That can lead to stockouts, extra inventory, and bad PO timing.
Here’s the short version:
- Do not forecast from total Shopify orders alone
- Split demand into 3 streams: first-time orders, recurring renewals, and one-off spikes
- Adjust for skips, churn, prepaid renewals, and cadence changes
- Break bundles into component SKUs before planning inventory
- Review forecast error each cycle and fix drift early
A simple example shows the problem: if monthly orders move from 5,000 to 7,500, that does not always mean demand grew 50%. Part of that lift may come from cadence changes, prepaid billing, or short promo bursts.
What I take from this article is simple: raw Shopify history shows what got processed, not what you should buy next. To plan inventory well, I’d use subscriber data, renewal timing, skip behavior, bundle BOMs, and ship-window SKU counts - not just shipped order totals.
If you want a forecast you can use for purchase orders, the path is clear: clean the signal first, then plan units and reorder dates from adjusted demand.
Shopify and Inventory Planner integration | Demand Forecast | Inventory Planning | eCommerce stock

How Shopify sales history misleads subscription forecasting
Shopify order reports track transactions, not demand types. That sounds minor, but it changes everything.
New-customer orders, renewals, reactivations, prepaid shipments, and bundle swaps all show up in the same report. So one report ends up mixing very different kinds of activity into one neat-looking trend line. On the surface, it looks like demand. In practice, it often isn't.
That's why subscription demand needs to be split out before you forecast it.
Recurring orders are not the same as new demand
Recurring subscription renewals are scheduled demand tied to existing subscribers. They show retention, not customer-base growth. New-customer orders do the opposite: they show expansion driven by acquisition.
When those two signals get lumped together, it's easy to read the business the wrong way. A brand might see monthly orders climb from 5,000 to 7,500 and read that as a 50% jump in demand. But that can happen even when the increase comes mostly from existing subscribers changing cadence, not from new buyers entering the funnel.
That mix-up can get expensive fast. If a team buys inventory based on that inflated demand rate, it can end up with too much stock once growth cools off and churn starts to hit.
The order patterns that distort the demand signal
A few subscription behaviors can warp Shopify history in ways that look harmless at first glance:
- Pauses, skips, churn, reactivations, acquisition spikes, prepaid plans, and billing-frequency changes each bend the order pattern in a different way.
- Churn cuts future renewals, but trailing order history can still look strong for months.
- Prepaid orders pull activity into month one, then make later months look unusually quiet even when physical demand is still shipping.
- A shift from monthly billing to every other month lowers order count per customer without lowering total sales, which planners can mistake for falling demand.
This is where teams get tripped up. The report is accurate as a transaction log, but weak as a clean read on demand.
What goes wrong when all orders are forecast together
When all of those signals are blended, planning errors tend to follow the same pattern.
Baseline demand gets overstated because the forecast bakes in a temporary lift in recurring orders that won't keep repeating once growth slows. Replenishment timing gets thrown off because cadence changes affect when demand lands, not just how much exists. Reorder points and safety stock drift out of line because the same history now blends stable recurring demand with noisier exceptions.
The sharpest mistake usually shows up at the SKU level. When customers change bundle mix, total order counts can stay flat while component demand moves hard underneath. A bundle that once sold 3 cola and 3 lemon-lime units can shift over time to 1 cola and 5 lemon-lime units. If you only forecast the bundle total, you'll overbuy one item and come up short on the other.
Forecasting all orders together makes inventory planning reactive. The first step is simple: split those signals before you run replenishment math.
Split demand into new-customer, recurring, and exception streams
Once you split the blended history, forecast three separate streams: acquisition, recurring renewals, and exceptions. Each one moves for different reasons. Each one has its own level of volatility. And each one changes how much inventory you need on hand.
Separate first-time customer demand from subscriber renewals
First orders and renewals do not behave the same way. Acquisition demand tends to move with spend, campaigns, and conversion. Renewal demand usually follows the active subscriber base and is steadier when you look at it by cohort.
Use a first-order flag or initial subscription tag to identify new customers. Use the subscription contract ID to isolate renewals. Then build cohorts by signup month and track renewal rate, skip frequency, and bundle preferences.
Why does that matter? Because different cohorts renew and skip at different rates. They should not sit on one shared demand curve. Once you split them, forecasting stops being one blended average and starts looking more like a cohort-based demand model.
Track the subscription inputs that actually drive demand
After you isolate recurring demand, forecast it from the inputs that move it: active subscribers, pauses, skips, cohort retention, churn risk, and prepaid term ends.
A simple way to think about it:
- Start with active subscribers
- Subtract paused subscribers
- Apply your expected skip rate
- Layer in cohort retention curves
That gives you a steadier estimate than averaging the last six months of blended order history.
Prepaid subscribers need their own treatment too. Model them on the date their term ends. Their demand lands at term end, not every month. Miss that date and your forecast can drift in two directions: you overbuy in quieter periods, or you run short when the renewal wave arrives. These inputs shape SKU-level order quantities and reorder timing.
Treat unusual demand as exceptions, not as the new baseline
Once normal demand is separated, pull one-time lifts out of the baseline. Event spikes should be treated as time-bound demand boosts, not as a new normal.
Model launches, influencer campaigns, holidays, and discount periods with clear start and end dates. Then remove them from baseline averages so they do not reset your run rate.
Track each stream in a simple view:
| Demand stream | Primary driver | Planning approach |
|---|---|---|
| New-customer demand | Ad spend, campaigns, conversion rate | Forecast from marketing calendar and CAC targets |
| Recurring subscriber demand | Active subscribers, retention, skips, churn | Build from cohort-level renewal projections |
| Exception demand | Launches, holidays, influencer events | Model as time-bound demand boosts with clear end dates |
Baseline inventory should follow normal demand only. Event demand should trigger separate buys.
You do not need a fancy system to get started. A spreadsheet with three views - first orders, renewals, and tagged exceptions - is enough.
sbb-itb-f0fc809
Correct Shopify data and convert it into SKU-level inventory plans
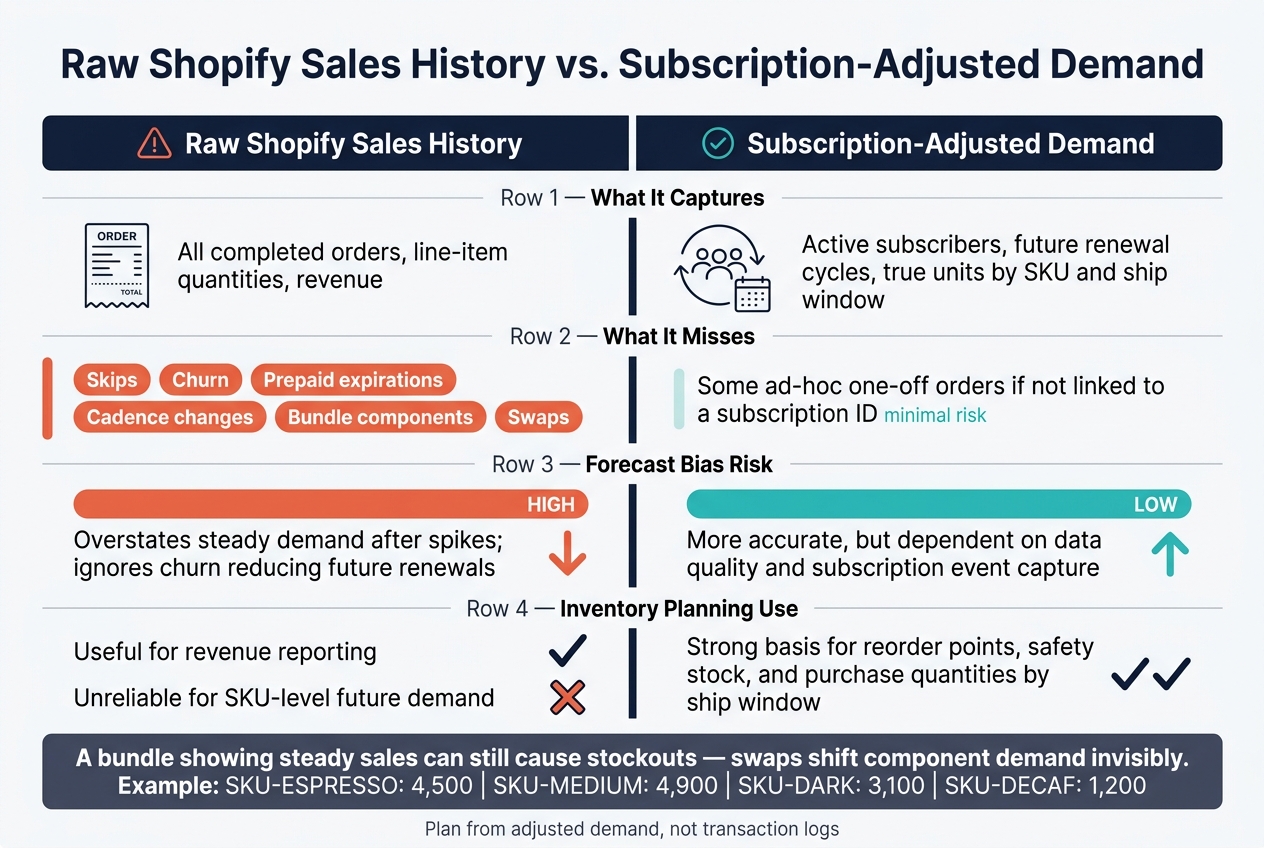
Raw Shopify Sales History vs. Subscription-Adjusted Demand: What Your Forecast Is Missing
Once you’ve split the three demand streams, the next step is to turn them into SKU counts by ship window. That’s the point where a forecast stops being just a number on a dashboard and starts becoming something your ops team can use for purchase orders and production planning.
Adjust for skips, churn, prepaid rolloffs, and subscription changes
Before you roll demand up, apply one rule for each subscription event.
- Skip: Remove units from the skipped ship window and move them to the next scheduled ship date.
- Churn: End future cycles at cancellation and reduce forward renewals using your historical churn rate.
- Prepaid: Spread units across each scheduled ship window during the prepaid term, then forecast renewals when that term ends. If 100 prepaid subscribers expire in September and 70% renew, forecast 70 October renewals. Miss this step and you create a gap in the forecast: assume everyone renews and you overstock; assume no one renews and you run short.
- Frequency or product changes: Rework future ship windows and SKU mix starting from the date the change takes effect.
Convert bundles and swaps into component-level demand
Shopify logs bundles as a single line item. Fulfillment doesn’t work that way. Your warehouse needs the component SKUs.
The fix is a bill of materials, or BOM, for each bundle. This is just a table that links every bundle ID to its component SKUs and quantities. A Coffee Sampler Pack, for example, might include 1 unit of SKU-ESPRESSO, 1 unit of SKU-MEDIUM, and 1 unit of SKU-DECAF. Each time that bundle shows up in a subscription cycle, the BOM should expand it into those three component rows before you total demand.
Swaps add another layer. If a subscriber changes DECAF to DARK, the BOM for future cycles changes to ESPRESSO + MEDIUM + DARK. Across thousands of subscriptions, those swap events can move component demand in a big way, even when total bundle volume looks fine. That’s how you end up with steady bundle sales but still run out of one flavor. The bundle count hides the shift.
For a given ship week, the output should look like this: SKU-ESPRESSO: 4,500; SKU-MEDIUM: 4,900; SKU-DARK: 3,100; SKU-DECAF: 1,200. That’s the number set you use for purchase orders and production planning, not the parent bundle total.
Raw Shopify history vs. subscription-adjusted demand: a side-by-side comparison
This is where raw history and adjusted demand start leading you in different directions.
| Raw Shopify Sales History | Subscription-Adjusted Demand | |
|---|---|---|
| What it captures | All completed orders, line-item quantities, revenue | Active subscribers, future renewal cycles, true units by SKU and ship window |
| What it misses | Skips, churn, prepaid expirations, cadence changes, bundle components, swaps | Some ad-hoc one-off orders if not linked to a subscription ID |
| Forecast bias risk | Overstates steady demand after spikes; ignores churn reducing future renewals | More accurate, but dependent on data quality and how well subscription events are captured |
| Inventory-planning use | Useful for revenue reporting; unreliable for SKU-level future demand | Strong basis for reorder points, safety stock, and purchase quantities by ship window |
"When a SKU hits zero, your sales hit zero too - and a naive forecast learns the wrong lesson. Forstock spots those stockout gaps and rebuilds what you would have sold, so you plan against real demand, not the ceiling your inventory set." - Forstock
Use adjusted demand to set reorder points, size safety stock based on demand variability, and calculate purchase quantities against on-hand and on-order inventory. That gives you a forecast you can use to order the right units before the next ship date.
Build a repeatable forecasting workflow
Once you’ve adjusted demand at the SKU level, the next step is to turn that into a repeatable planning cycle. A good forecast isn’t a one-off exercise. It’s something your team runs on a fixed schedule, using the same adjusted demand signals each time. Without that rhythm, teams tend to slip back to raw Shopify totals instead of adjusted demand.
Refresh assumptions on a set planning cadence
High-velocity brands, like consumables, frequent-ship items, or products with a short shelf life, usually need a weekly cycle. Lower-velocity products with longer lead times can work on a monthly cycle, with a mid-cycle check during peak seasons. In each cycle, update active subscribers, churn, skips, prepaid expirations, and campaign assumptions.
Start with active subscribers and demand drivers, not last month’s shipped units.
Measure forecast miss and act on drift early
Once the plan is in place, watch for drift.
Track MAPE and bias by SKU and cohort, not only at the top level. Bias is simple: actual minus forecast. If bias stays positive, you’re under-forecasting. If it stays negative, you’re over-forecasting and tying up cash in extra inventory. A useful rule of thumb: if MAPE stays above 25–30% for three or more cycles in a row, or bias keeps moving in the same direction, treat it as a sign that something has changed in the business, like a new cohort acting differently, a bundle swap trend, or a shift in churn rate.
Use variance reviews to figure out where the miss came from:
- Demand
- Cohort behavior
- Promotion timing
The goal isn’t a perfect number. It’s spotting drift early enough to do something about it, like expediting a purchase order, delaying an order, or resizing quantities before the next planning cycle.
Key takeaways for subscription inventory planning
This process only works if you keep it consistent from one cycle to the next.
The workflow is simple: separate demand streams, correct subscription events, and review error on a fixed cadence. Skips, churn, prepaid expirations, and campaign spikes are the events most likely to cause drift. Catching them early is what turns an adjusted forecast into a replenishment routine your team can trust.
Forstock can centralize this workflow by pulling Shopify data, applying adjusted demand logic, generating purchase-order suggestions, and tracking forecast-versus-actual by SKU.
FAQs
How do I separate renewals from new demand in Shopify?
Look past raw order history and clean up your Shopify data before you use it for planning.
Pull order-level data or daily SKU sales for the last 12 to 24 months. Then split that data with channel tags, customer IDs, or subscription flags so you can separate recurring subscription orders from one-time purchases.
That split matters more than it seems. If you lump everything together, your demand picture gets muddy fast. Subscription renewals usually follow a steadier pattern, while new customer demand can swing a lot more.
You’ll also want to cut out noise. Remove outliers like bulk purchases or promo spikes, and leave out out-of-stock days when you calculate demand rates. Otherwise, your averages can end up telling the wrong story.
Do that cleanup work first, and you get a much cleaner daily sales average for renewals versus new demand.
What subscription events most distort inventory forecasts?
The biggest distortions usually come from events that make sales look better or worse than actual demand.
Common examples include:
- promo spikes, flash sales, and viral campaigns
- stockout periods
- one-off bulk B2B orders, returns, and cancellations
If you don’t filter these out, they can inflate demand, hide demand that was already there, or muddy recurring buying patterns.
How do I turn bundle sales into SKU-level demand?
Don’t stop at raw Shopify order history. Track bundle components at the SKU level.
When a bundle sells, each item inside that bundle should have its inventory reduced. That way, demand shows what customers actually consumed, instead of treating the bundle like one standalone unit.
From there, combine demand for each SKU across your catalog and run forecasts at the SKU level. This gives you a more accurate average daily sales number, which makes replenishment decisions a lot easier.
Keep reading
Try Forstock free for 14 days.
AI-powered demand forecasting and reorder automation for Shopify brands. No credit card required.