
How to Build a 13-Week Cash Flow Forecast for an Inventory Business (Free Template)
Weekly 13-week cash forecast to map inflows/outflows, spot shortfalls, and time purchase decisions for inventory businesses.
How to Build a 13-Week Cash Flow Forecast for an Inventory Business (Free Template)
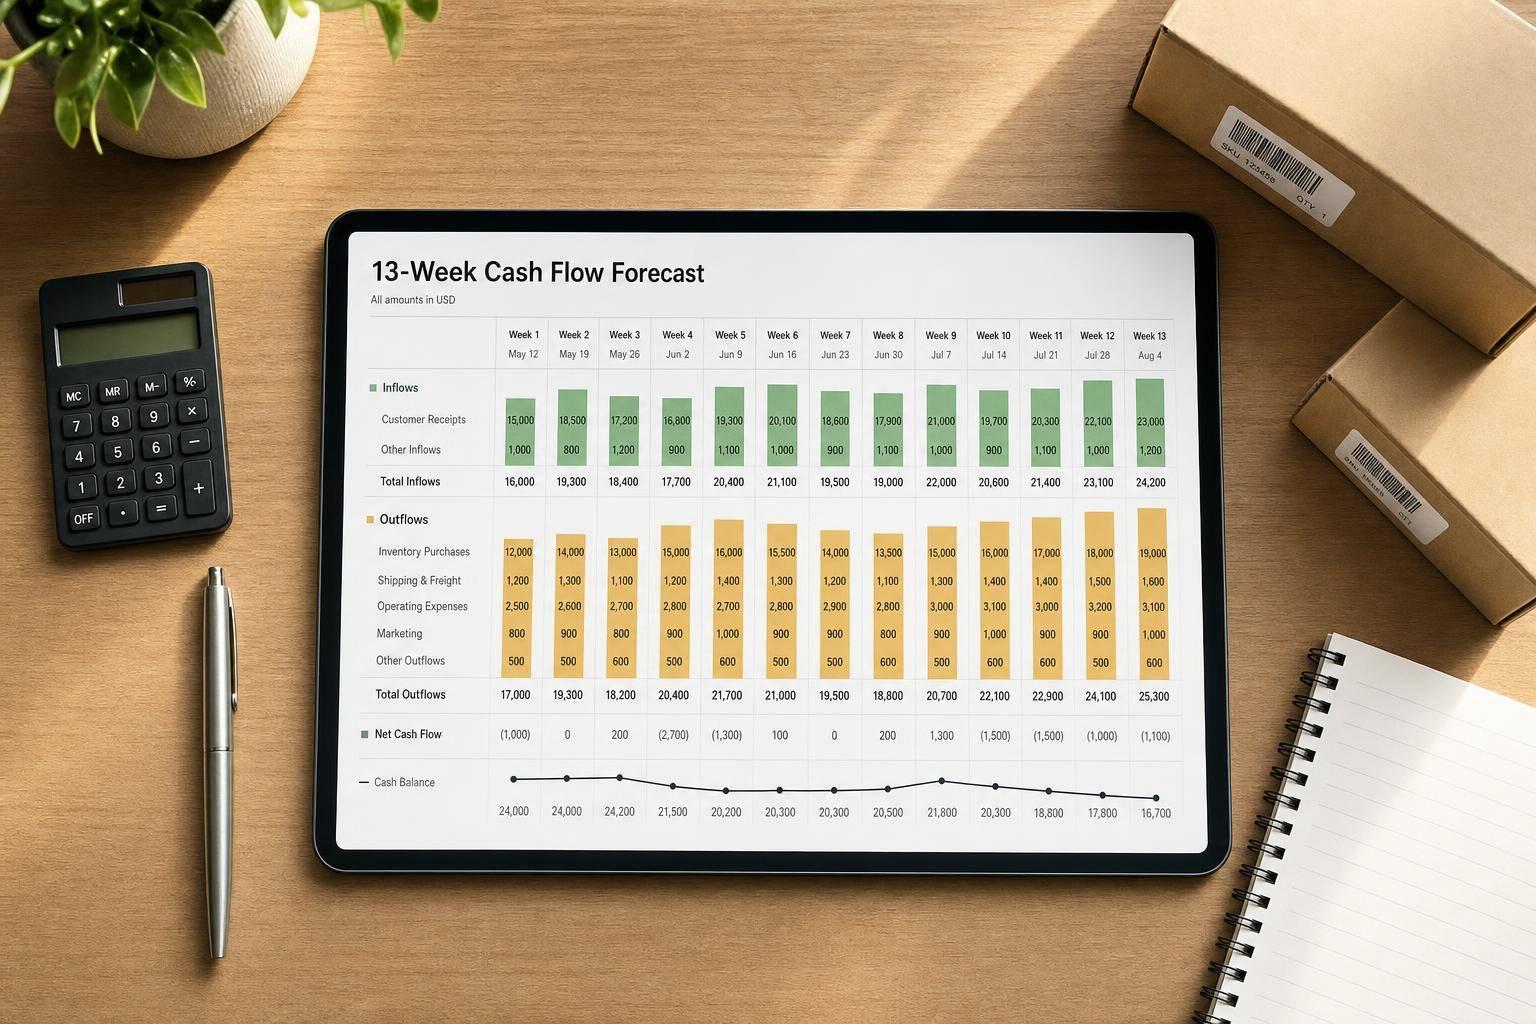
If I sell inventory, I can be profitable and still run short on cash. A 13-week cash flow forecast fixes that by showing when money will hit my bank and when it will leave over the next 13 weeks.
Here’s the short version:
- I start with my cleared bank balance.
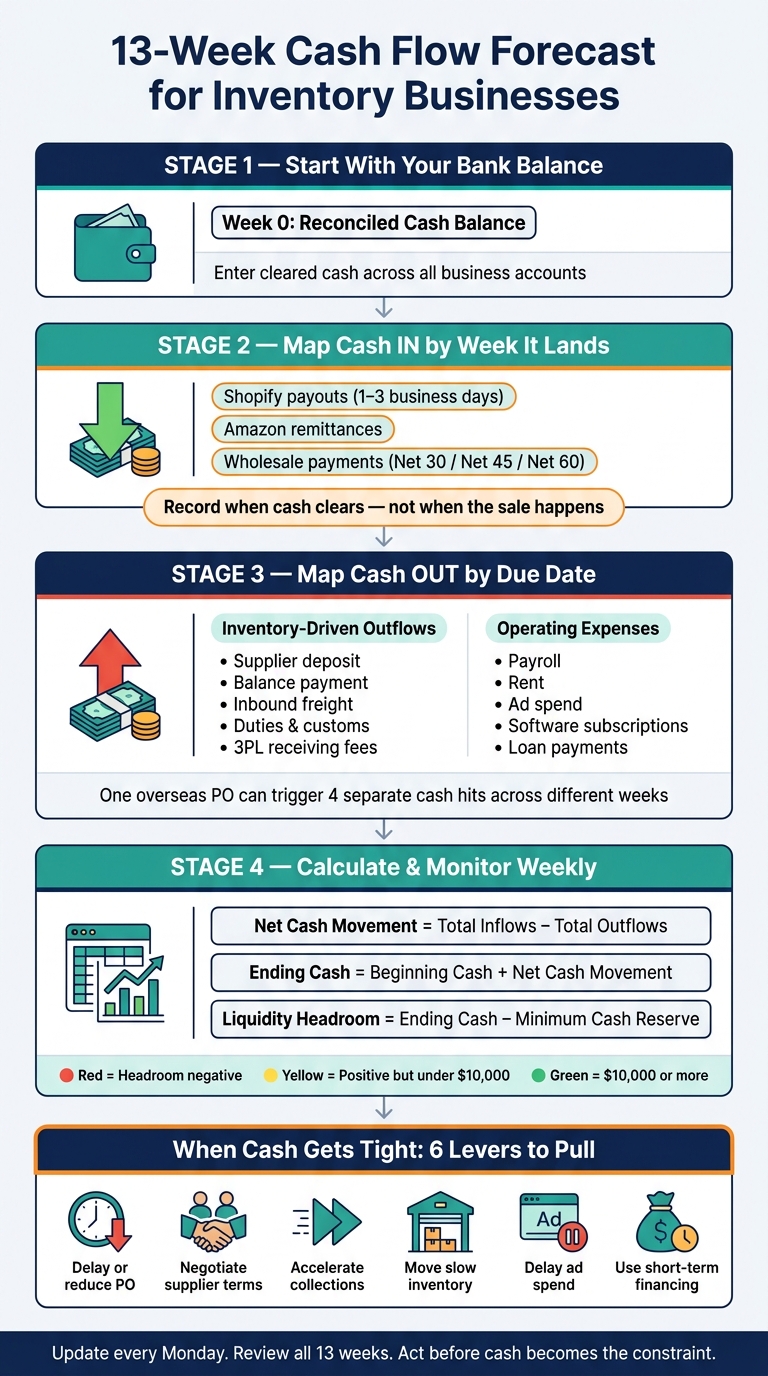
- I map cash in by the week it lands, not the week I make the sale.
- I map cash out by the week I must pay it.
- I carry the ending cash from one week into the next.
- I compare each week’s ending cash to a minimum buffer, like $50,000.
- I use that view to decide whether to delay a PO, change terms, trim ad spend, collect receivables faster, or use short-term funding.
For inventory businesses, timing is the whole issue. Shopify payouts may arrive in 1–3 business days, while wholesale payments may come on Net 30, Net 45, or Net 60. At the same time, I may pay suppliers, freight, duties, payroll, and 3PL fees weeks before I collect from sales. And if lead times stretch to 60–90 days, cash can get tight fast.
The template in this guide is built around five simple row groups:
- Beginning Cash
- Cash In
- Cash Out
- Net Cash Movement
- Ending Cash
It also includes a Minimum Cash Buffer and a headroom check so I can spot low-cash weeks before they turn into a bank problem.
A simple forecast like this doesn’t tell me my profit. It tells me something more immediate: whether I’ll have enough cash each week to keep buying, paying, and shipping.
13-Week Cash Flow Forecast: How It Works for Inventory Businesses
13 Week Cash Flow Model
sbb-itb-f0fc809
Step 1: Gather the Cash Inputs You Need
Before you touch formulas, build a clean list of every dollar you expect to collect or spend over the next 13 weeks. Keep it simple: beginning cash, inflows, and outflows.
Start with your reconciled total cash across all business accounts as of your cutoff date. Enter that number as Week 0 beginning cash. If you have uncleared checks, add them as Week 1 outflows when they matter enough to move the picture.
Cash inflows to schedule by week cash lands
Record inflows when the cash actually clears, not when the sale happens. Put each inflow in the week the money lands in your bank account.
That means mapping Amazon remittances, wholesale receipts, and credit line draws to their expected deposit dates. For wholesale customers, pull your open accounts receivable list and assign each invoice to the week payment is most likely to come in based on terms and past payment behavior.
Cash outflows to schedule by due date
Outflows split into two separate buckets, and it helps to keep them that way in your template: inventory-driven costs and operating expenses.
Inventory-driven outflows tie back to purchase order customization. For every open PO, list:
- supplier deposit
- balance payment
- inbound freight
- duties
- customs broker fees
- 3PL receiving charges
Estimate freight, duties, broker fees, and receiving charges using your latest quotes or invoices.
Operating expenses should sit in their own section. Include payroll by pay date, rent, ad spend by platform billing cycle, software subscriptions, loan payments, and estimated taxes. Each one should be entered on its contractual or scheduled due date.
Cash driver comparison table
Once your full input list is built, split the items you can move from the ones you can't. That's where the cash forecast starts to become useful.
| Line Item | Type | Fixed or Variable | Easy to Adjust? |
|---|---|---|---|
| Shopify payouts | Inflow | Variable | No – platform-controlled timing |
| Amazon remittances | Inflow | Variable | No – platform-controlled timing |
| Wholesale customer payments | Inflow | Variable | Somewhat – collection timing can vary |
| Financing / credit line draw | Inflow | Variable | Yes – operator controls timing |
| Supplier deposit (PO) | Outflow | Variable | Yes – can delay or reduce PO size |
| Supplier balance payment | Outflow | Variable | Yes – negotiate extended terms |
| Inbound freight | Outflow | Variable | Somewhat – freight mode can change cost and timing |
| Duties and customs fees | Outflow | Variable | No – tied to shipment clearance |
| 3PL receiving and storage | Outflow | Variable | Somewhat – tied to inbound shipment dates |
| Payroll | Outflow | Fixed | No – legally and operationally fixed |
| Rent | Outflow | Fixed | No – lease obligation |
| Software subscriptions | Outflow | Fixed | Yes – can cancel or pause non-critical tools |
| Ad spend | Outflow | Variable | Yes – can reduce or pause campaigns |
| Loan / debt payments | Outflow | Fixed | No – contractual obligation |
| Estimated taxes | Outflow | Variable | Limited – statutory due dates |
Inventory outflows are often the fastest cash lever. After you collect these inputs, place them into weekly columns and carry cash forward in the spreadsheet.
Step 2: Build the 13-Week Template in a Spreadsheet
Now take that input list and turn it into a spreadsheet you can use every week. Keep it on one sheet with 13 weekly columns. The goal is simple: a one-sheet model you can update in minutes.
Set up weekly columns and row groups
Use 14 columns total:
- Column A for row labels
- Columns B through N for the 13 weekly periods
Label each weekly column with the Friday week-ending date in MM/DD/YYYY format. For example: 08/14/2026, 08/21/2026, 08/28/2026, and so on.
Put input rows above summary rows so formulas flow from top to bottom. Split supplier rows by payment terms so PO timing is easy to see week by week. If one supplier has different terms, give that supplier a separate row.
Freeze column A and the header row so your labels stay in view while you scroll. Format all dollar cells as $#,##0.
Add formulas that carry cash forward each week
Once the columns are set, the forecast runs on three linked calculations.
Use these formulas:
- Net Cash Movement = Total Inflows − Total Outflows
- Ending Cash = Beginning Cash + Net Cash Movement
- Liquidity Headroom = Ending Cash − Minimum Cash Reserve
Set Week 1 Beginning Cash to your actual bank balance. Then link each later week to the prior week’s Ending Cash. That way, cash rolls forward automatically instead of forcing you to rework the sheet by hand every Friday.
Protect formula cells so your weekly updates only touch input rows. It’s a small step, but it saves a lot of “Who changed this formula?” pain later.
Apply conditional formatting to the Liquidity Headroom row:
- Red when headroom is negative
- Yellow when it’s positive but under $10,000
- Green when headroom is at least $10,000
That color band makes the 13-week view easy to scan in seconds.
Template structure table with example rows
Use the structure below as your starting layout.
| Row Group | Sample Line Item | What to Enter Each Week |
|---|---|---|
| Beginning Cash | Beginning cash balance | Actual bank cash as of the starting Friday |
| Cash Inflows | Shopify payouts – US store | Expected Shopify deposits hitting your bank that week |
| Cash Inflows | Wholesale customer receipts – Net 30 | Cash collected from B2B customers whose invoices are due |
| Cash Outflows | Inventory deposits – Supplier A | Deposit payments to Supplier A per agreed terms |
| Cash Outflows | PO balance payments – Supplier B | Separate row for Supplier B to reflect different terms (e.g., Net 60) |
| Cash Outflows | Inbound freight – Port to 3PL | Freight charges payable to carriers or forwarders that week |
| Cash Outflows | Payroll – weekly payroll run | Payroll hitting your bank that week |
| Cash Outflows | Rent & utilities | Monthly rent and utility payments scheduled for that week |
| Summary | Total inflows | Formula: Total Inflows for the week |
| Summary | Total outflows | Formula: Total Outflows for the week |
| Summary | Net cash movement | Formula: Total Inflows − Total Outflows |
| Summary | Ending cash | Formula: Beginning Cash + Net Cash Movement |
| Risk Metrics | Minimum cash reserve | Your target floor (e.g., $50,000), repeated across all 13 weeks |
| Risk Metrics | Liquidity headroom | Formula: Ending Cash − Minimum Cash Reserve |
Don’t edit formula rows by hand. Every other row is an input row, so enter expected cash by week based on deposit date for inflows and due date for outflows.
Step 3: Connect Inventory Purchasing Decisions to Cash Timing
Use the weekly columns from Step 2 to map each PO to the exact week cash leaves your bank.
Schedule purchase orders, deposits, and freight into the right weeks
One overseas PO can trigger four separate cash hits. For example, you might pay a deposit in week 3, freight in week 5, the final balance in week 6, and receiving fees in week 7.
The key is simple: place each payment in the week it actually clears your bank.
That means breaking out costs like:
- Freight
- Duties
- Customs brokerage
- 3PL fees
If you lump those charges together, your cash view gets blurry fast. Split them by week so you can see when the money goes out, not just what the total order costs.
Test early buys versus delayed buys with simple scenarios
Run two simple versions of the plan. In one, move a major PO two to four weeks earlier. In the other, move it later by the same amount. Then compare ending cash in Weeks 1, 4, and 8.
Here’s the tradeoff:
- Earlier buys help protect inventory levels, but they put more pressure on near-term cash.
- Later buys keep more cash in the bank at first, but they increase stockout risk and the odds of paying for expedited freight.
Because Forstock links SKU-level demand, replenishment timing, and cash planning, you can see how one inventory move changes cash before you send the PO.
If either version pushes ending cash below your buffer, use Step 4 to decide whether to delay, reduce, or finance the order.
Purchase timing comparison table
Use the table below to weigh liquidity against stock availability before you commit.
| Factor | Order Earlier | Order Later |
|---|---|---|
| Fill rate | Higher - inventory arrives before demand peaks | Lower - risk of running out during peak weeks |
| Stockout risk | Low | Higher, especially with long lead times |
| Near-term cash impact | Larger outflows in weeks 1–4 | Outflows shift later, preserving early cash |
| Ending cash in week 4 | Lower | Higher |
| Ending cash in week 8 | Potentially higher if inventory is selling | Potentially lower if stockouts cut into sales |
| Expedited freight risk | Low | Higher if the delayed order needs air freight to catch up |
Step 4: Use the Forecast to Find Shortfalls and Act on Them
Flag low-cash weeks before they become a problem
Once your weekly template is set up, use it to spot cash risk before you place the next order.
Review the full 13-week forecast every Monday. Look for the lowest projected cash week, then pin down what's causing it. In most inventory businesses, the drop usually comes from one of a few places: a PO deposit, freight hitting at the wrong time, or customer receipts arriving after supplier, freight, or payroll payments.
Pay close attention to any week where ending cash:
- falls below your reserve
- sits at or just above that reserve
- drops fast after a PO, freight, or payroll payment
That quick review can save you from getting blindsided.
Pick the right response for each type of shortfall
For inventory businesses, the fix usually comes down to purchase timing, terms, or shipment size.
If cash is tight because you've bought too much, the cleanest move is often to delay or reduce the PO. If the problem is timing, meaning inventory is selling but the cash hasn't settled yet, short-term financing may work better as a bridge. And if collections are slow, focus there first before cutting inventory commitments.
Some direct options:
- delay or split a PO into smaller shipments
- negotiate longer supplier terms or a smaller deposit
- liquidate slow-moving inventory
- delay discretionary ad spend
- accelerate invoicing
If you're dealing with net-30 receivables, send reminders on days 7, 14, and 21, and make the first collection call on day 32.
When the shortfall ties back to inventory, go down to the SKU level. Check demand and replenishment timing to see which buys are soaking up cash. That's where Forstock helps - it connects SKU-level demand and replenishment timing to your cash plan so you can reprioritize purchases with real context, not guesswork.
Conclusion: Update the Forecast Weekly and Use It to Make Better Buys
Update the forecast every week. Add confirmed POs, refresh receipt timing, and keep the full 13-week view in front of you.
Use this response map:
| Intervention | Cash Impact | Operational Impact | Best Use Case |
|---|---|---|---|
| Delay or reduce PO | Improves near-term cash quickly | May risk stockouts if overused | Demand is uncertain or inventory is adequate |
| Negotiate supplier terms | Improves cash timing without cutting orders | Low to moderate | Strong supplier relationship, flexible terms |
| Accelerate collections | Improves cash quickly if receivables exist | Usually low | Outstanding B2B invoices |
| Move slow inventory | Converts trapped cash into liquidity | Can reduce assortment breadth | Aging or overstocked SKUs |
| Delay ad spend | Preserves cash by reducing discretionary outflows | May reduce near-term traffic | Core stock is healthy, cash is tight |
| Use financing deliberately | Covers a short-term gap | Adds cost and leverage | Shortfall is temporary and clearly modeled |
Use the forecast to guide weekly buying decisions before cash becomes the constraint.
FAQs
How accurate should a 13-week cash flow forecast be?
It should be accurate enough to give you a clear picture of short-term liquidity. That way, you can see cash constraints coming, catch shortfalls early, and adjust inventory purchases before small issues turn into bigger ones.
That level of accuracy comes down to the inputs. Use precise, up-to-date numbers and refresh the forecast every week. It also helps to check actual sales data and supplier lead times on a regular basis so the forecast stays a guide you can trust.
What should I include in my minimum cash buffer?
Your minimum cash buffer should cover three to six months of operating expenses. Set that money aside first, before you use the rest of your capital to buy inventory.
That buffer should include fixed costs like rent, salaries, insurance, loan repayments, and software subscriptions. It should also account for variable costs such as shipping, commissions, credit card fees, and marketing.
Why does this matter? Because inventory can soak up cash fast. And when your money is sitting on shelves or in transit, you still need enough on hand to handle short-term obligations and keep day-to-day operations moving.
How often should I update the forecast?
Update your 13-week cash flow forecast every week. That rolling rhythm lets you reflect day-to-day operating changes and make mid-quarter course corrections when cash starts to move in a different direction.
Handle inventory reviews on a broader schedule when it makes sense. For slower-moving items during quieter periods, a monthly check may be enough. But for trend-sensitive products or during busy seasons, review inventory weekly. And if the market shifts in a big way or something unexpected hits, update the forecast right away.
Keep reading
Try Forstock free for 14 days.
AI-powered demand forecasting and reorder automation for Shopify brands. No credit card required.