
.png)
.png)
Predictive analytics outperforms manual inventory planning by leveraging data and machine learning to optimize stock decisions. While manual methods rely on spreadsheets and human judgment, predictive systems analyze factors like sales trends, seasonality, and competitor pricing to increase accuracy and reduce costs.
Key Takeaways:
- Manual Planning: Simple, low-cost, but prone to errors and inefficiency. Best for small businesses with <50 SKUs.
- Predictive Analytics: Data-driven, scalable, and accurate. Reduces stockouts by up to 60% and holding costs by 15%.
Quick Comparison:
| Factor | Manual Planning | Predictive Analytics |
|---|---|---|
| Accuracy | 40–60% | 80–90% |
| Variables Processed | 1–2 (e.g., sales trends) | 40+ (e.g., weather, marketing) |
| Error Risk | High (8–12% error rate) | Low |
| Scalability | Limited (~50 SKUs) | Handles 1,000s of SKUs |
| Time Efficiency | Labor-intensive | Automates 80% of tasks |
Switching to predictive systems saves time, improves cash flow, and boosts revenue - ideal for businesses scaling beyond basic operations.

Predictive Analytics vs Manual Inventory Planning: Key Performance Metrics Comparison
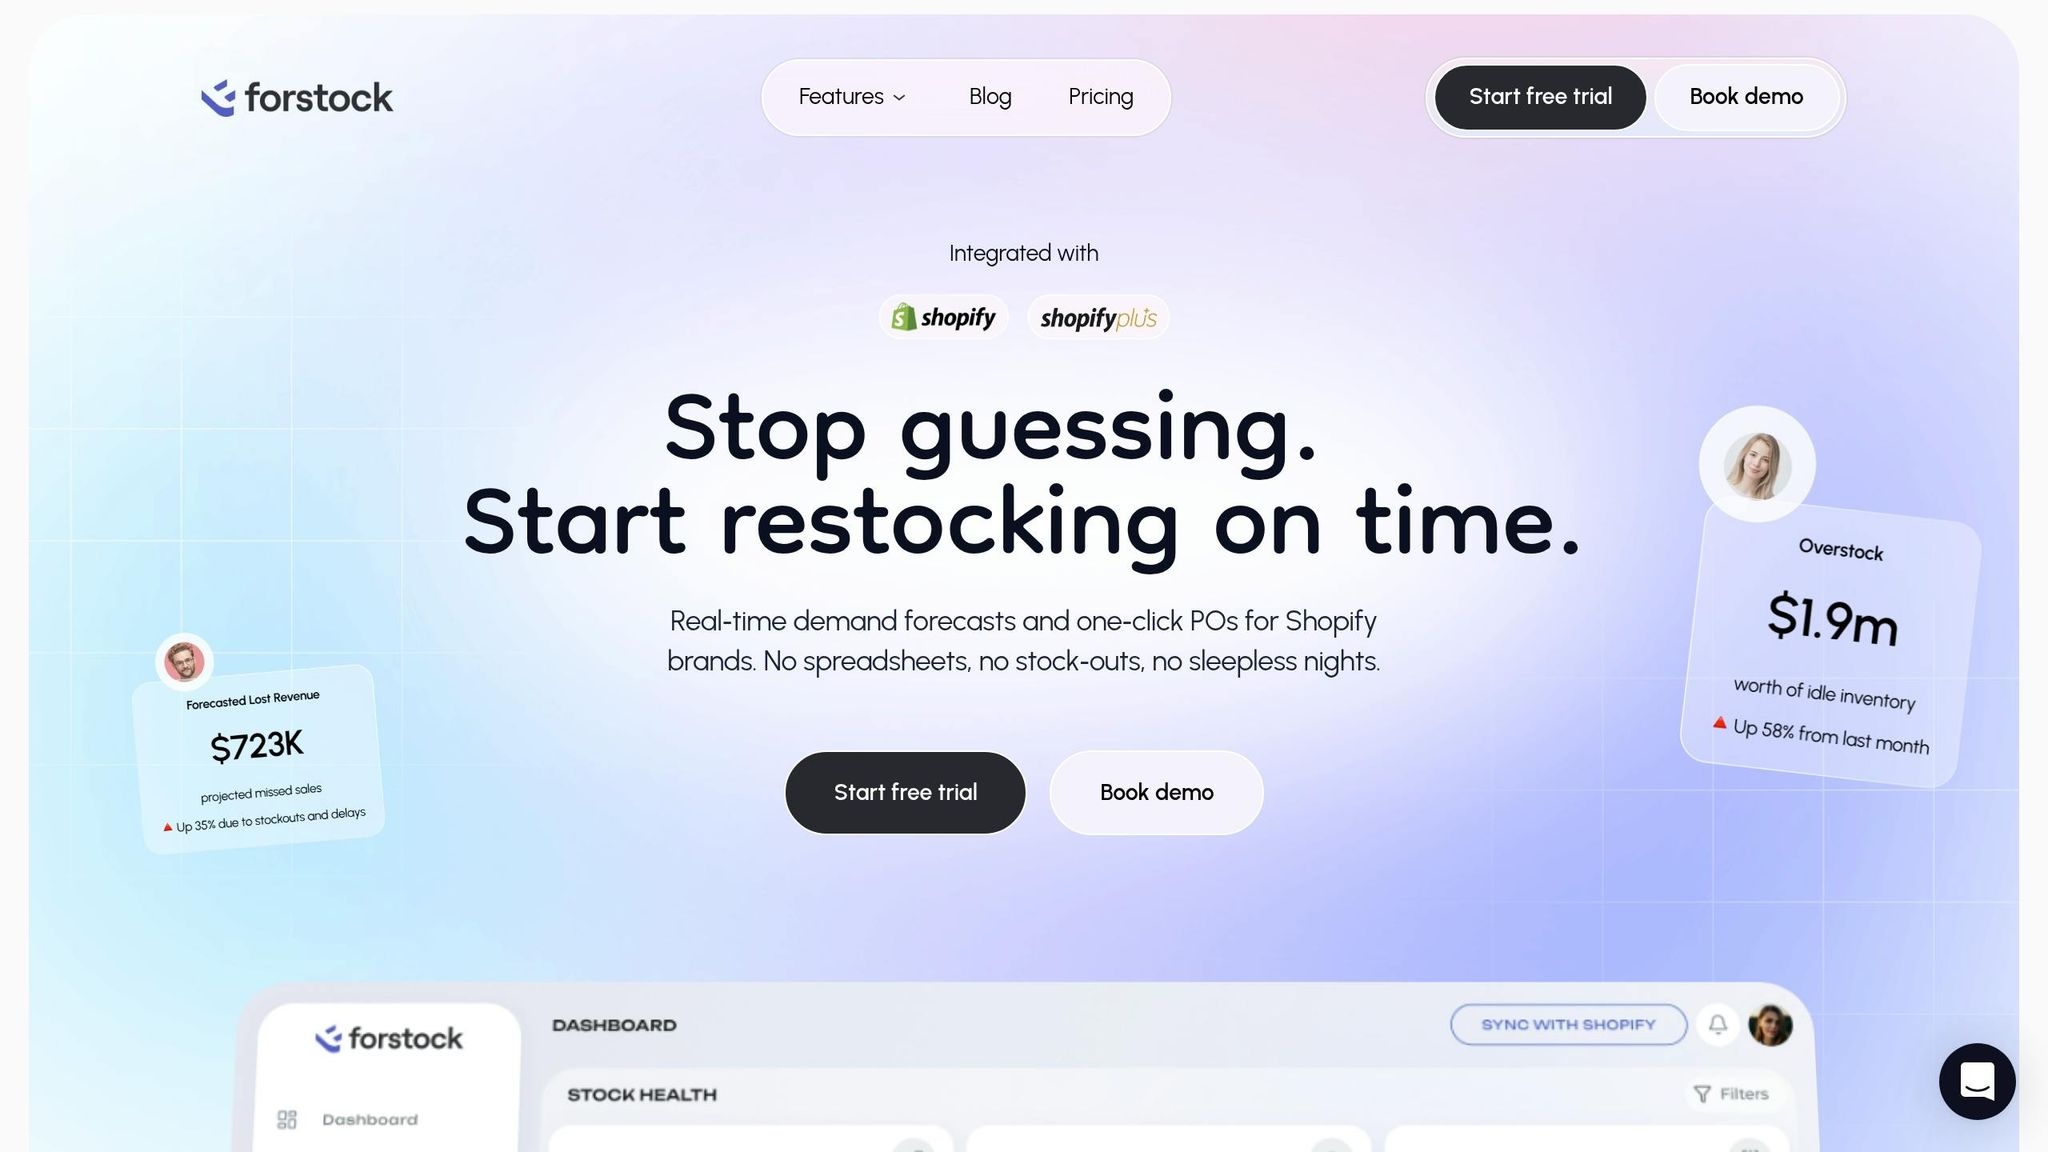
The Predictive Edge: Smarter Forecasts for Modern Retail
sbb-itb-f0fc809
What is Manual Inventory Planning?
Manual inventory planning is the old-school way of keeping track of stock. Instead of using fancy software, businesses rely on people, physical logs, or spreadsheets to handle inventory tasks like tracking stock levels, recording sales, and updating orders. Employees manually check shipments, count items, and log quantities. When products are sold, returned, or damaged, those changes are entered into the system. Regular stock checks - weekly or monthly - are done to compare the physical inventory with the records, helping to spot any errors.
This method is appealing because it has a low upfront cost - no expensive software or barcode scanners needed. It’s a practical choice for very small businesses, like a single shop with fewer than 50 SKUs. But here’s the catch: manual systems are reactive, not proactive. They rely on past data rather than giving you real-time insight into your inventory.
Key Characteristics of Manual Planning
Manual inventory planning depends heavily on static tools and human judgment. Spreadsheets, for instance, only show the last recorded data, which means they don’t reflect what’s currently on your shelves. This creates blind spots, especially during busy times when inventory moves faster than records can be updated. Reordering usually happens when someone notices the stock is running low, which can lead to last-minute scrambles, stockouts, or costly emergency shipments.
Another issue is human bias. Manual forecasting often falls prey to cognitive biases like recency bias, anchoring, or over-optimism. These can inflate forecasts by 15–25%. As Bahadır Efeoglu from Fabrikatör puts it:
"The spreadsheet era rewarded whoever had the best memory and the most patience. The AI era rewards whoever implements the right systems fastest."
Manual systems also don’t scale well. Tracking a few dozen products may be manageable, but as your business grows - adding SKUs or branching into new sales channels like Shopify or Amazon - the workload quickly becomes overwhelming. You might even need to hire extra staff just to handle the increased data entry and reconciliation.
Common Challenges with Manual Methods
The biggest downside of manual systems? Human error. Studies show that error rates in manual processes range from 8% to 12%. Even the most careful teams can make mistakes, with error rates as low as 1–2% still causing financial headaches as your business scales. A single typo or misplaced decimal in a spreadsheet can throw your entire inventory off balance.
Time consumption is another major drawback. Teams can spend 20–40 hours a month on repetitive tasks like data entry and reconciliation - time that could be better spent growing the business. If your team is spending more than five hours a week just fixing inventory discrepancies, that’s a warning sign.
Manual planning also fails to consider external factors. Things like competitor price changes, weather conditions, or marketing campaigns are often overlooked. This limited view can cause you to miss demand spikes, leading to lost sales. Globally, inventory distortion costs retailers $1.77 trillion annually, with stockouts alone accounting for $1 trillion in missed revenue. And when customers see an "out of stock" message, 69% will head straight to a competitor’s site to buy.
Lastly, manual methods can tie up your cash flow. Poor forecasting often results in excess inventory sitting in warehouses, raising storage costs by 20–30%. That’s money that could be better spent on launching new products or running marketing campaigns.
These challenges make it clear why manual inventory systems often fall short. To manage inventory effectively, businesses need to adopt more proactive, data-driven approaches.
What is Predictive Analytics in Inventory Management?
Predictive analytics uses data and machine learning to forecast demand, streamline inventory levels, and automate restocking decisions in real time. Instead of relying on static spreadsheets or gut feelings, it evaluates your sales history, lead times, seasonal patterns, and marketing data using algorithms to predict exactly what you’ll need - and when.
For Shopify brands, this means moving from reactive planning to a more dynamic approach. By integrating data from your store - like past sales, lead times, and marketing campaigns - predictive models identify trends and provide actionable insights. These tools generate SKU-level forecasts, reorder recommendations, and safety stock levels that adapt automatically to changing conditions. Essentially, it shifts inventory management from guesswork to a proactive, real-time system.
What makes predictive analytics stand out is its ability to account for external factors that manual methods often overlook. By 2025, 98% of companies reported incorporating AI into their supply chain operations. The results speak for themselves: AI-powered forecasting can cut errors by 20% to 50% and reduce lost sales by up to 65%.
How Predictive Analytics Works
The process involves three main steps. First, the system gathers data - everything from historical sales and seasonal patterns to marketing spend, competitor activity, economic indicators, and even weather trends. Then, it processes this data using time-series, regression, and ensemble models to forecast demand and optimize inventory. These optimization models consider factors like lead times, storage capacity, and service levels to determine the best stock levels.
Finally, the system generates automated outputs, such as SKU-level demand forecasts, recommended order quantities, reorder points, and safety stock levels. For example, it might adjust reorder thresholds for seasonal items, setting higher levels for summer products in April than in October. These outputs not only simplify inventory management but also lead to cost savings and smoother operations.
Take the case of Healf, a UK-based health and wellness retailer. By implementing an AI-driven platform for forecasting, they achieved a 75× return on investment within six months. Analyzing historical sales, seasonality, and channel data from their Shopify store and retail partners helped them reduce stockouts for key products and improve cash flow by avoiding overstock on slower-moving items.
Benefits of Predictive Analytics
Predictive analytics provides clear advantages over traditional forecasting methods. The most immediate benefit is better accuracy. Machine learning models typically achieve 70% to 90% accuracy, whereas manual methods often fall between 50% and 65%. This translates to a Mean Absolute Percentage Error (MAPE) of less than 25%, compared to 35% to 50% for manual approaches.
Improved accuracy has a direct impact on reducing stockouts by 30% to 50% and overstock by 20% to 35%, which significantly boosts profitability. Inventory distortion costs the global retail industry $1.77 trillion annually, with $1 trillion lost to stockouts alone. And since 69% of customers will immediately turn to a competitor after encountering an "out of stock" message, minimizing stockouts is crucial.
Another major benefit is better cash flow. AI’s precision typically lowers inventory holding costs by 20% to 30%, freeing up funds for marketing, product development, or scaling up. On top of that, businesses using AI forecasting save up to 80% of the time they’d otherwise spend on planning and forecasting tasks, allowing them to focus more on growth.
As Nicholas Fiorentino from StockPerfect.ai explains:
"AI-powered inventory forecasting isn't just a technological upgrade - it represents a fundamental shift in how Shopify merchants can approach inventory management."
Key Differences Between Predictive Analytics and Manual Inventory Planning
The difference between manual planning and predictive analytics boils down to how much data each can handle and how quickly they adapt to change. Manual planning typically relies on spreadsheets and intuition, factoring in just one or two variables - like recent sales trends and a planner's gut feeling. On the other hand, predictive analytics can process dozens of variables at once, including weather patterns, social media sentiment, competitor pricing, and marketing calendars. This stark contrast in data processing sets the stage for deeper differences in bias and scalability.
Biases play a major role in separating these methods. Manual planners often fall prey to cognitive biases like recency, anchoring, and optimism, which can lead to demand overestimations of 15–25%. Operations expert David Vance highlights this issue:
"Your gut feeling told you to order 500. The right number was 340. Your gut was off by 47%."
Predictive analytics sidesteps these biases entirely, relying solely on data rather than subjective judgment.
Scalability is another key differentiator. Manual methods might work for small catalogs of around 50 SKUs, but they quickly become unmanageable as businesses grow. Managing thousands of SKUs across multiple channels with spreadsheets often forces companies to group data at the category level, sacrificing critical SKU-level insights. Predictive analytics, however, handles thousands of SKUs with ease, maintaining accuracy and speed whether you're managing 50 or 50,000 products. This scalability becomes even more critical in fast-changing markets.
Adaptability is also a major advantage of predictive systems. Manual forecasts are static and can become obsolete as soon as market conditions shift. Adjusting these forecasts during promotions, supply chain disruptions, or unexpected demand spikes can take weeks or even months. Predictive models, by contrast, retrain automatically as new data comes in, detecting changes within days instead of months. They also handle complexities like "false zeros" - days with no sales due to stockouts rather than low demand - by identifying and excluding these anomalies to keep forecasts accurate.
Comparison Table: Predictive Analytics vs. Manual Inventory Planning
| Factor | Manual Inventory Planning | Predictive Analytics (AI) |
|---|---|---|
| Accuracy | 45–60% (often off by 40%+) | 75–90% (errors reduced by 20–50%) |
| Data Inputs | Historical sales & gut feeling | Sales, weather, trends, competitor prices, marketing data |
| Variables Processed | 1–2 variables at a time | 40+ variables simultaneously |
| Scalability | Breaks down at ~50 SKUs | Handles thousands of SKUs across channels |
| Time Efficiency | 60–80% of time on manual entry | 80% spent on strategy and analysis |
| Error Risk | High (8–12% data entry error rate) | Low (minimal human error through automated data integration) |
| Market Response | Reactive (weeks to months to adjust) | Dynamic (adjusts in real-time or days) |
| Decision Speed | Days to weeks (manual reconciliation) | Real-time (minutes) |
For a seller managing 500 SKUs and generating $2 million annually, switching from manual planning to AI-based forecasting could recover $60,000 to $120,000 in lost sales each year. Traditional forecasting methods often require analysts to spend 60–80% of their time on manual data collection, while AI shifts 80% of that effort toward strategic decision-making. Austin Gardner-Smith from Drivepoint encapsulates this shift perfectly:
"Traditional forecasting relies on manual processes and historical patterns, while AI-based forecasting uses machine learning to process real-time data from multiple sources for predictions that reduce forecast errors by 20–50%."
Performance Metrics and Results
Predictive analytics achieves forecast accuracy rates of 75% to 85%, significantly outperforming manual, intuition-based planning, which typically falls between 45% and 60% accuracy.
Stockout rates see dramatic improvements with predictive systems. While manual planning can leave 8% to 15% of SKUs out of stock, AI-driven forecasting cuts that down to just 2% to 5%. This reduction protects revenue, as the average retail company loses about 10% of annual sales due to stockouts. For example, Walmart's AI-enhanced inventory system not only reduced stockouts by 25% but also lowered overall inventory levels by 10%, resulting in considerable cost savings.
Overstock issues also diminish with predictive analytics. Manual methods often lead to 20% to 30% of SKUs being overstocked, while predictive systems bring that number down to 8% to 12%. Zara provides a compelling example: by using AI to analyze real-time sales data and predict demand trends, the company reduced inventory levels by 20%. This not only enhanced customer satisfaction but also minimized markdowns. Considering that overstocking can result in financial losses of up to 30% of total inventory value, these improvements are crucial.
The financial benefits are equally striking. Predictive analytics helps businesses recover lost sales, cut carrying costs, and reduce dead stock write-offs. For mid-sized operations, this translates into annual savings ranging from $95,000 to $188,000. Additionally, inventory turnover ratios improve significantly, jumping from an average of 4.6 to 7.5.
Operations expert David Vance highlights the accuracy advantage of predictive systems:
"Your gut feeling told you to order 500. The right number was 340. Your gut was off by 47%. An AI model... would have been off by less than 3%".
This level of precision leads to better cash flow, fewer emergency orders, and more capital available for growth. It’s no wonder many Shopify brands are turning to predictive analytics to optimize operations and boost profitability.
When to Choose Predictive Analytics Over Manual Planning
Predictive analytics becomes indispensable when businesses face increasing complexity, rapid growth, and dynamic market conditions. While manual planning works well for smaller operations with straightforward catalogs, it quickly falls short as a Shopify brand scales. Once your catalog surpasses 100 SKUs, the time and resources spent on predictive tools often pay off within the first month. Beyond that point, handling numerous variables - like competitor pricing, weather trends, or social media sentiment - manually becomes overwhelming and inefficient. The need for speed and precision grows as operations expand.
Rapid growth exposes the limits of manual methods. If you're introducing new product lines, managing multiple sales channels, or experiencing seasonal spikes of 200% to 300%, manual forecasting can't keep up. Accuracy is another factor: manual planning typically achieves 45–60% accuracy, while predictive analytics boosts this to 75–90%. This difference directly impacts both revenue and operational efficiency.
When brands operate across multiple channels, having real-time, unified insights becomes critical. Selling through online stores, retail locations, and marketplaces demands a level of integration that spreadsheets simply can't provide. For instance, Rebecca Minkoff uses RFID tags in their inventory system to track stock with 99% accuracy. Similarly, Oak + Fort improved efficiency by saving 50 hours of labor each week and cutting operating costs by 47% through integrated inventory management systems.
High return volumes also call for automation. In 2024, 16.9% of U.S. retail goods were returned, amounting to roughly $890 billion in merchandise. Manual processes struggle to manage such volumes effectively. Predictive analytics, on the other hand, can automatically reintegrate sellable stock and update forecasts in real time. This capability is especially crucial during peak seasons, as November and December alone can account for 19% of annual sales.
That said, manual planning still has a role when dealing with new products that lack sales history. AI models typically need 4 to 8 weeks of data to deliver reliable insights. A hybrid approach works best in these cases: rely on manual judgment for initial orders, then transition to predictive analytics once sufficient data is available. For everything else - whether it’s managing complex SKUs, navigating seasonal demand fluctuations, or handling catalogs with over 100 items - predictive analytics becomes a must-have tool.
How Forstock Implements Predictive Analytics for Shopify Brands
Forstock takes the power of predictive analytics and integrates it seamlessly with your Shopify store. The setup is quick - just two minutes. All you need to do is connect your store, import your sales data, and let the AI do its thing. From there, the platform syncs your orders, products, and inventory in real time. This ensures that every sale, return, and inventory adjustment is accounted for, keeping your forecasts up-to-date as your business changes.
At the core of Forstock is its AI-driven forecasting engine, which dives deep into your Shopify sales history, analyzing data at the SKU level. It considers key factors like seasonality, growth trends, and sales velocity for each product. Unlike opaque "black-box" systems, Forstock makes its predictions transparent, showing the reasoning behind its recommendations - like why you should reorder certain products now instead of later. For new items with no sales history, the platform uses an intelligent bootstrapping method to provide reliable forecasts. This approach has helped brands improve forecast accuracy by 28% and reduce stockouts by 75%.
"Forstock has been great. We're preventing stockouts that were costing us $50K monthly. The AI predictions are incredibly accurate."
- Matt, Operations Lead at TechGear
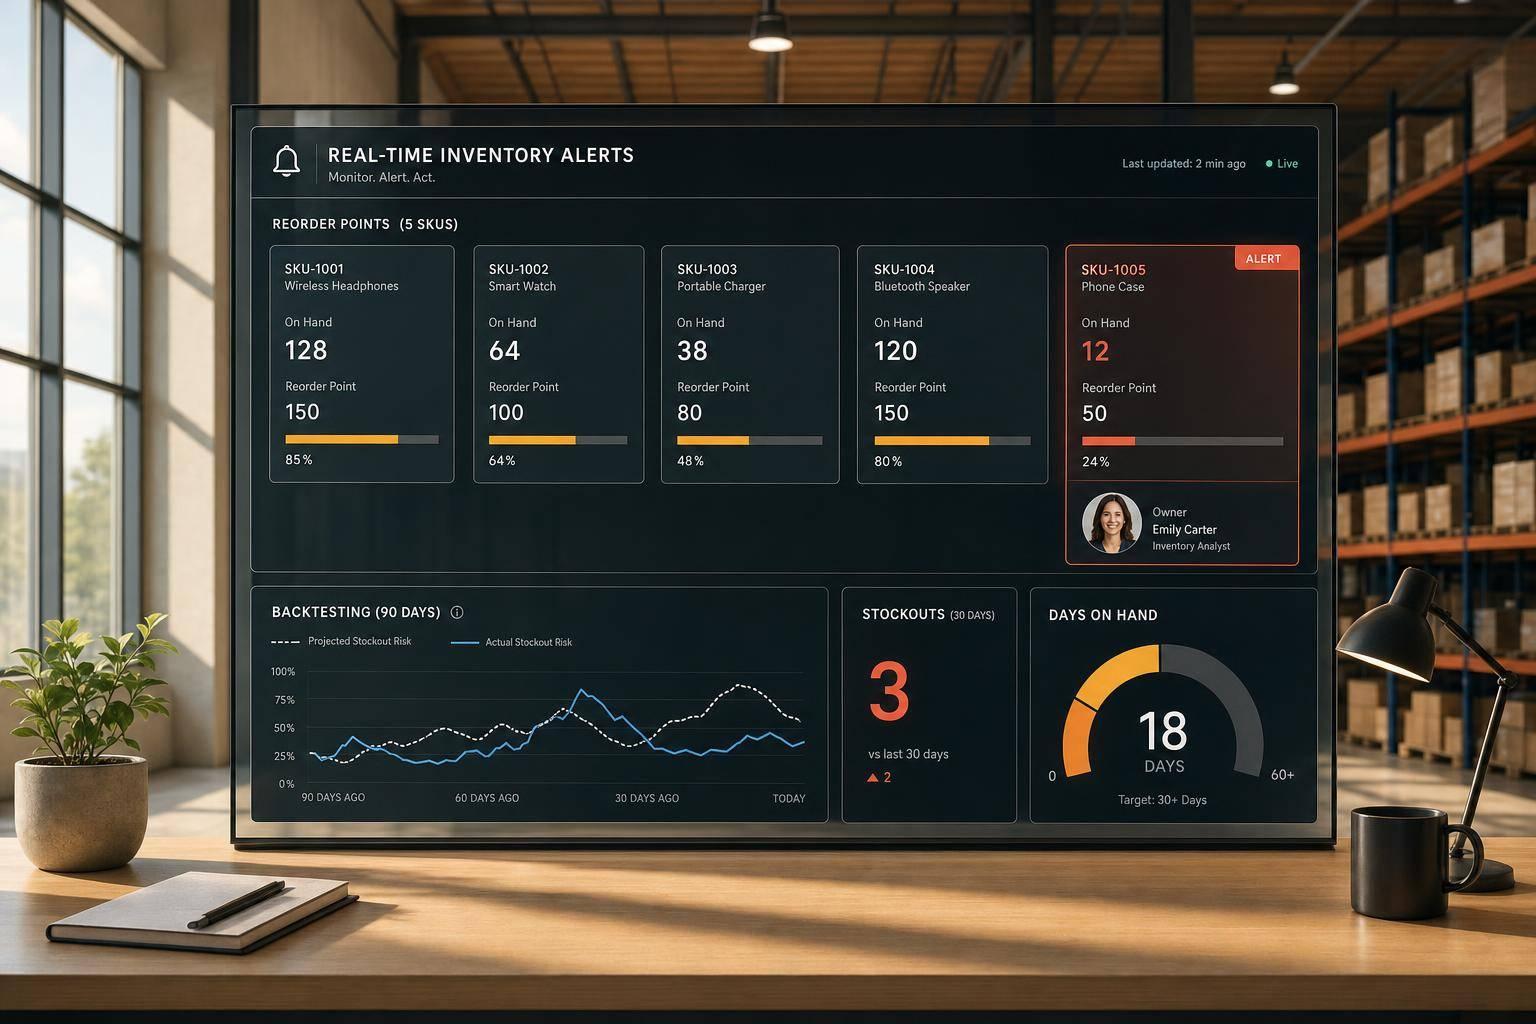
Forstock's detailed forecasts are presented in a centralized dashboard, offering actionable insights to simplify inventory management. The dashboard tracks inventory and supplier performance across all locations, making it easy to monitor stock health. Features like the "Reorder Table" prioritize products at risk of running out, using real-time sales velocity and supplier lead times to guide your decisions. Categories such as "Stock Gap" and "Running Low" make daily inventory management straightforward, while landed cost calculations account for shipping and customs, ensuring precise budgeting.
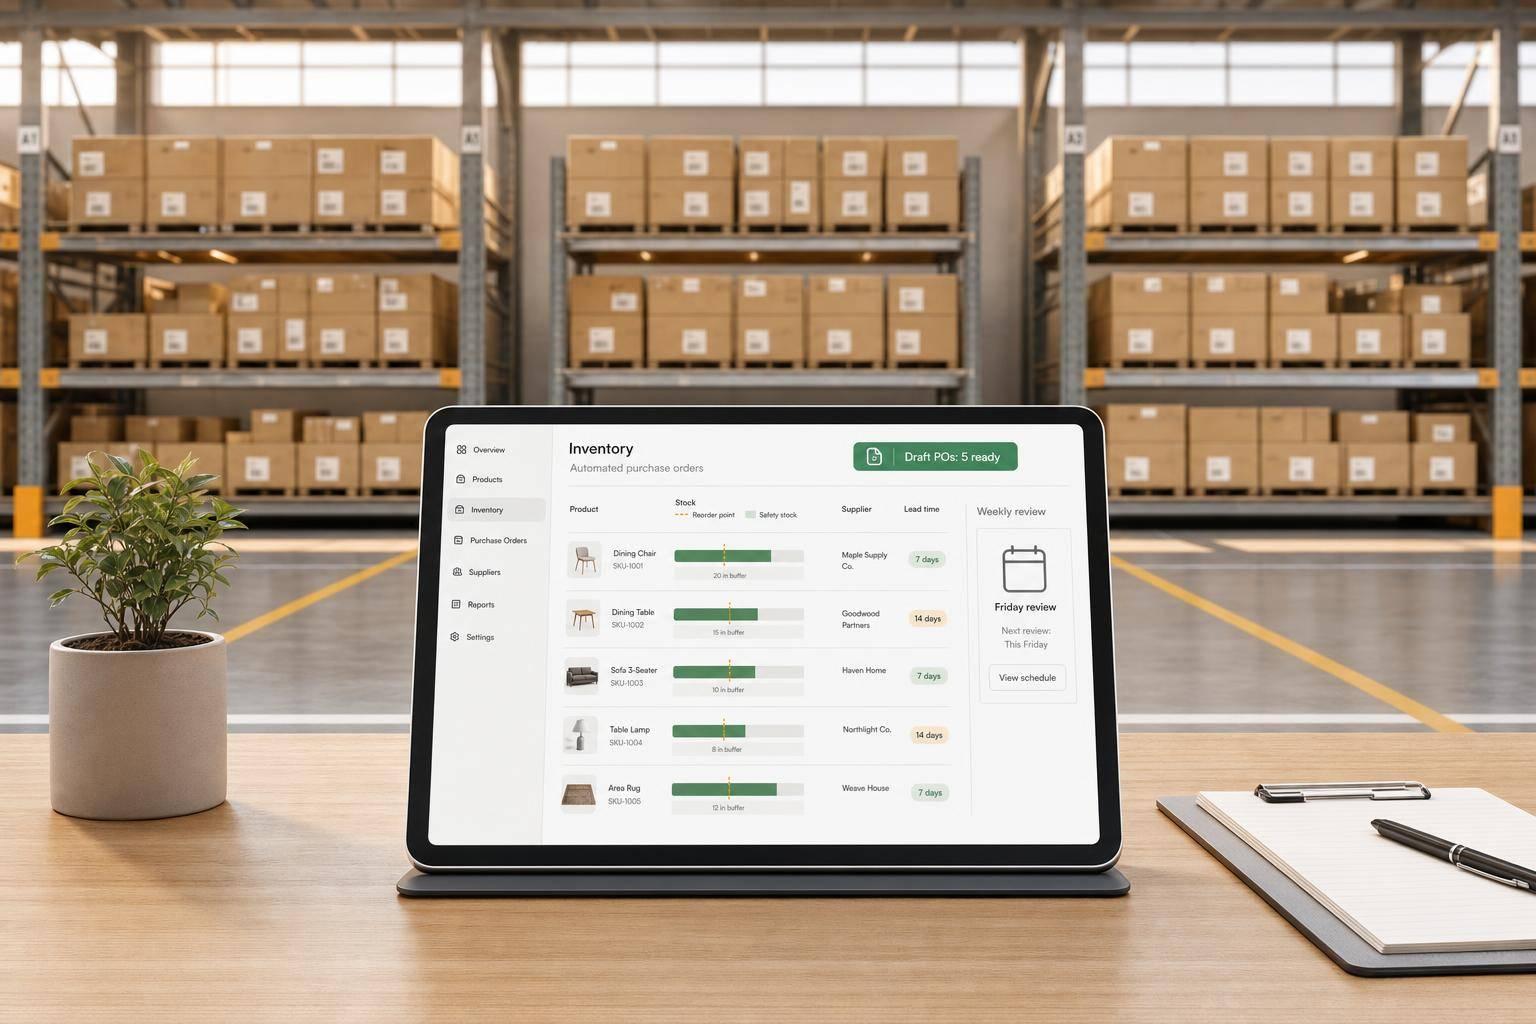
The platform also automates purchase order (PO) creation, turning forecasts into actionable steps. It calculates the ideal order quantities by factoring in lead times, current stock levels, and projected demand. With just one click, merchants can generate, split, and track purchase orders in minutes.
"The automated PO creation saves us 10+ hours weekly. Setup was seamless - just 2 minutes!"
- Alexander, Supply Chain Manager at FashionCo
"We reduced excess inventory by 45% and freed up $150K in working capital."
- Jason, Co-founder at HomeGoods
Forstock further streamlines operations by centralizing supplier communication. Merchants can track order status, monitor supplier performance, and communicate directly through the dashboard, eliminating the need for multiple tools. This efficiency reduces manual inventory tasks by at least 60%, freeing up valuable time for strategic growth. For businesses with multiple locations, the platform consolidates forecasts and purchase orders across all sites, avoiding duplication and ensuring optimal stock levels.
Conclusion
Switching to predictive analytics instead of relying on manual planning is a smart move for businesses looking to stay ahead. As we've seen, manual forecasting methods - rooted in spreadsheets, gut feelings, and outdated averages - simply can't keep up with the fast-paced demands of modern markets. Predictive analytics, on the other hand, analyzes dozens of factors simultaneously, like seasonality, pricing trends, marketing efforts, and supply chain disruptions, delivering far more accurate results.
The financial benefits are hard to ignore. Companies using AI-driven forecasting report impressive results: 20–30% reductions in inventory holding costs, 15–25% fewer stockouts, and 35–40% less obsolete inventory. For instance, a Shopify brand making $2 million a year could recover $60,000–$120,000 in lost sales and save $25,000–$45,000 in carrying costs annually. Plus, automation slashes forecasting time by up to 80%, giving teams more time to focus on scaling their business instead of being bogged down by manual tasks.
"AI-powered inventory forecasting isn't just a technological upgrade - it represents a fundamental shift in how Shopify merchants can approach inventory management." - Nicholas Fiorentino, StockPerfect
These results highlight why predictive analytics isn't just an improvement - it's a game-changer. Platforms like Forstock make this transition accessible to Shopify merchants of all sizes. With a quick two-minute setup, real-time data syncing, and straightforward AI-driven recommendations, Forstock removes the guesswork from inventory management.
The message is clear: embracing predictive analytics isn’t just about keeping up; it’s about gaining a competitive edge. Merchants who adopt data-driven tools can take control of their inventory strategy and unlock new opportunities. The real question is: How soon can you make the switch?
FAQs
What data do I need to start predictive inventory forecasting?
To kick off predictive inventory forecasting, start by collecting accurate and comprehensive data. This includes information on historical sales, seasonal patterns, customer purchasing habits, and logistics details like delivery schedules and transportation expenses. Reliable and well-organized data is the backbone of precise demand predictions.
For more advanced forecasting, models like ARIMA or LSTM are invaluable. However, they need consistent updates to stay effective. With this approach, you can fine-tune stock levels and better match your inventory to actual demand trends.
How do I know when spreadsheets are no longer enough for planning?
Spreadsheets often struggle when inventory becomes more complex, scales up, or faces unpredictable demand. Their reliance on outdated data and manual inputs can lead to mistakes, delays, and inefficiencies. These issues might cause stockouts, overstocking, or even financial setbacks. For businesses handling large inventories or navigating rapidly shifting supply chain conditions, modern AI-powered tools offer a better solution with real-time updates and precise forecasting.
How long does it take AI forecasts to become reliable for my SKUs?
AI-based forecasts typically reach a high level of reliability within just a few months. During this period, models process sales trends, demand patterns, and various external factors. This approach can achieve accuracy rates as high as 95%, offering a noticeable edge over traditional manual forecasting methods.
.png)
.png)
.png)
.svg)