How to Measure ROI on Inventory Investments
Learn to calculate GMROI, inventory turnover and DSI to measure inventory profitability, cut stockout/overstock costs, and improve cash flow.

How to Measure ROI on Inventory Investments
Measuring inventory ROI is essential for knowing if your stock investments are profitable. Here's the short version: ROI metrics like GMROI (Gross Margin Return on Investment) help you see how much profit your inventory brings in for every dollar spent. A GMROI above $1.00 means you're making money, while anything below signals trouble.
Inventory issues like overstocking or stockouts cost retailers over $1.7 trillion annually, so tracking ROI ensures smarter decisions, better cash flow, and higher profits. To calculate GMROI, follow these steps:
- Calculate Total Inventory Costs: Include purchase, shipping, storage, and hidden costs like labor and insurance.
- Find Gross Profit: Subtract Cost of Goods Sold (COGS) from revenue.
- Determine Average Inventory Value: Average your beginning and ending inventory for a specific period.
- Plug Into the GMROI Formula: Divide gross profit by average inventory cost.
For example, if your gross profit is $325,000 and your average inventory cost is $120,117, your GMROI is $2.70 - meaning $2.70 profit for every $1 spent on inventory.
Metrics like Inventory Turnover Ratio and Days Sales of Inventory (DSI) can also highlight inefficiencies. Automating ROI tracking with tools like Forstock saves time and ensures accurate, real-time insights, helping you focus on profitable products and cut losses from dead stock.
Key takeaway: Regularly monitor your inventory ROI to avoid costly mistakes, improve cash flow, and grow your business.
Inventory turnover for ecommerce sellers | How to calculate and optimize
How to Calculate Inventory ROI
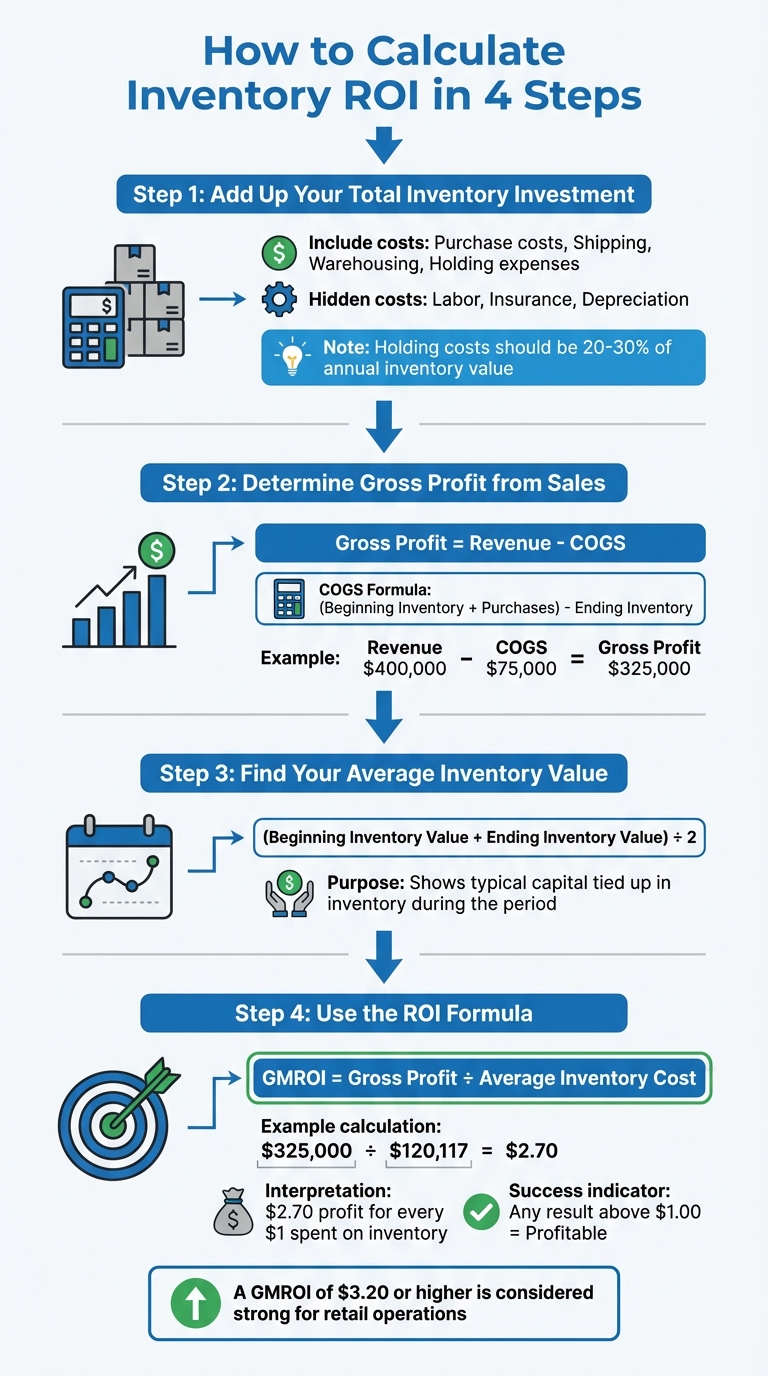
4-Step Process to Calculate Inventory ROI Using GMROI Formula
When it comes to measuring inventory ROI, GMROI is the go-to metric. It helps you understand how much profit you're making for every dollar spent on inventory. The formula? Simple: GMROI = Gross Profit / Average Inventory Cost. Here's how to break it down into four easy steps.
Step 1: Add Up Your Total Inventory Investment
Start by tallying up all the costs tied to inventory. This includes purchase costs, shipping, warehousing, and holding expenses. Don’t forget those hidden holding costs like labor, insurance, and depreciation - they can add up quickly. Ideally, these should fall between 20% and 30% of your inventory's annual value. Getting this number right is the foundation for accurate ROI calculations. This process is significantly more efficient when comparing manual vs. automated inventory systems.
Step 2: Determine Gross Profit from Sales
Gross profit shows what’s left after subtracting your Cost of Goods Sold (COGS) from total revenue. To calculate COGS, use this formula: (Beginning Inventory + Purchases) - Ending Inventory. For example, if your revenue is $400,000 and your COGS is $75,000, your gross profit would be $325,000. This figure highlights the actual earnings from the products you sold.
Step 3: Find Your Average Inventory Value
To calculate average inventory value, take the beginning inventory value and ending inventory value for a specific time period, then divide by two. This gives you a snapshot of the typical amount of capital tied up in inventory during that period.
Step 4: Use the ROI Formula
Now, divide your gross profit by the average inventory cost. For instance, Sarah's Family Clothing calculated $325,000 in gross profit divided by an average inventory cost of $120,117, resulting in $2.70. This means the business made $2.70 in profit for every dollar spent on inventory. Any result above 1.0 indicates profitability. If you prefer, multiply the result by 100 to convert it into a percentage for easier communication with stakeholders.
| Metric | Formula | Purpose |
|---|---|---|
| Gross Profit | Revenue - COGS | Shows the earnings after covering variable costs |
| COGS | (Beginning Inventory + Purchases) - Ending Inventory | Calculates the direct cost of sold goods |
| Average Inventory | (Beginning Value + Ending Value) / 2 | Reflects the typical stock value held |
| GMROI | Gross Profit / Average Inventory Cost | Measures profit per dollar of inventory |
If you're a Shopify user, you can find these metrics conveniently in the "Profit by product" report.
Key Metrics That Improve ROI Measurement
To go beyond just calculating ROI, it's essential to track specific metrics that provide deeper insights into inventory performance. These metrics can help you pinpoint inefficiencies, prevent profit loss, and uncover ways to free up cash.
Inventory Turnover Ratio
The Inventory Turnover Ratio shows how often you sell and replenish your inventory within a set period, typically a year. To calculate it, divide your Cost of Goods Sold (COGS) by your average inventory value. For example, if your COGS is $490,000 and your average inventory is $55,000, your turnover ratio is 8.9. This means you went through your inventory nearly nine times during the year.
A higher turnover ratio indicates strong sales and efficient inventory management. This can boost ROI by minimizing the capital tied up in stock and reducing holding costs like warehousing and insurance. The average turnover ratio in retail is 10.86, but it varies widely by industry. Grocery stores, for instance, often see 12 to 15 turns annually due to perishables, while furniture retailers may aim for just 3 to 4 turns.
"Your goal is to rotate inventory as much as possible to maximize profits." - Shopify
Shopify offers tools like the "Percent of inventory sold" report to help merchants track turnover and identify which products sell quickly versus those that lag. To improve your turnover ratio, you can try strategies like bundling products, running flash sales to clear out slow-moving inventory, or adopting a just-in-time inventory system to reduce carrying costs.
Another critical metric to consider is how long your inventory stays unsold, which is where Days Sales of Inventory comes into play.
Days Sales of Inventory (DSI)
Days Sales of Inventory (DSI) measures how long, on average, it takes to turn inventory into cash. The formula is: (Average Inventory / COGS) × 365. Most retailers aim for a DSI between 30 and 60 days.
A high DSI suggests that inventory is sitting too long, tying up cash and increasing holding costs like storage, labor, and depreciation. This can be due to overstocking, slow sales, or poor product placement. On the other hand, a low DSI reflects faster sales and quicker cash flow, though an extremely low DSI might lead to stockouts.
For instance, with an average inventory of $55,000 and a COGS of $490,000, your DSI would be about 41 days - indicating that it takes just over a month to sell your inventory.
If your DSI is consistently high, you might need to lower inventory levels to cut storage and staffing costs. Marketing tactics like discounts or referral programs can also help move slow stock faster. Additionally, using historical sales data for forecasting can help you avoid overproduction and maintain optimal stock levels.
With turnover and sales timing covered, it’s important to also look at how stockout and overstock costs affect your ROI.
Stockout and Overstock Costs
Stockouts lead to immediate losses in revenue, potential long-term customer churn, and operational issues like canceled orders and manual inventory corrections. These issues can cost up to 8% of revenue, and 91% of customers affected by stockouts may turn to competitors.
On the flip side, overstocking ties up capital and incurs costs like warehousing, insurance, and depreciation. It also increases the risk of product obsolescence. Ideally, holding costs should stay within 20% to 30% of your inventory's annual value. Both stockout and overstock costs impact Gross Margin Return on Investment (GMROI) by either cutting into sales or inflating expenses.
"Inventory distortions - the combined cost of out-of-stock and overstocked items - cost retailers over $1.7 trillion globally each year." - IHL Group
Interestingly, 70% to 90% of stockouts are due to poor replenishment processes rather than actual supply shortages. To minimize these costs, you can use ABC analysis to categorize inventory by value: high-value (A), moderate-value (B), and low-value (C). For A items, aim for 98-99% service levels to avoid costly stockouts, while keeping minimal stock for C items to reduce overstock expenses. Automating reordering with real-time data and safety stock formulas can also help.
| Metric | Stockout Costs | Overstock Costs |
|---|---|---|
| Primary Impact | Lost revenue and customer churn | Tied-up capital and storage fees |
| Hidden Costs | Brand damage and support labor | Obsolescence and depreciation |
| ROI Effect | Reduces ROI by lowering sales | Reduces ROI by increasing costs |
| Solution | Better replenishment and safety stock | Improved forecasting and ABC segmentation |
sbb-itb-f0fc809
Tools and Methods to Automate ROI Tracking
Managing ROI manually with spreadsheets can quickly become overwhelming as your SKU list grows. Tasks like exporting CSV files, entering data by hand, and reconciling numbers at the end of the month are time-consuming and prone to errors. These mistakes can distort your ROI calculations, making it harder to make informed decisions. Automation changes the game by replacing these delays and inaccuracies with real-time, synchronized data across all your sales channels. Instead of waiting until the end of the month, you can immediately see which products are driving profits and which are eating into your budget.
Using Forstock for Real-Time ROI Insights
Forstock offers a solution to the headaches of manual tracking by integrating directly with Shopify. It provides a centralized dashboard that monitors stock levels, sales trends, and profitability metrics automatically. The platform uses AI-based forecasting to analyze historical sales, seasonal patterns, and consumer behavior, helping you predict future stock needs and avoid costly issues like overstocking or running out of inventory.
One of Forstock's standout features is its ability to instantly calculate complex metrics like GMROI (Gross Margin Return on Investment) at the SKU or color-variant level. This eliminates the need for manual calculations and allows you to quickly identify your most profitable products. You can then adjust your purchasing strategies to focus on high-performing items. The platform also automates purchase orders based on preset stock thresholds, ensuring you maintain the right balance between safety stock and excess inventory.
Another useful tool is Forstock's inventory aging reports, which categorize stock by age - such as 0–30 days, 31–60 days, and beyond. These reports help you spot dead stock before it sits for 180 days and becomes a total loss. Additionally, supplier management features track lead times and quality, giving you the insights needed to negotiate better deals or switch to more reliable suppliers.
Manual Tracking vs. Forstock Automation
Switching to an automated system like Forstock can transform your workflow by delivering accurate ROI insights instantly. Here's how Forstock stacks up against traditional spreadsheet tracking:
| Feature | Manual Spreadsheet Tracking | Forstock Automation |
|---|---|---|
| Data Accuracy | Low; prone to human entry errors | High; real-time sync across all channels |
| Time Efficiency | High labor cost; hours spent on reconciliation | Low labor cost; updates happen automatically |
| Update Frequency | Monthly or Quarterly | Real-time / Instant |
| Forecasting | Reactive; based on basic historical averages | Proactive; AI-driven predictive modeling |
| ROI Visibility | Broad; usually calculated for the whole store | Granular; SKU-level GMROI and aging reports |
Forstock's pricing starts at $39 per month and includes a 14-day free trial along with live-chat support. By automating your inventory management, the platform eliminates the blind spots that come with manual reconciliation. It ensures your inventory records are updated instantly across all channels, letting you base your purchasing decisions on accurate, up-to-date data instead of outdated estimates.
"Inventory metrics are the difference between guessing and knowing - the essential key performance indicators (KPIs) that provide real-time knowledge." - Shopify Staff
How to Interpret and Improve Your Inventory ROI
Once you've calculated your ROI, the next step is to interpret those numbers and use them to make smarter business decisions. A GMROI (Gross Margin Return on Investment) above $1.00 shows you're making a profit, but a GMROI of $3.20 or higher is considered strong and indicates a healthy retail operation. For context, convenience stores average $6.69, electronics hover around $6.21, and furniture lands closer to $2.50.
ROI Benchmarks for Shopify Merchants

Shopify merchants should aim for an overall ROI of 15%–30% and an inventory ROI between 50%–150%, depending on how quickly stock turns over. Since inventory typically accounts for 70%–80% of a retailer's total assets, even small improvements in ROI can unlock significant cash flow. For example, if your sporting goods category has a GMROI of $1.50 but the industry average is $2.10, it might be time to reevaluate your pricing strategies, supplier terms, or product assortment.
With these benchmarks in mind, take a closer look at how your individual SKUs are performing to uncover opportunities for improvement.
Finding and Fixing Low-Performing SKUs
Start with an ABC analysis to categorize your inventory:
- "A" items: The top 10–20% of SKUs that generate 70–80% of your revenue.
- "B" items: Moderate performers that contribute a smaller but still important share.
- "C" items: Low-volume products that often linger in stock.
To spot underperformers, use metrics like the Sell-Through Rate. For instance, a product with a 12% sell-through rate compared to your bestsellers at 80% clearly needs attention. Similarly, a GMROI below $1.00 signals that every dollar invested in that product isn’t yielding enough profit.
Here are some strategies to deal with low-performing SKUs:
- Run markdowns or clearance sales to free up cash tied to stagnant inventory.
- Bundle slow-moving items with popular products to boost sales.
- Negotiate returns with suppliers for unsold stock or donate items for potential tax benefits.
By focusing on your "A" items - the ones that generate the most profit - you can allocate resources more effectively.
Improving ROI with Forstock Forecasting
Forstock’s AI-powered forecasting tool takes the guesswork out of inventory management. It predicts demand and automates reordering using a simple formula: (Daily Sales × Lead Time) + Safety Stock. The platform also provides inventory aging reports, which group stock by time on hand (e.g., 0–30, 31–60, or 61–90 days), helping you flag potential deadstock before it hits the 180-day mark.
Forstock goes further by offering supplier scorecards, which track metrics like lead-time reliability and product quality. This data helps you identify dependable suppliers and negotiate better terms. With all this information centralized in one dashboard, you can redirect capital from underperforming products to those that drive profits.
Conclusion
Measuring inventory ROI goes beyond just crunching numbers - it's about identifying which products drive profit and which ones drain your resources. Since inventory often accounts for the majority of a business's assets, even small improvements in how you manage it can free up significant capital and improve profitability.
The stakes are massive. Inventory distortions - caused by stockouts and overstock - cost retailers over $1.7 trillion globally each year. On top of that, poor product availability can slash up to 8% of total revenue due to missed sales opportunities. Regular monitoring allows you to pinpoint top-performing items while identifying deadstock that racks up carrying costs without delivering returns. Automating this process is essential to tackling these challenges efficiently.
Relying on manual spreadsheets for tracking is both time-consuming and prone to errors. That’s where tools like Forstock come in, offering real-time insights, AI-driven demand forecasting, and inventory aging reports. Features like automated reorder points and quick identification of underperforming SKUs let you reallocate resources to products that genuinely contribute to your bottom line.
If you're aiming for a strong GMROI (anything above $3.20 is considered solid), consistent tracking and rapid action are crucial. By applying the metrics and strategies from this guide, you can eliminate deadstock, optimize reordering processes, and improve your cash flow. With Forstock’s automated analytics, you’ll have more time to focus on growing your business.
Don’t wait - start measuring your inventory ROI today. Every dollar tied up in inactive stock is a missed opportunity for growth.
FAQs
What costs should I include in inventory ROI?
When figuring out the ROI for inventory, you need to account for all the costs linked to getting and keeping that inventory. These include the purchase price, shipping, handling, storage, insurance, and even obsolescence. Considering these expenses gives you a clear picture of your total investment and the returns it generates.
How often should I recalculate GMROI?
To keep a clear picture of how your inventory is performing, recalculate GMROI (Gross Margin Return on Investment) on a regular basis - monthly or quarterly works well. By doing this, you'll stay on top of shifts in sales patterns and inventory behavior. These frequent updates can guide you in making smarter, data-driven decisions.
What should I do when a SKU’s GMROI is under $1.00?
If a SKU’s GMROI drops below $1.00, it’s a clear sign to reassess your inventory strategies to improve profitability. This could mean cutting down on overstocked items, finding ways to boost sales efficiency, or rethinking your pricing approach. Since GMROI reflects how much gross margin you earn for every dollar invested in inventory, a figure under $1.00 reveals underperformance and highlights the need for immediate adjustments.
Keep reading
Try Forstock free for 14 days.
AI-powered demand forecasting and reorder automation for Shopify brands. No credit card required.