Demand Variability Analyzer
Analyze product demand fluctuations with our free tool. Understand variability and plan smarter with easy-to-read insights!
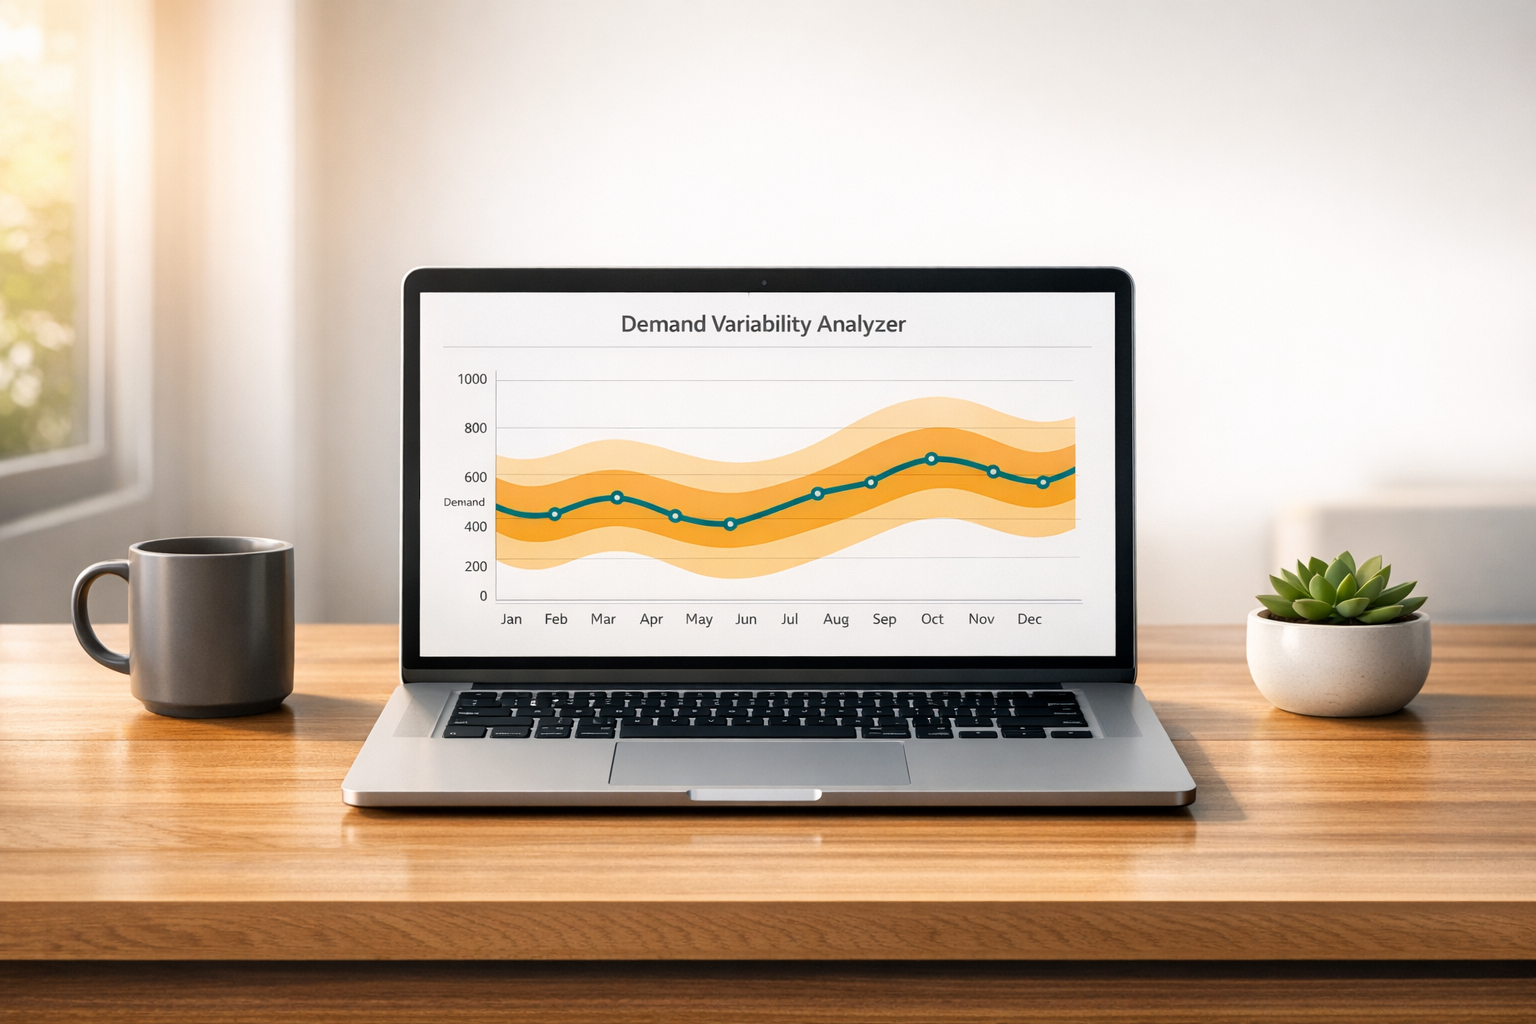
Demand Variability Analyzer
Understand Your Business with a Demand Variability Analyzer
Running a business often feels like navigating a rollercoaster, especially when product demand fluctuates without warning. That’s where a tool to analyze sales variability comes in handy. It takes your historical sales figures and breaks them down into clear metrics, helping you spot patterns and prepare for what’s next.
Why Analyzing Demand Matters
When you’re managing inventory or planning promotions, knowing how much demand shifts over time can be a game-changer. A demand analysis tool calculates key figures like average sales and variability, giving you a snapshot of stability—or lack thereof. This isn’t just about numbers; it’s about making informed choices, whether you’re a small retailer or a growing e-commerce shop.
Beyond Guesswork
Instead of relying on gut feelings, use data to drive decisions. By understanding fluctuations in product interest, you can optimize stock levels, reduce waste, and even improve customer satisfaction. Tools like these are built for busy business owners who need quick, reliable insights without diving into complex spreadsheets. Take control of your planning today and turn raw data into a roadmap for success.
FAQs
What kind of data do I need to use this tool?
You’ll need historical demand data, like monthly sales figures for a product over the past 6 to 12 months. Just pop in at least 3 data points for meaningful results. If you’ve got a spreadsheet, you can copy the numbers and enter them as comma-separated values or type them into individual fields. It’s pretty flexible!
What does the Coefficient of Variation tell me?
Think of the Coefficient of Variation as a measure of how unpredictable your demand is. It’s calculated by dividing the Standard Deviation by the Average Demand and turning it into a percentage. A higher number means your demand swings a lot, so you might need to keep extra stock or adjust ordering. A lower number suggests steadier demand, which makes planning easier.
What happens if I enter invalid data?
No worries—we’ve got checks in place. If you enter fewer than 3 data points, non-numeric values, or negative numbers, the tool won’t run the analysis. Instead, you’ll see a friendly message like ‘Please enter at least 3 valid data points for analysis.’ Just fix the input, and you’re good to go.
Try Forstock free for 14 days.
AI-powered demand forecasting and reorder automation for Shopify brands. No credit card required.