Stock Performance Analyzer
Analyze your inventory turnover with our free Stock Performance Analyzer. Get key metrics like turnover ratio and days to sell in seconds!
Stock Performance Analyzer
Optimize Your Business with a Stock Performance Analyzer
Running a small business or managing a larger operation comes with the constant challenge of balancing inventory. Too much stock ties up your cash, while too little risks lost sales. That’s where understanding your inventory efficiency becomes a game-changer. By diving into key metrics, you can make informed decisions that keep your operations humming.
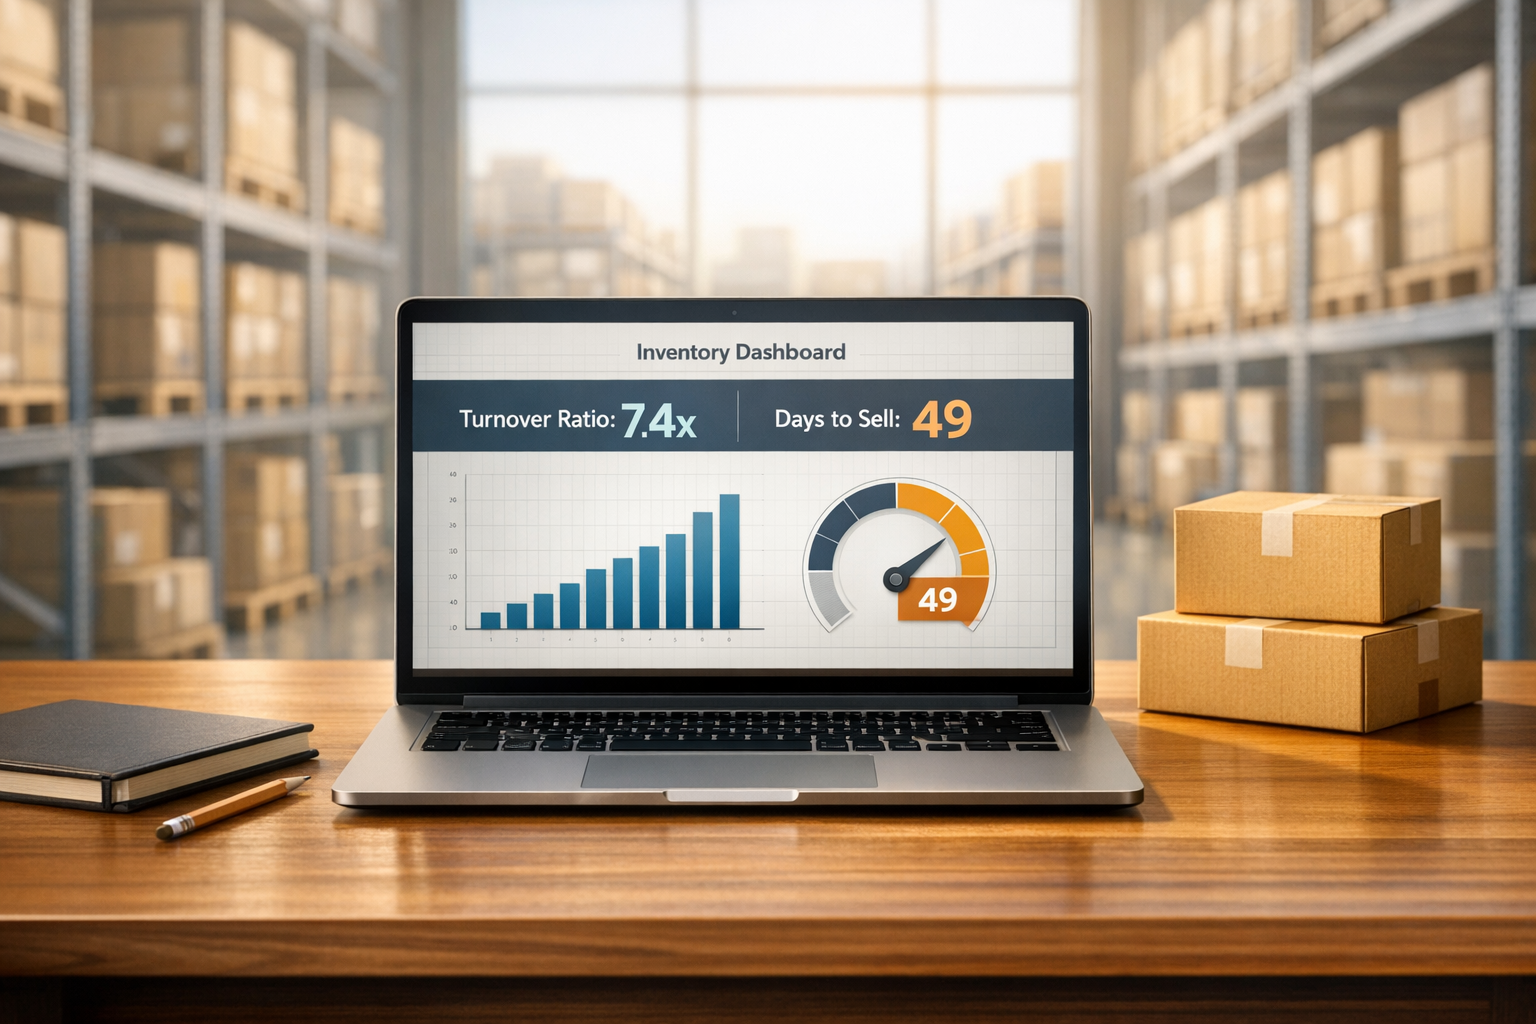
Why Inventory Metrics Matter
One of the most critical insights for any business owner is how quickly goods move off the shelves. A tool designed for stock analysis can break down complex numbers into actionable data, like turnover ratios and sales cycles. These figures reveal whether your inventory strategy aligns with demand or if adjustments are needed. For instance, spotting a slow-moving product early lets you pivot with promotions or discounts before it becomes a financial burden.
Take Control of Your Stock
Beyond just crunching numbers, evaluating stock performance empowers you to forecast better, reduce waste, and improve cash flow. Whether you’re in retail, manufacturing, or e-commerce, staying on top of these metrics is essential for growth. Try analyzing your inventory data today—it’s a small step that can lead to big improvements in how you manage your business.
FAQs
What is inventory turnover, and why does it matter?
Inventory turnover measures how often your stock is sold and replaced over a specific period. A higher ratio usually means you’re selling efficiently, while a lower one might signal overstocking or slow sales. Knowing this helps you avoid tying up cash in unsold goods and ensures you’re meeting customer demand without shortages.
How do I interpret the average days to sell inventory?
This number tells you, on average, how many days it takes to sell through your inventory. If it’s a high number, your stock might be sitting too long, costing you storage fees or risking obsolescence. A lower number suggests quick sales, which is great—but make sure you’re not understocked and missing out on potential revenue!
Can I analyze multiple periods with this tool?
Right now, this tool focuses on a single dataset at a time to keep things simple and clear. If you want to compare different periods, just run separate analyses by entering the data for each timeframe individually. It’s a straightforward way to track trends over months or quarters.
Try Forstock free for 14 days.
AI-powered demand forecasting and reorder automation for Shopify brands. No credit card required.